Elearnmarkets - Financial Market Learning
  • Courses
  • Webinars
  • Stories
  • Language
    • English
    • Hindi
    • Bengali
No Result
View All Result
Get Free Course
  • Basic Finance
  • Derivatives
    • Futures
    • Options
  • Financial Planning
  • Fundamental Analysis
  • Technical Analysis
  • Mutual Funds
  • Marketshala
  • Miscellaneous
Elearnmarkets - Learn Stock Market, trading, investing for Free
  • Courses
  • Webinars
  • Stories
  • Language
    • English
    • Hindi
    • Bengali
No Result
View All Result
Get Free Course
Elearnmarkets - Learn Stock Market, trading, investing for Free
No Result
View All Result
Home Technical Analysis
Pipe Tops and Pipe Bottoms Candlestick Chart Pattern

Pipe Tops and Pipe Bottoms Candlestick Chart Pattern

Elearnmarkets by Elearnmarkets
February 27, 2025
in Technical Analysis, Charts, Patterns & Indicators
Reading Time: 6 mins read
1
6.6k
VIEWS
Share on FacebookShare on XShare on WhatsApp

Candlestick chart patterns are one of the most commonly used trading patterns amongst the trader’s community. Not only they are easy to spot, they are also easy to trade. That is the reason most traders love to trade candlestick chart patterns.

We know that there are different types of candlestick patterns which are available to trade. Some patterns are the blend of three candles whereas some patterns consist only two, also there is a tradeable pattern which carries only one candle. Not only in the candlestick charts but this patterns can also be found in bar charts.

Table of Contents
Identification of Pipe Tops and Bottoms
The psychology behind the candles
Pipe Tops and Bottom Trading Pattern
Real-time Examples
Bottom Line

In this article, we are going to discuss double candlestick formation patterns named ‘Pipe Tops’ and Pipe Bottoms’ which were identified by Thomas N. Bukowski (Investor and Technical Analyst). The pattern is suitable for any time frame but it performs better in a longer time frame (weekly or monthly).

pipe tops bottom

Also read: Japanese Candlestick Pattern: MARUBOZU

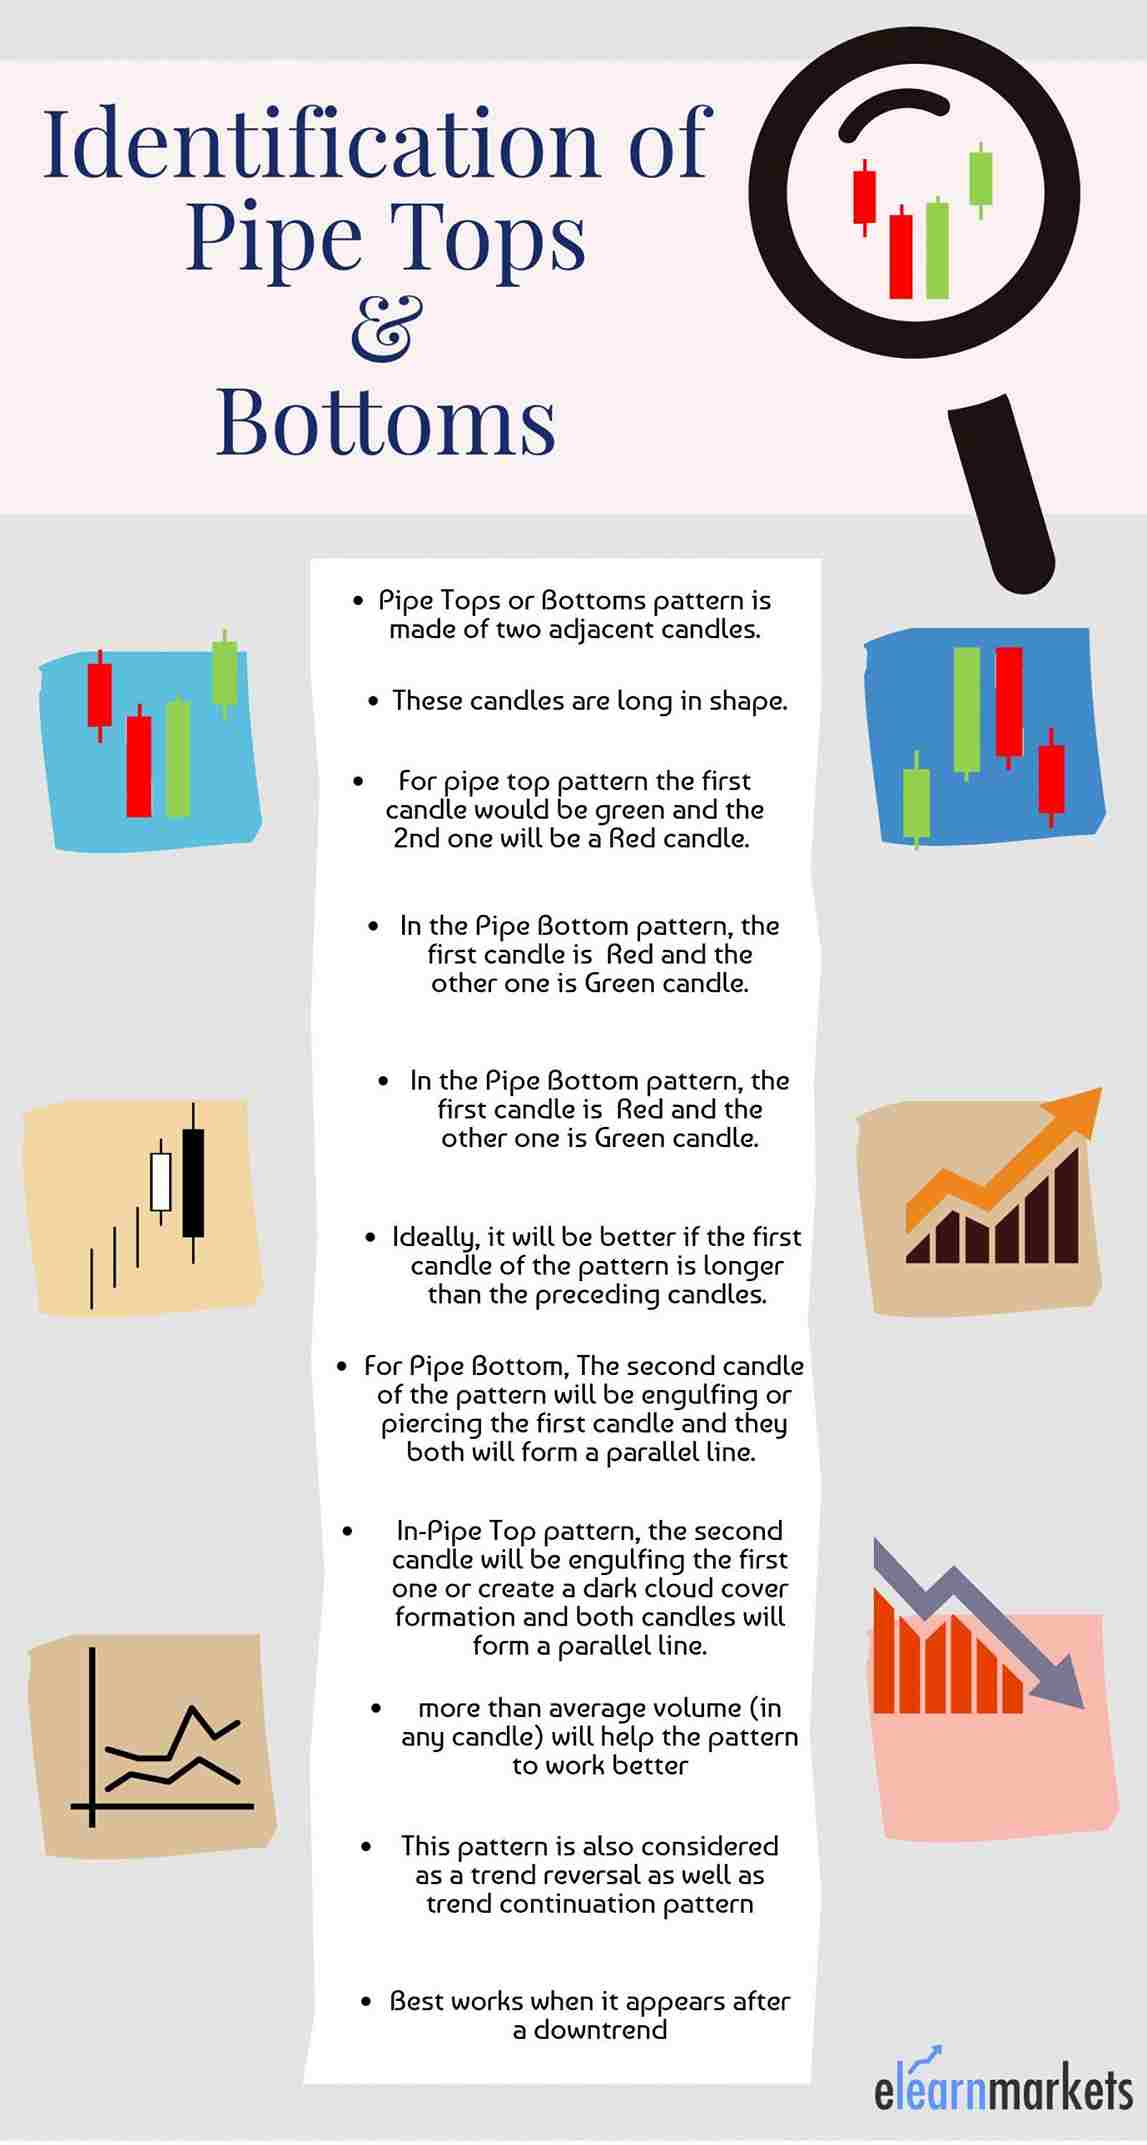
Many of the traders are quite familiar with ‘Bullish Engulfing’ and ‘Piercing Pattern’ as bullish reversal patterns. Some special cases among these two patterns are classified as ‘Pipe Bottoms’. Similarly, on the bearish side, some exclusive instances of ‘Bearish Engulfing’ and ‘Dark Cloud Cover’ falls into the category of pipe tops.

Identification of Pipe Tops and Bottoms

Identification of Pipe Tops and Pipe Bottoms Candlestick Chart Pattern

The psychology behind the candles:

There is psychology involved in every candlestick formation. So, it is obvious that the pattern will also have a psychology backing up since they are formed by candles.

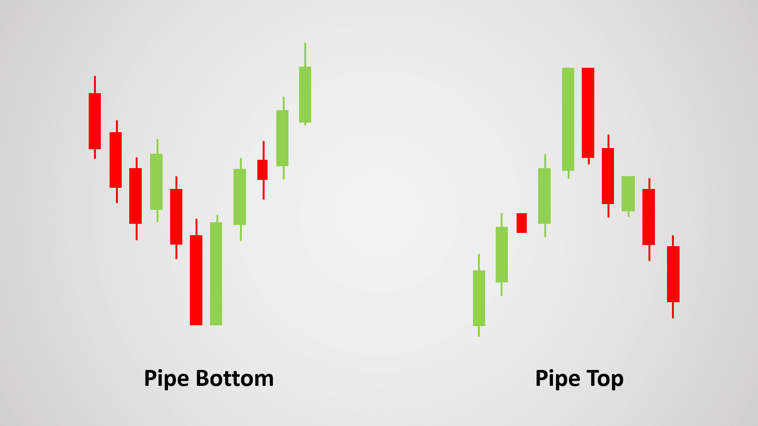
Pipe Tops formation indicates that the bulls are exhausted to push the market upwards and bears are preparing to make the market fall. Just the opposite happens in Pipe Bottoms formation Where the Sellers lose their momentum to pull the market further down and the bulls start to take control of the market.

Pipe Tops and Bottom Trading Pattern:

Trading the pattern is our ultimate motto. As we have seen that the pattern is self-expressive, so we can follow the thumb rule here. But what is that thumb rule?
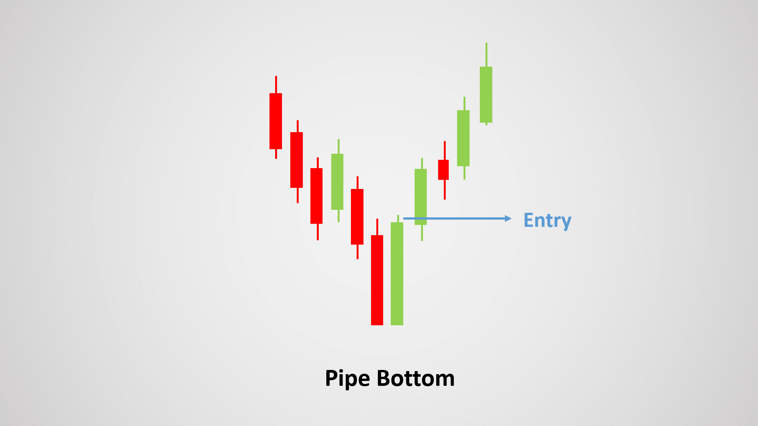
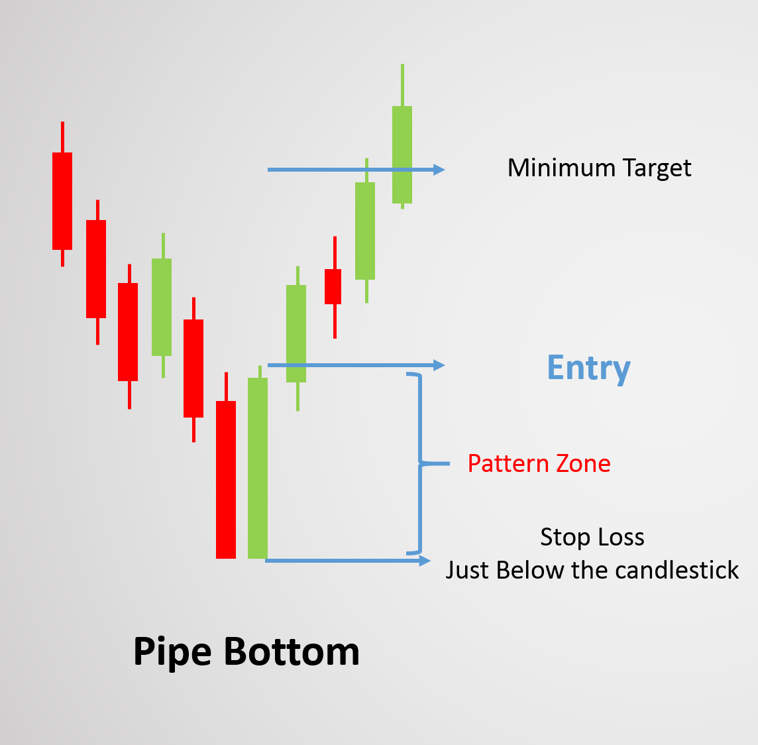
Entry:

As you know that Pipe bottoms come after a downtrend and it contains a Red (First candle) and a Green (second candle) candle. After the pattern is confirmed we will take a long position. Take your entry after the price crosses the highest point of the pattern.

pipe bottom entry

The exact opposite should be done in case of Pipe Tops formation. On the top of an uptrend, a red candle is formed followed by a green candle. We have to take our short position just below the lowest point of the pattern.

pipe top entry

Target:

Booking the profit is little tricky for this candlestick pattern. Basically, traders measure the distance between High and low of the pattern. Then it is added to the highest point of the pattern (For Pipe Bottoms pattern). This should be our first target where we can book our partial or full profit.

target

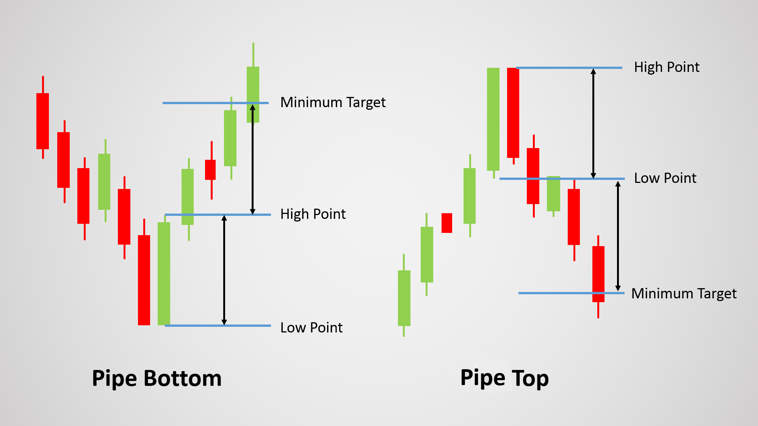
Similarly, for Pipe Tops pattern, the difference between high and low points is subtracted from the lowest point of the pattern.

Stop loss:

The stop loss is actually very costly for this pattern. As per the basic thumb rule, we should put our stop just below the pattern. But, in any case, if it gets a hit, the loss will be really expensive to bear.

Otherwise, we can put the stop or get out from the existing position if the price starts trading within the pattern’s range (High and low point).

stop loss function

Real-time Examples:

icici bank chart

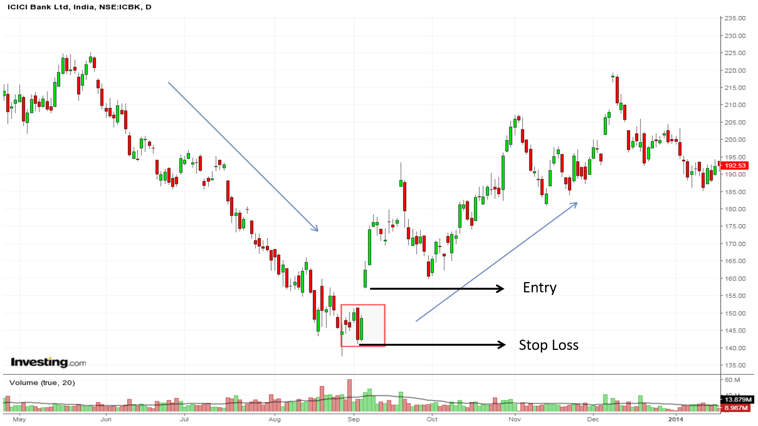
Here we have the one-day chart of ICICI Bank Ltd (September 2014). After a Prolonged downtrend, the Pipe Bottom formation appears. See how price reverted back from that level.

nifty chart

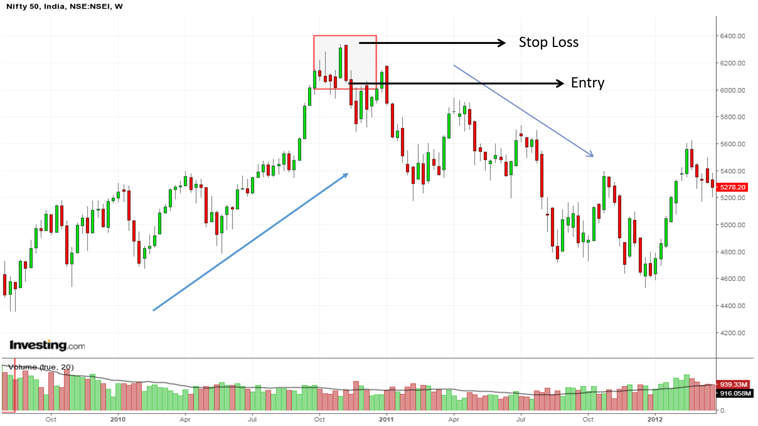
In the Nifty 50 weekly chart (October 2010), a Pipe Top formation has been spotted. The pattern appeared on the top of an uptrend and after the formation, we witnessed how price fell from that level.

pipe bottom chart

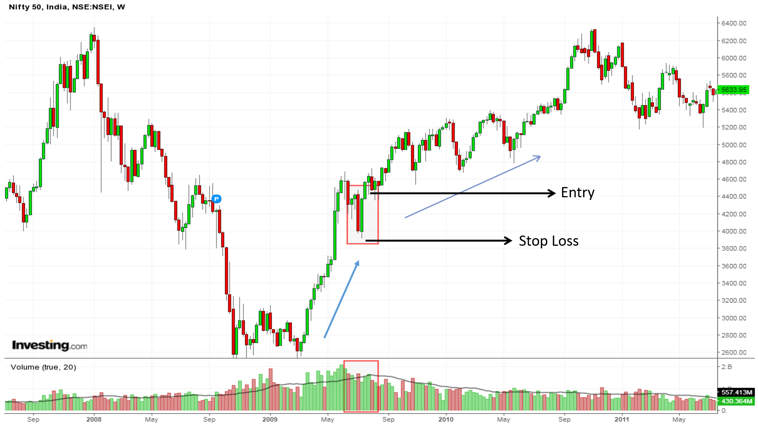
Here is another chart of Nifty 50 (June 2009). This is an example of Pipe Bottom pattern. But, in this scenario, this formation worked as a price continuation pattern. The uptrend started from level 2600 and continued up to level 4600 until it faced the resistance of 5000 level. The pattern appeared after a short-term downfall and from that level, the market again started moving upward with its bullish sentiment.

Conclusion

Candlestick patterns or Bar patterns are always fun to trade. But we have to recognize the pattern perfectly.

We are reiterating the fact that ‘Pipe Bottoms’ are special cases among ‘Bullish Engulfing’ and ‘Piercing Patterns’ where the lengths of two candles forming the pattern are much higher than previous candles. Similarly, in the case of ‘Pipe Tops’.

Timing your entry and exit is also important while trading this kind of pattern. However, In the longer time frame, this rule is not applicable.

You can take the help of moving averages or any indicators and oscillators to take better entry and exit decisions.

Please remember that volume will be the key player when trading this pattern. So always watch for the adequate amount of volume before considering it a pattern.

In order to get the latest updates on Financial Markets visit https://stockedge.com/

Tags: candlestick chartscandlestick patternchart patternenglishpipe bottom patternpipe top pattern
ShareTweetSend
Get Kotak Offer Get Kotak Offer Get Kotak Offer
Previous Post

10 Basic Rules of Trading to Always Stay in Profit

Next Post

Problems in Technical Analysis and How to Overcome Them

Elearnmarkets

Elearnmarkets

Elearnmarkets (ELM) is a complete financial market portal where the market experts have taken the onus to spread financial education. ELM constantly experiments with new education methodologies and technologies to make financial education effective, affordable and accessible to all. You can connect with us on Twitter @elearnmarkets.

Related Posts

Understand Slippage in Trading
Technical Analysis

What is Slippage in Trading? Meaning & Examples

March 28, 2025
308
Breakout trading strategies
Technical Analysis

Top 5 Breakout Trading Strategies

March 12, 2025
1.1k
5 stocks for today
Technical Analysis

5 Stocks to Buy Today That Could Beat the NIFTY in 2025!

May 5, 2025
406
Image describing What is marginal trading facility
Technical Analysis

 What is a Margin Trading Facility? Advantages & Risks

April 4, 2025
666

Comments 1

  1. frolep rotrem says:
    5 years ago

    Thanks for the auspicious writeup. It actually used to be a entertainment account it. Look advanced to far introduced agreeable from you! By the way, how can we keep up a correspondence?

    Reply

Leave a Reply Cancel reply

Your email address will not be published. Required fields are marked *

Disclaimer

Elearnmarkets (Kredent InfoEdge Pvt. Ltd.) is a SEBI-registered Research Analyst (RA) entity (SEBI Registration No.: INH300007493). The information provided in this article is for educational and informational purposes only and should not be considered as an offer to buy or sell any securities or investment products.

The stocks, securities, and investment instruments mentioned herein are not recommendations under SEBI (Research Analysts) Regulations, 2014. Readers are advised to conduct their own due diligence and seek independent financial advice before making any investment decisions.

Investments in securities markets are subject to market risks. Please read all related documents carefully before investing. Investing in Equity Shares,
Derivatives, Mutual Funds, or other instruments carry inherent risks, including potential loss of capital. Elearnmarkets (Kredent InfoEdge Pvt. Ltd.) does not provide any guarantee or assurance of returns on any investments. Past performance is not indicative of future performance.

Elearnmarkets Logo

Follow Us

Facebook-f X-twitter Instagram Linkedin-in Youtube Telegram

Register on Elearnmarkets

Continue your financial learning by creating your own account on Elearnmarkets.com

Register Free Account

Download App

Playstore logo
Download on app store

Categories

  • Basic Finance
  • Derivatives
  • Financial Planning
  • Fundamental Analysis
  • Technical Analysis
  • Mutual Funds
  • Miscellaneous

Popular On Elearnmarkets

  • Market Superheroes:
  • Vivek Bajaj
  • Chetan Panchamia
  • Ashish Kyal
  • Premal Parekh
  • Abhijit Paul
  • Jegan
  • Sivakumar Jayachadran
  • Jyoti Budhia
  • Vivek Gadodia
  • Vishal Mehta
  • Piyush Chaudhry
  • Santosh Pasi
  • Gomathi Shankar
  • Market Superheroes:
  • Vivek Bajaj
  • Chetan Panchamia
  • Ashish Kyal
  • Premal Parekh
  • Abhijit Paul
  • Jegan
  • Sivakumar Jayachadran
  • Jyoti Budhia
  • Vivek Gadodia
  • Vishal Mehta
  • Piyush Chaudhry
  • Santosh Pasi
  • Gomathi Shankar
  • Courses:​
  • Options Trading
  • Dow Theory
  • Momentum Trading
  • Stock Investing
  • Harmonic Chart Patterns
  • Algo Trading
  • Elliot Wave Theory
  • Advanced Excel
  • Cryptocurrency
  • NSE Certification Course
  • Courses:​
  • Options Trading
  • Dow Theory
  • Momentum Trading
  • Stock Investing
  • Harmonic Chart Patterns
  • Algo Trading
  • Elliot Wave Theory
  • Advanced Excel
  • Cryptocurrency
  • NSE Certification Course
  • Webinars:
  • Bank Nifty Scalping
  • Intraday Trading Strategies
  • Options Trading Strategies
  • Options selling
  • Price Action
  • Relative Strength
  • Tax Planning
  • Options Buying
  • Growth Stocks
  • Portfolio Management
  • Risk Management
  • Renko Charts
  • Crude Oil
  • Traders Psychology
  • Moving Average
  • Multibagger Stocks
  • Free Learning Modules:
  • Intraday Trading
  • Options Scalping
  • Swing Trading
  • Financial Modelling
  • RSI Indicator
  • Bollinger Bands
  • Pricing of Futures
  • Personal Finance
  • Initial Public Offerings (IPO)
  • Value Investing
  • Technical Indicators
  • Candlesticks
  • Chart Patterns
  • Option Greeks
  • ELSS Funds
  • Banking and Insurance
  • Real Estate
  • Gold
  • Book Summaries:
  • Rich Dad Poor Dad
  • Psychology of Money
  • The Intelligent Investor
  • The Richest Man in Babylon
  • Think and Trade Like a Champion
  • Value Investing and Behavioural Finance
  • Trading in the Zone
  • Learn to Earn
  • Book Summaries:
  • Rich Dad Poor Dad
  • Psychology of Money
  • The Intelligent Investor
  • The Richest Man in Babylon
  • Think and Trade Like a Champion
  • Value Investing and Behavioural Finance
  • Trading in the Zone
  • Learn to Earn
  • Tools:
  • CAGR Calculator
  • SIP Calculator
  • eLearnOptions
  • Future Value Calculator
  • Present Value Calculator
  • Atal Pension Yojana
  • Cost of Delay Calculator
  • Become a Crorepati
  • Tools:
  • CAGR Calculator
  • SIP Calculator
  • eLearnOptions
  • Future Value Calculator
  • Present Value Calculator
  • Atal Pension Yojana
  • Cost of Delay Calculator
  • Become a Crorepati

© 2025 Elearnmarkets. All Rights Reserved

  • Visit Elearnmarkets
  • Courses
  • Webinars
  • Financial Guides
  • Get Free Counselling
  • Visit Elearnmarkets
  • Courses
  • Webinars
  • Financial Guides
  • Get Free Counselling

Download Our App

No Result
View All Result
  • Article Categories
    • Basic Finance
    • Derivatives
    • Financial Planning
    • Fundamental Analysis
    • Technical Analysis
    • ETFs & Mutual Funds
    • Marketshala
    • Miscellaneous
  • Language
    • Hindi
    • Bengali
    • English
  • Courses
  • Webinars
  • Stories
Get Free Course

© 2024 Elearnmarkets All Rights Reserved

A Handbook of Technical Analysis
To start your trading journey as a seasoned technical analyst
Download Guide For FREE
Guidebook On Chart Patterns
Take Your Trading To The Next Level With Strategies Shared In This Ebook
Download Guide For FREE
Trading Mentorship Program