
Chart Patterns are many but out of all the chart pattern, we are going to show you some of the most Important Chart Pattern that can be used by Technical Analysts & Fundamental Analysts.
The two primary method to analyse securities in the stock market is through Fundamental Analysis and Technical Analysis. Fundamental analysis is studying of the financial statement of the companies to determine the value of the company using various forecasting methods to conclude which is the right price to enter a particular stock. In technical analysis people assume that the fair value of the stock is already factored into the stock and it uses price movements on the chart to predict the future price of the stock.
Chart Patterns is Part of Technical Analysis. Before going in depth about Chart Pattern let us first understand the two Most Important Concepts in Technical Analysis which is Breakout and Breakthrough.
| Table of Contents |
|---|
| Difference between Breakout & Breakthrough |
| Difference between Breakout & Breakthrough |
| How to find out a breakthrough in charts? |
| What is Break Through Pattern? |
| Conclusion |
Difference between Breakout & Breakthrough
The subtle difference between them is what makes, even more, important to understand.
Both the above scenarios are traded differently, and their expected return vary broadly. The way to find these opportunities is also different. To find a breakout a simple research would suffice, but in case of a breakthrough, a through research beyond technical analysis will be required.
Let’s first understand the difference.
Breakout is something like to pass the enemy line. Or advance through something. Something similar to what we have discussed above.
Something like breaking the trendline. Any point in time a breakout from the trendline or a creating a new trendline would result in a change in the course of price movement. This takes time to predict, but the change lasts from few weeks to few months.
This happens usually when small news flow in, new order, change in management, new opportunity, new market entry etc. The impact is for a limited period of time.
Now! Breakthrough
Breakthrough is my favourite.
Breakthrough is a significant progress or overcoming some major obstacle.
Some companies have been hampered by certain catastrophic challenges which they were not able to overcome. Something like their product been banned in a country, losing manufacturing license, becoming a loss-making company, burdened with debt etc. Now, this takes time to overcome. This does not happen instantly.
How to find out a breakthrough in charts?
Any stock price which is moving sideways for more than 7 years and hits all-time high or 7 years high the stock has entered into the breakthrough zone. The market has all the information which is getting factored into the stock price before we know about it.
Learn to trade with Technical analysis made easy course by Market Experts
The right time to enter such a stock is to wait and watch for it to test the all-time high again. Since this was a major resistance for an extended period of time, it would take a chance to break. Once it has tested all-time high price, it is the right opportunity to enter the stock at those levels.
Looking for breakthrough opportunities is always preferable over breakouts.
What is Breakout Patterns?
The breakout is usually for a shorter period of time. And a break can deviate in the stock market. The probability of the breakout is low because of the duration and changing factors in the short term. Will List down the list of Breakout Patterns.
Types of Breakout Patterns
1) Triangle Breakout and Parablic Breakout
2) Ascending Breakout
3) Failed Descending Traingle
4) Triangle Breakout in a Trend
5) Rounded Breakout
6) Bull or Bear Flag
7) Rectangle Breakout
8) Cup & Handle Breakout
9) Wedge Breakout
10) Double 0r Triple – Bottom/Top
The above mentioned breakout patterns are very popular and most commonly used. The difference is that their porbability is not worth the time, money and energy invested. The returns are usually 2X or 3x which is the best possible chance.
The number of occurrences is very high and choosing the right breakout becomes very tough in this scenario. One has to be very cautious while selecting the right breakout for the right stock..
Also Read : How to Trade Opening Range Breakouts
Becuase of its nature of short duration, it becomes even more important that one should judge spikes as a breakout. Spikes are mostly misjudged as a breakout. Except for Double, Triple – Bottom/Top, Rectangle breakout other are difficult to be used for longer period of time.
What is Break Through Pattern?
Every year one could get few opportunities to find a break through stocks. Break through can be found with two aspects one is with beaten down stocks and secondly with stock that is consolidating over a long period of time.
In both the above scenario, fundamentally, [S]tock could be found at a relatively with a margin of safety.
Breakthrough can be found with longer-term consolidation which usually ranges around seven years. The best example for this is Reliance stock which was trading at around Rs.1000 for a very long period of time and the breakthrough has started in the year of 2016 last quarter and this is giving a very good return and this stock is still in the “hold” by most brokerages houses.
If you are a fundamental analyst then you can think of the beaten down stock since they carry their own risks. Challenges for a company which take a long time to over come are usually these types of companies. Once they are out of their negative period the returns they give you maginificent. Genreally they are over 5X. This can also be expected from Blue Chip companies.
Chart- 1
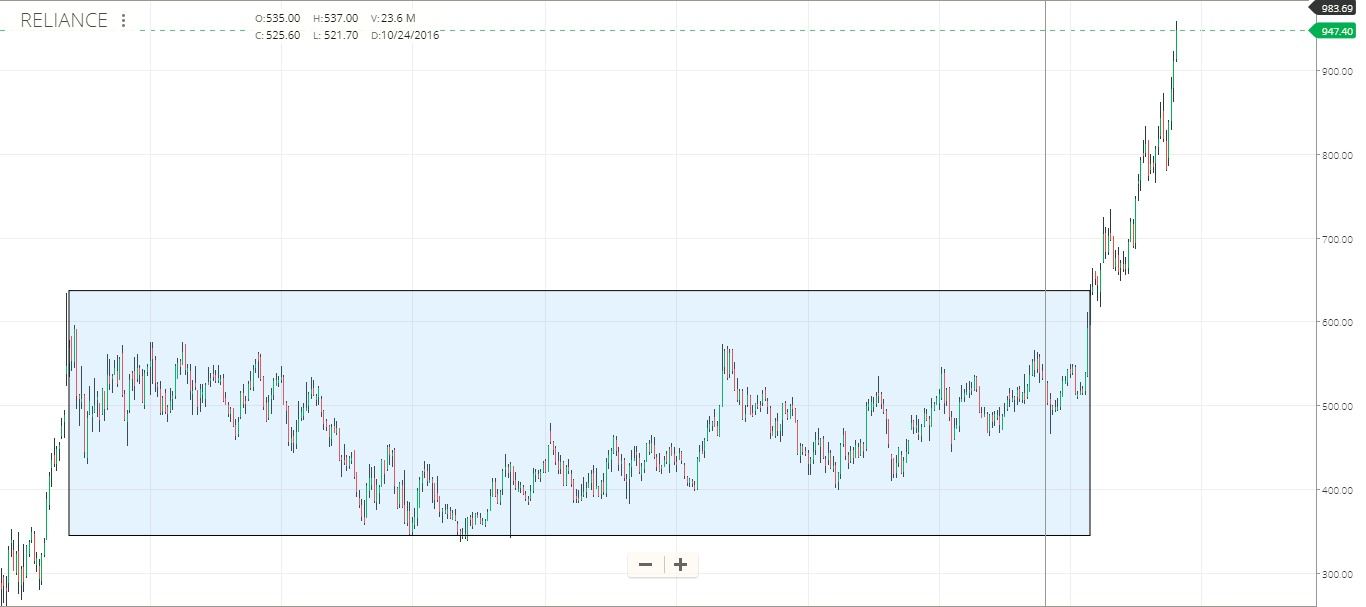

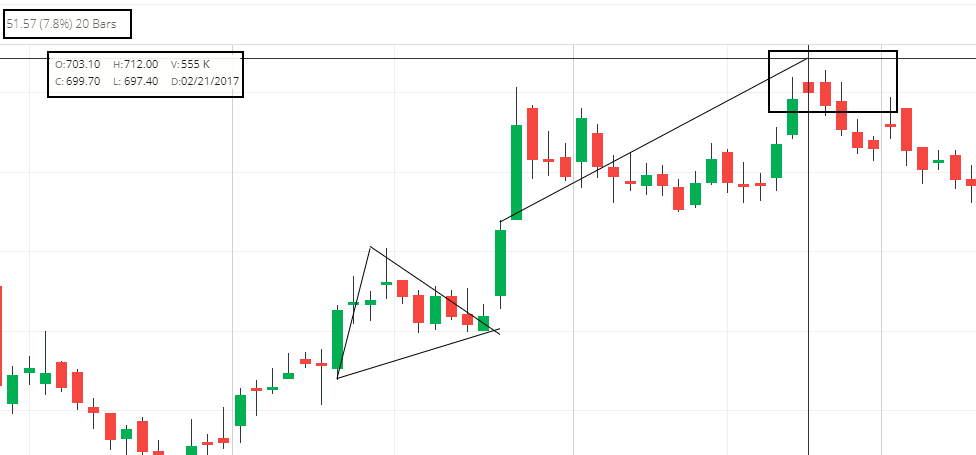
Chart- 2
Types of Break Through Patterns
1) Consolidation e.i. Rectanlge Breakout
2) Rounding Bottom
Although limited by choice they are very effective. If you have ever read Paretao 80/20 principle. Stock through this method will help you find that 20% that you are looking for.
Fundamentally expensive stocks can also be a part of this breakout. While certain stocks are consolidating there are high chances that the stocks are still expensive.
Do not mistake Penny stocks with Break through stocks both the concepts are entirely different. Penny stock can be a Breakthrough stock but break through stock need not necessarily be a penny stock.
Conclusion
Do let me know if you’ve ever found a stock & are making money from it. Share your experience & learnings in the comments section below.
If you are not following the breakthrough strategy in finding stock you are leaving lot of money on the table.
Take out every word that doesn’t contribute something new.
Come back here and tell us about the before-and-after. I bet you’ll have something to say!
If you enjoyed this post, I’d be very grateful if you’d help it spread by emailing it to a friend, or sharing it on Twitter or Facebook. Thank you!


This is an Amazing Article Thanks for Writing Such a Wonderful things. Until now I did not know why I was getting wrong. From now on I am going to focus only on breakouts. Such a wonderful thing is said in a very simple form.
Loved this article. Interesting facts covered. “Do not mistake Penny stocks with Breakthrough stocks both the concepts are entirely different” this is my favorite point.
A very good article summarizing the usual occurences and pointing out the ways to differentiate grain from the chaff
Observing something similar in DLf charts
Chart Pattern is very important. But this article really showed the right way you can take maximum benefit from the chart pattern. Loved the post. Looking forward to more such posts.
Hello Phillip,
Thank you for your comment
To get a more comprehensive idea of technical analysis, you may do NSE Academy Certified Technical Analysis
Happy Learning!
Amazing article Chintan Sir just realized how wrong I had always been while choosing the chart pattern.
Thank You, Tista Sengupta, will go through the Certified Course suggested by you. I should have taken this course long back.
Thank You again great learning.
Welcome Arjun
Great info, thanks for the share!
Hi,
Thank you for Reading!
Keep Reading
Amazing article. Looking forward to more such posts.
Hi,
Thank you for Reading!
Keep Reading!
How trade in us market
Hi,
If you want to trade in the US Stock market, you can trade through Depository Receipts.
Thank you for Reading!