Elearnmarkets - Financial Market Learning
  • Courses
  • Webinars
  • Stories
  • Language
    • English
    • Hindi
    • Bengali
No Result
View All Result
Get Free Course
  • Basic Finance
  • Derivatives
    • Futures
    • Options
  • Financial Planning
  • Fundamental Analysis
  • Technical Analysis
  • Mutual Funds
  • Marketshala
  • Miscellaneous
Elearnmarkets - Learn Stock Market, trading, investing for Free
  • Courses
  • Webinars
  • Stories
  • Language
    • English
    • Hindi
    • Bengali
No Result
View All Result
Get Free Course
Elearnmarkets - Learn Stock Market, trading, investing for Free
No Result
View All Result
Home Technical Analysis
4 mistakes that Traders should avoid while Trading with Fibonacci 1

4 mistakes that Traders should avoid while Trading with Fibonacci

Elearnmarkets by Elearnmarkets
February 27, 2025
in Technical Analysis
Reading Time: 5 mins read
0
7.9k
VIEWS
Share on FacebookShare on XShare on WhatsApp

Fibonacci Retracement levels help us to identify reversal areas thus helping us in identifying entry points or exit points after a pullback.

Some of the traders use this technical indicator sometimes while others traders use it regularly.

It does not how often the traders use retracement levels, but it is important to use it correctly every time we trade.

Here are some of the mistakes that traders should avoid while trading with Fibonacci.

Table Of Contents
  • Not keeping Reference Points Consistent:
  • Ignoring Long Term Trends:
  • Relying on Short Term Trends:
  • Using Fibonacci Alone:
  • Key Takeaways:

1. Not keeping Reference Points Consistent:

One should keep the Fibonacci reference points consistent when they draw retracements levels on the charts.

 So, when drawing the it on the charts one should draw if from the lowest price of a trend through the top of a trend and from the lowest price of the trading session to the highest price of the close of a session.

This means one should take Fibonacci reference points from candle body to candle body and from shadow to shadow.

The wrong reference points lead to incorrect analysis.

Traders often make mistakes when they draw it from a candle wick to the candle’s body.

Below is an example of how Fibonacci levels should be drawn on the charts.

Fibonacci

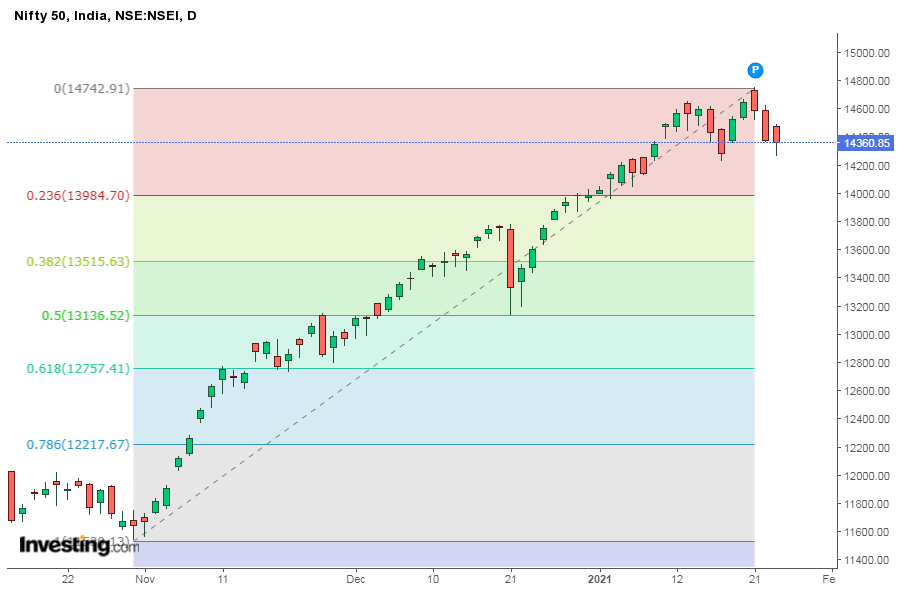
From the above Daily chart of Nifty 50, we can see how Retracement levels are drawn from the lowest wick to the highest wick through the uptrend.

2. Ignoring Long Term Trends:

Novice traders try to pullbacks in the short term without looking at the longer trend.

The short-term traders make mistakes by this narrow perspective.

The traders can apply it by looking at the long-term trend in the correct price direction of the momentum and this will help in picking trading opportunities.

3. Relying on Short Term Trends:

There is a lot of volatility in day trading because of this retracements are not that effective in a short timeframe as compared to the longer term.

Retracement levels are less reliable in the shorter timeframes.

Volatility can often change support and resistance levels which makes it difficult for the traders to pick or choose which support and resistance levels can be traded.

Also in the short-term timeframe, spikes and whipsaws are also very common.

This makes it difficult for the traders to place stop-loss or to book profits when using the retracements levels for short-term trading.   


4. Using Fibonacci Alone:

Fibonacci is a reliable trade setup but one should not trade without confirmation by other technical indicators.

Traders can apply other technical tools like RSI or stochastic oscillators that will help in confirming the trade opportunity and also increase risk-reward ratio for a good trade.

Traders can also use candlestick patterns when confirming the trading signals given by the retracement levels.

To learn more about Fibonacci you can check out Technical Analysis Made Easy

Key Takeaways:

  • One should keep the Fibonacci reference points consistent when they draw Fibonacci retracements levels on the charts.
  • The traders can apply Fibonacci retracements by looking at the long-term trend in the correct price direction of the momentum and this will help in picking trading opportunities.
  • Fibonacci is a reliable trade setup but one should not trade without confirmation by other technical indicators.
  • Retracement levels are less reliable in the shorter timeframes.

Happy Learning!

Tags: advancefibonacci and stock market analysisfibonacci levelsmistakes
ShareTweetSend
Get Kotak Offer Get Kotak Offer Get Kotak Offer
Previous Post

Share Warrants vs Rights Issue – What you should know?

Next Post

Factors that affect EBITDA and EBIT

Elearnmarkets

Elearnmarkets

Elearnmarkets (ELM) is a complete financial market portal where the market experts have taken the onus to spread financial education. ELM constantly experiments with new education methodologies and technologies to make financial education effective, affordable and accessible to all. You can connect with us on Twitter @elearnmarkets.

Related Posts

Understand Slippage in Trading
Technical Analysis

What is Slippage in Trading? Meaning & Examples

March 28, 2025
296
Breakout trading strategies
Technical Analysis

Top 5 Breakout Trading Strategies

March 12, 2025
1.1k
5 stocks for today
Technical Analysis

5 Stocks to Buy Today That Could Beat the NIFTY in 2025!

May 5, 2025
397
Image describing What is marginal trading facility
Technical Analysis

 What is a Margin Trading Facility? Advantages & Risks

April 4, 2025
661

Leave a Reply Cancel reply

Your email address will not be published. Required fields are marked *

Disclaimer

Elearnmarkets (Kredent InfoEdge Pvt. Ltd.) is a SEBI-registered Research Analyst (RA) entity (SEBI Registration No.: INH300007493). The information provided in this article is for educational and informational purposes only and should not be considered as an offer to buy or sell any securities or investment products.

The stocks, securities, and investment instruments mentioned herein are not recommendations under SEBI (Research Analysts) Regulations, 2014. Readers are advised to conduct their own due diligence and seek independent financial advice before making any investment decisions.

Investments in securities markets are subject to market risks. Please read all related documents carefully before investing. Investing in Equity Shares,
Derivatives, Mutual Funds, or other instruments carry inherent risks, including potential loss of capital. Elearnmarkets (Kredent InfoEdge Pvt. Ltd.) does not provide any guarantee or assurance of returns on any investments. Past performance is not indicative of future performance.

Elearnmarkets Logo

Follow Us

Facebook-f X-twitter Instagram Linkedin-in Youtube Telegram

Register on Elearnmarkets

Continue your financial learning by creating your own account on Elearnmarkets.com

Register Free Account

Download App

Playstore logo
Download on app store

Categories

  • Basic Finance
  • Derivatives
  • Financial Planning
  • Fundamental Analysis
  • Technical Analysis
  • Mutual Funds
  • Miscellaneous

Popular On Elearnmarkets

  • Market Superheroes:
  • Vivek Bajaj
  • Chetan Panchamia
  • Ashish Kyal
  • Premal Parekh
  • Abhijit Paul
  • Jegan
  • Sivakumar Jayachadran
  • Jyoti Budhia
  • Vivek Gadodia
  • Vishal Mehta
  • Piyush Chaudhry
  • Santosh Pasi
  • Gomathi Shankar
  • Market Superheroes:
  • Vivek Bajaj
  • Chetan Panchamia
  • Ashish Kyal
  • Premal Parekh
  • Abhijit Paul
  • Jegan
  • Sivakumar Jayachadran
  • Jyoti Budhia
  • Vivek Gadodia
  • Vishal Mehta
  • Piyush Chaudhry
  • Santosh Pasi
  • Gomathi Shankar
  • Courses:​
  • Options Trading
  • Dow Theory
  • Momentum Trading
  • Stock Investing
  • Harmonic Chart Patterns
  • Algo Trading
  • Elliot Wave Theory
  • Advanced Excel
  • Cryptocurrency
  • NSE Certification Course
  • Courses:​
  • Options Trading
  • Dow Theory
  • Momentum Trading
  • Stock Investing
  • Harmonic Chart Patterns
  • Algo Trading
  • Elliot Wave Theory
  • Advanced Excel
  • Cryptocurrency
  • NSE Certification Course
  • Webinars:
  • Bank Nifty Scalping
  • Intraday Trading Strategies
  • Options Trading Strategies
  • Options selling
  • Price Action
  • Relative Strength
  • Tax Planning
  • Options Buying
  • Growth Stocks
  • Portfolio Management
  • Risk Management
  • Renko Charts
  • Crude Oil
  • Traders Psychology
  • Moving Average
  • Multibagger Stocks
  • Free Learning Modules:
  • Intraday Trading
  • Options Scalping
  • Swing Trading
  • Financial Modelling
  • RSI Indicator
  • Bollinger Bands
  • Pricing of Futures
  • Personal Finance
  • Initial Public Offerings (IPO)
  • Value Investing
  • Technical Indicators
  • Candlesticks
  • Chart Patterns
  • Option Greeks
  • ELSS Funds
  • Banking and Insurance
  • Real Estate
  • Gold
  • Book Summaries:
  • Rich Dad Poor Dad
  • Psychology of Money
  • The Intelligent Investor
  • The Richest Man in Babylon
  • Think and Trade Like a Champion
  • Value Investing and Behavioural Finance
  • Trading in the Zone
  • Learn to Earn
  • Book Summaries:
  • Rich Dad Poor Dad
  • Psychology of Money
  • The Intelligent Investor
  • The Richest Man in Babylon
  • Think and Trade Like a Champion
  • Value Investing and Behavioural Finance
  • Trading in the Zone
  • Learn to Earn
  • Tools:
  • CAGR Calculator
  • SIP Calculator
  • eLearnOptions
  • Future Value Calculator
  • Present Value Calculator
  • Atal Pension Yojana
  • Cost of Delay Calculator
  • Become a Crorepati
  • Tools:
  • CAGR Calculator
  • SIP Calculator
  • eLearnOptions
  • Future Value Calculator
  • Present Value Calculator
  • Atal Pension Yojana
  • Cost of Delay Calculator
  • Become a Crorepati

© 2025 Elearnmarkets. All Rights Reserved

  • Visit Elearnmarkets
  • Courses
  • Webinars
  • Financial Guides
  • Get Free Counselling
  • Visit Elearnmarkets
  • Courses
  • Webinars
  • Financial Guides
  • Get Free Counselling

Download Our App

No Result
View All Result
  • Article Categories
    • Basic Finance
    • Derivatives
    • Financial Planning
    • Fundamental Analysis
    • Technical Analysis
    • ETFs & Mutual Funds
    • Marketshala
    • Miscellaneous
  • Language
    • Hindi
    • Bengali
    • English
  • Courses
  • Webinars
  • Stories
Get Free Course

© 2024 Elearnmarkets All Rights Reserved

A Handbook of Technical Analysis
To start your trading journey as a seasoned technical analyst
Download Guide For FREE
Trading Day 2025