Elearnmarkets - Financial Market Learning
  • Categories
    • Basic Finance
    • Derivatives
    • Financial Planning
    • Fundamental Analysis
    • Technical Analysis
    • Marketshala
    • Miscellaneous
  • Language
    • English
    • Hindi
    • Bengali
No Result
View All Result
  • Courses
  • Webinars
  • Learn On Elearnmarkets
Elearnmarkets - Learn Stock Market, trading, investing for Free
No Result
View All Result
Home Technical Analysis
How to apply Mental Models for Support and Resistance level ? 1

How to apply Mental Models for Support and Resistance level ?

Elearnmarkets by Elearnmarkets
November 29, 2021
in Technical Analysis, Trading Terms, Rules & Strategies
Reading Time: 5 mins read
0
1.5k
VIEWS
Share on FacebookShare on TwitterShare on WhatsApp

Support and resistance level is the two most basic and fundamental concepts for a person interested in Technical Analysis. I am sure Google will explain these concepts to you fairly well in the language of the financial markets.

However, I want to take an unprecedented approach to explain the meaning of these terms. This will probably help you retain the meaning of these concepts forever, preventing you from getting confused in the future.

Table of Contents
Munger Approach to Practical Wisdom
What is Minimum Support Price (MSP)?
How to identify Support and Resistance Level in Stocks?
Bottomline

In a famous speech in the 1990s, Munger explained his novel approach to gaining practical wisdom. 

Munger Approach to Practical Wisdom

  • Well, the first rule is that you can’t really know anything if you just remember isolated facts and try and bang ’em back. If the facts don’t hang together on a latticework of theory, you don’t have them in a usable form.
  • You’ve got to have models in your head. And you’ve got to array your experience both vicarious and direct on this latticework of models. You may have noticed students who just try to remember and pound back what is remembered. Well, they fail in school and in life.You’ve got to hang experience on a latticework of models in your head.
  • And the models have to come from multiple disciplines because all the wisdom of the world is not to be found in one little academic department. That’s why peotry professors, by and large, are so unwise in a worldly sense. They don’t have enough models in their heads. So you’ve got to have models across a fair array of disciplines.

So, yes mental models must come from multiple disciplines. We are going to apply concepts related to economics and product pricing into technical analysis of the stock markets.

What is Minimum Support Price (MSP) ?

MSP is a form of market intervention by the Government of India to ensure agricultural producers against any sharp fall in farm prices.

It guarantees them a minimum amount of revenue for their products even when the market prices fall below that level.

Join TMP Join TMP Join TMP

We can look at “Support levels” in the index in the same manner. It is that level at which prices take support and do not fall further.

Similarly, Resistance level can be compared with “Maximum Retail Price (MRP)”

MRP is a manufacturer calculated price that is the highest price that can be charged for a product sold in India. It is set in order to protect consumers from being charged exorbitantly on a product.

However, retailers can choose to sell below MRP.
Thus, “Resistance level” is that level above which prices do not rise and bounce back on reaching that level.

support and resistance level

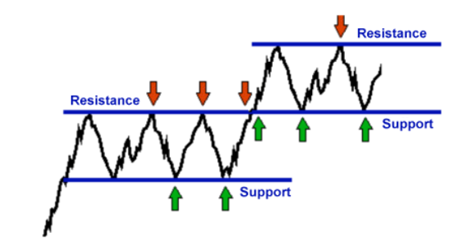
Support and resistance often act as decisive trend changers. If either level is breached, be prepared for a dynamic shift in the movement of prices.  Another thing to remember is that if support is violated, that same level will act as future resistance and vice versa.

Understand the Power of Support & Resistance for Trading and Investing in just 2 hours by Market Experts

Also, don’t forget to view support and resistance levels with volume. An increasing volume is like a validation for that support or resistance level.

How to identify Support and Resistance Level in Stocks?

The most common and useful method is to draw a line joining all the significant lows and all the significant highs of the past to find the support and resistance level respectively.

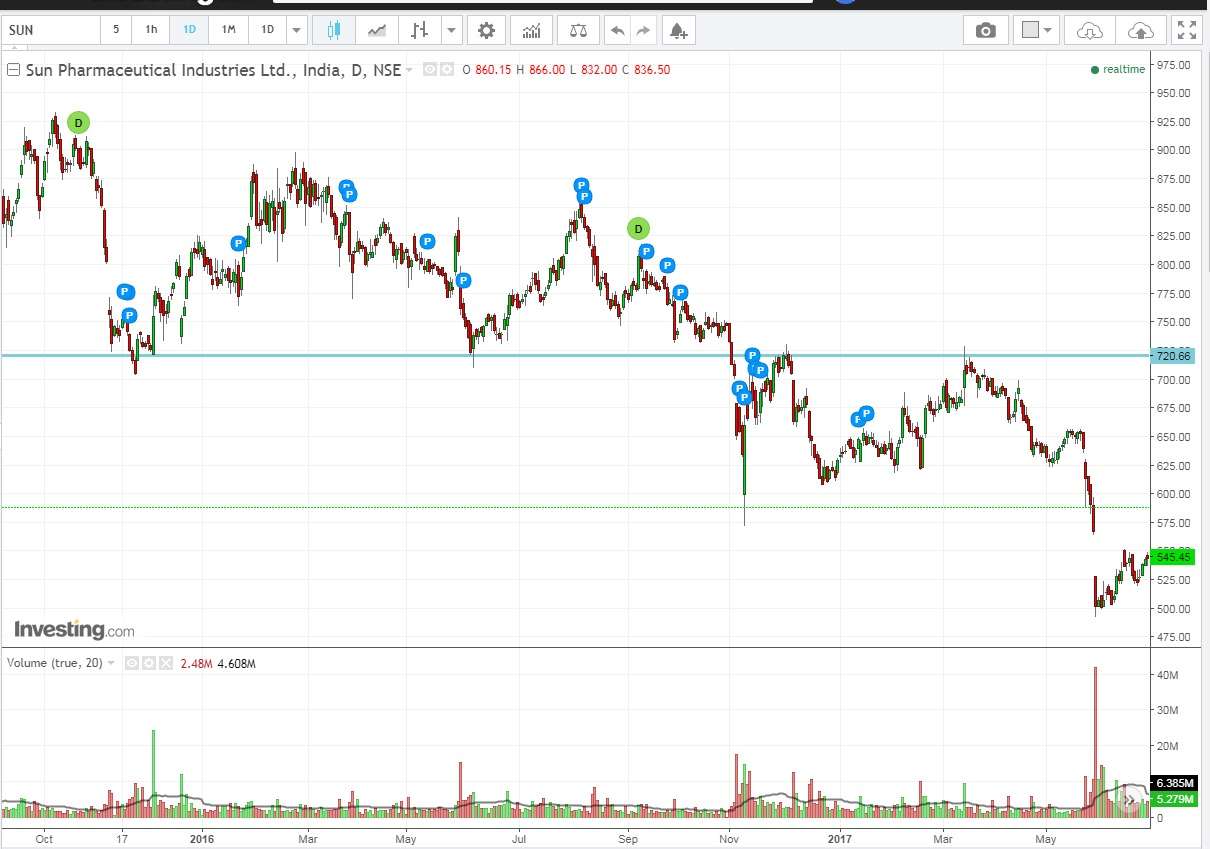
The following is a screenshot of daily chart of Sun Pharmaceuticals Industries Ltd. where the blue line serving as a support level, later transformed its identity and started behaving as a resistance level.

Also Read:  A comprehensive study on Support and Resistance

Sun Pharmaceuticals Industries

Bottomline:

The corollary to the above is that any concept can be better understood and retained if we use other already known concepts to understand the new ones.

Support and resistance levels are the basic elements that need to be applied before any other to understand the trend/movement of a particular stock.

It comes before moving averages, Bollinger bands, ADX, and all other technical indicators.

In order to get the latest updates on Financial Markets visit Stockedge

Tags: english
ShareTweetSend
Previous Post

Importance of in-depth analysis in Forex trading

Next Post

Charts of the day – 29th Jan, 2018

Elearnmarkets

Elearnmarkets

Elearnmarkets (ELM) is a complete financial market portal where the market experts have taken the onus to spread financial education. ELM constantly experiments with new education methodologies and technologies to make financial education effective, affordable and accessible to all. You can connect with us on Twitter @elearnmarkets.

Related Posts

Technical Analysis in Stock Trading 2
Technical Analysis

Technical Analysis in Stock Trading

May 31, 2023
6.2k
The Ultimate guide to Trading Divergences 3
Technical Analysis

The Ultimate guide to Trading Divergences

May 26, 2023
1k
Trading Psychology: Guide to Master Your Mind in 5 Steps 4
Technical Analysis

Trading Psychology: Guide to Master Your Mind in 5 Steps

May 24, 2023
3.1k
Trading Psychology: 7 Keys to Successful Trading 5
Technical Analysis

Trading Psychology: 7 Keys to Successful Trading

May 22, 2023
3k

Leave a Reply Cancel reply

Your email address will not be published. Required fields are marked *

Follow Us

Facebook-f Twitter Instagram Linkedin-in Youtube Telegram

Register on Elearnmarkets

Continue your financial learning by creating your own account on Elearnmarkets.com

Register Free Account

Download App

Categories

  • Basic Finance
  • Derivatives
  • Financial Planning
  • Fundamental Analysis
  • Technical Analysis
  • Marketshala
  • Miscellaneous

Popular On Elearnmarkets

  • Market Superheroes:
  • Vivek Bajaj
  • Chetan Panchamia
  • Ashish Kyal
  • Premal Parekh
  • Abhijit Paul
  • Jegan
  • Sivakumar Jayachadran
  • Vishal Malkan
  • Jyoti Budhia
  • Vivek Gadodia
  • Vishal Mehta
  • Piyush Chaudhry
  • Santosh Pasi
  • Gomathi Shankar
  • Market Superheroes:
  • Vivek Bajaj
  • Chetan Panchamia
  • Ashish Kyal
  • Premal Parekh
  • Abhijit Paul
  • Jegan
  • Sivakumar Jayachadran
  • Vishal Malkan
  • Jyoti Budhia
  • Vivek Gadodia
  • Vishal Mehta
  • Piyush Chaudhry
  • Santosh Pasi
  • Gomathi Shankar
  • Courses:​
  • Options Trading
  • Dow Theory
  • Momentum Trading
  • Stock Investing
  • Stock Market for Beginners
  • Harmonic Chart Patterns
  • Algo Trading
  • Elliot Wave Theory
  • Advanced Excel
  • Cryptocurrency
  • NSE Certification Course
  • Courses:​
  • Options Trading
  • Dow Theory
  • Momentum Trading
  • Stock Investing
  • Stock Market for Beginners
  • Harmonic Chart Patterns
  • Algo Trading
  • Elliot Wave Theory
  • Advanced Excel
  • Cryptocurrency
  • NSE Certification Course
  • Webinars:
  • Bank Nifty Scalping
  • Intraday Trading Strategies
  • Options Trading Strategies
  • Options selling
  • Price Action
  • Relative Strength
  • Tax Planning
  • Options Buying
  • Growth Stocks
  • Portfolio Management
  • Relative Strength Index
  • Risk Management
  • Renko Charts
  • Crude Oil
  • Traders Psychology
  • Moving Average
  • Multibagger Stocks
  • Free Learning Modules:
  • Intraday Trading
  • Options Scalping
  • Swing Trading
  • Financial Modelling
  • RSI Indicator
  • Bollinger Bands
  • Pricing of Futures
  • Personal Finance
  • Initial Public Offerings (IPO)
  • Value Investing
  • Technical Indicators
  • Candlesticks
  • Chart Patterns
  • Option Greeks
  • ELSS Funds
  • Banking and Insurance
  • Real Estate
  • Gold
  • Book Summaries:
  • Rich Dad Poor Dad
  • Psychology of Money
  • The Intelligent Investor
  • The Richest Man in Babylon
  • Think and Trade Like a Champion
  • Value Investing and Behavioural Finance
  • Trading in the Zone
  • Learn to Earn
  • Book Summaries:
  • Rich Dad Poor Dad
  • Psychology of Money
  • The Intelligent Investor
  • The Richest Man in Babylon
  • Think and Trade Like a Champion
  • Value Investing and Behavioural Finance
  • Trading in the Zone
  • Learn to Earn
  • Tools:
  • CAGR Calculator
  • SIP Calculator
  • eLearnOptions
  • Future Value Calculator
  • Present Value Calculator
  • Atal Pension Yojana
  • Cost of Delay Calculator
  • Become a Crorepati
  • Tools:
  • CAGR Calculator
  • SIP Calculator
  • eLearnOptions
  • Future Value Calculator
  • Present Value Calculator
  • Atal Pension Yojana
  • Cost of Delay Calculator
  • Become a Crorepati

© 2023 Elearnmarkets. All Rights Reserved

  • Visit Elearnmarkets
  • Courses
  • Webinars
  • Financial Guides
  • Get Free Counselling
  • Visit Elearnmarkets
  • Courses
  • Webinars
  • Financial Guides
  • Get Free Counselling

Get Elearnmarkets App

No Result
View All Result
  • Article Categories
    • Basic Finance
    • Derivatives
    • Financial Planning
    • Fundamental Analysis
    • Technical Analysis
    • Marketshala
    • Miscellaneous
  • Language
    • Hindi
    • Bengali
    • English
  • Courses
  • Webinars

© 2020 Elearnmarkets All Rights Reserved