Elearnmarkets - Financial Market Learning
  • Categories
    • Basic Finance
    • Derivatives
    • Financial Planning
    • Fundamental Analysis
    • Technical Analysis
    • Marketshala
    • Miscellaneous
  • Language
    • English
    • Hindi
    • Bengali
No Result
View All Result
  • Courses
  • Webinars
  • Learn On Elearnmarkets
Elearnmarkets - Learn Stock Market, trading, investing for Free
No Result
View All Result
Home Technical Analysis
Pitchfork strategy

Master Pitchfork channel to improve your trading experience

Elearnmarkets by Elearnmarkets
November 18, 2020
in Technical Analysis
Reading Time: 4 mins read
1
1.1k
VIEWS
Share on FacebookShare on TwitterShare on WhatsApp

Pitchfork developed by Alan Andrews is a trend channel tool consisting of three lines- a center median line and a pair of lines above and below the median line which basically specified the number of standard deviations away from the median.

Also Read: How to trade the Price Channel Continuation pattern

The simple logic of using pitchfork is that it creates a kind of trend channel.

As long as the price is within the band, it is there in the established trend but there is a possibility of reversal if it comes out of the Pitchfork channel.

How to draw the Pitchfork lines?

We start by drawing three points which are drawn based on reaction highs and lows.

The first point is basically the starting point of the median line which is based on two points i.e. point 1 and the midpoint between points 2 and 3.

This controls the steepness of the slope of the median line.

Join TMP Join TMP Join TMP

Pitchfork strategy

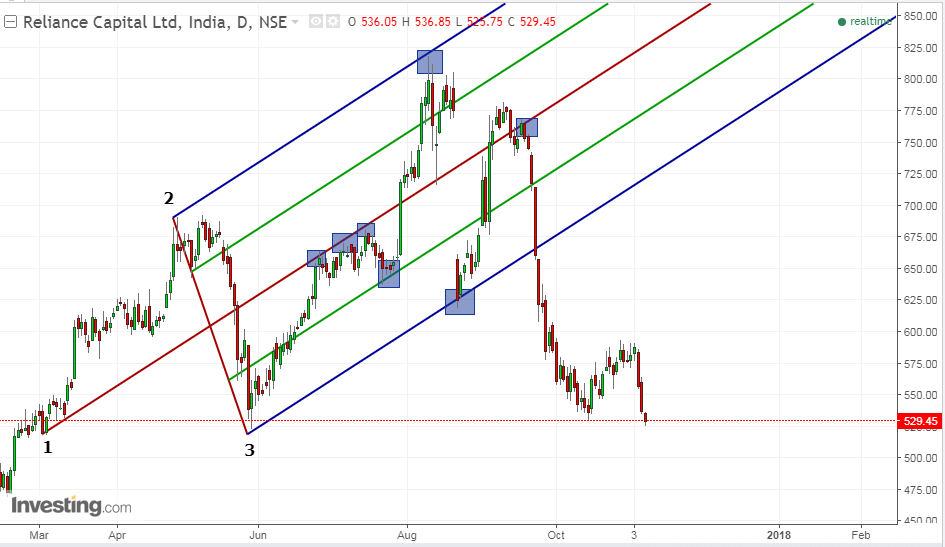
The above is a daily chart of Reliance Capital where point 1 is the starting point of the median line, followed by point 2 which is basically the reaction high and then we simply join the reaction low to complete the pitchfork pattern.

You can see in the chart that there have been so many instances when the price has respected the pitchfork lines which are highlighted using squares.

Learn Technical Analysis by joining: NSE Academy Certified Technical Analysis course on Elearnmarkets.

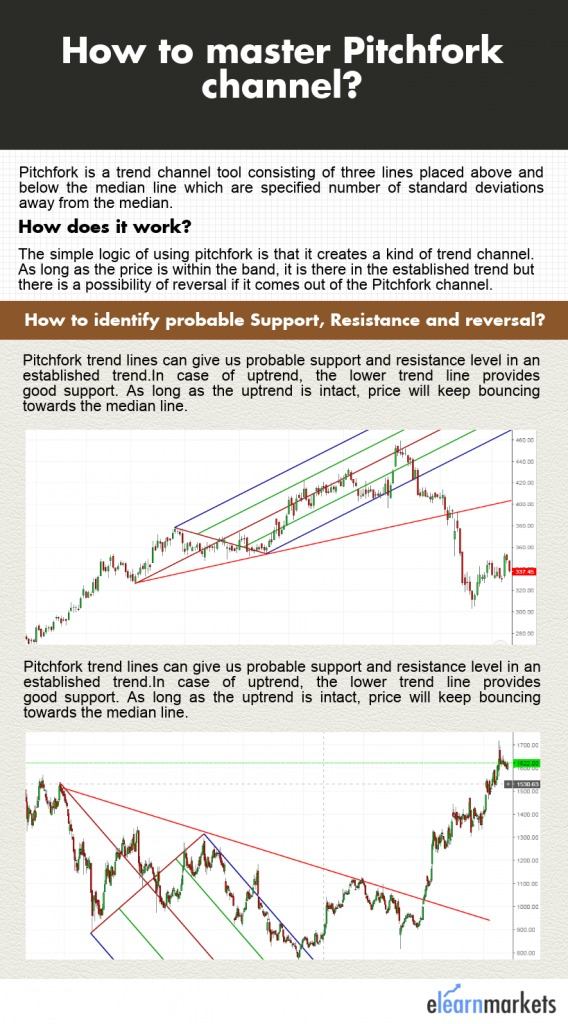
How to identify probable Support, Resistance and reversal?

Pitchfork trend lines can give us probable support and resistance level in an established trend.

Know More: A comprehensive study on Support and Resistance

In case of a downtrend, the upper trend line acts as a good support and as long as the downtrend is intact, the price will keep on going to the median line.

Failure to touch the line shows weakness and chances of upcoming reversal.

The final reversal signal comes when the trigger line is breached.

How to trade using Pitchfork

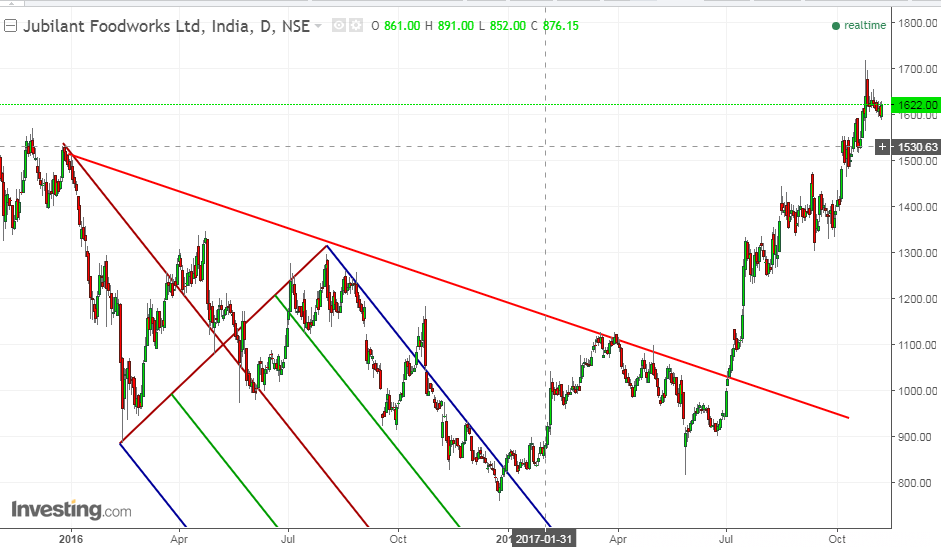
Below is the daily chart of Jubilant food work and as you can see that the stock was in a downtrend but was unable to touch the median lines suggesting weakness in trend.

Soon after coming out of the upper trend line, the stock faced some resistance at the trigger line (red line) and once it breached the trigger line, the stock rallied and gave about 60-70% return in a matter of just 3 months.

Pitchfork strategy

On the other hand, in case of a downtrend, the lower trend line provides good support.

As long as the uptrend is intact, the price will keep bouncing towards the median line.

Similarly in an uptrend, reversal signal comes when the trigger line is breached.

Read More: Triple screen trading system: the Alexander Elder way of trading

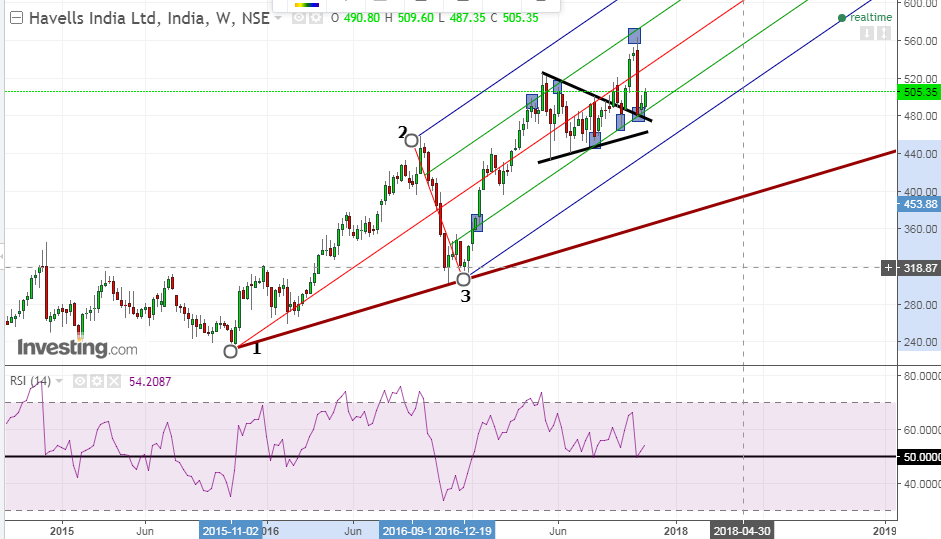
This is the weekly chart of Havells India which was in a good uptrend and it was continuously going towards the median line.

But once it breached the lower trend line, the stock saw the heavy correction.

However, the correction deepened after it went below the trigger line.

Pitchfork strategy

How to do real-time trading using Pitchfork?

Trading simply on the basis of Pitchfork is not a good idea rather you may combine your study with other indicators and price patterns to generate more confirm signals.

Let’s look at an example to understand this in more detail.

Havells pitchfork strategy weekly chart

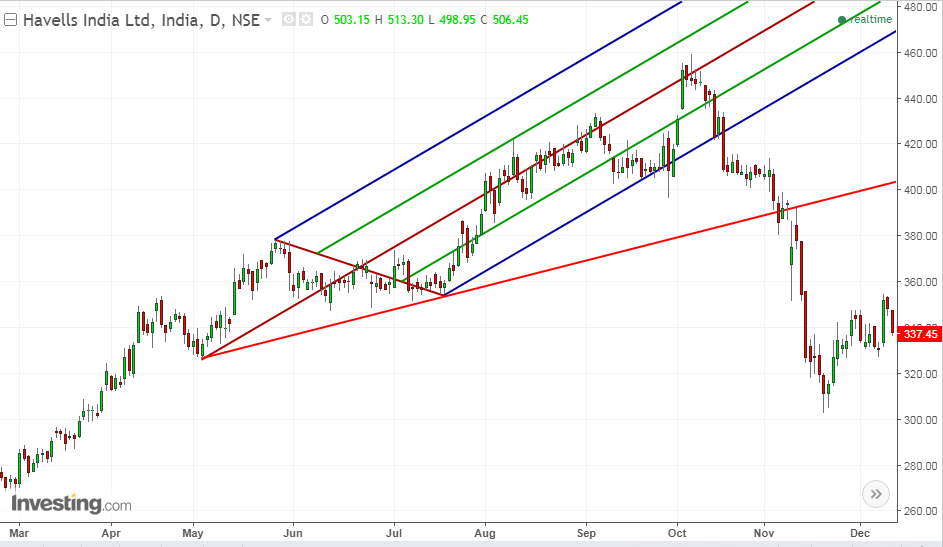
This is the daily chart of Havells India and if you can see that there was a beautiful symmetrical triangle pattern in the weekly chart and the stock made a retest after the breakout.

There was a beautiful confluence of the retest area and the Pitchfork support line.

At the same time, RSI also took support from the mid 50 line suggesting that uptrend is very much intact and the stock saw good bounce back from that area.

Bottomline

The placement of point 1 i.e. the starting point of the median line decides the slope or the steepness of the Pitchfork channel.

Even though the placement of point one is usually done at the reaction high or low but you may adjust it to display more realistic picture since there is no hard and fast rule to draw the same.

This is totally subjective in nature and depends totally upon experience once you start using it.


Tags: englishPitchfork lineresistancesupporttechnical analysistrigger line
ShareTweetSend
Previous Post

Bank Nifty likely to see a Dead Cat Bounce

Next Post

Nifty holds 10300 mark amidst strong selloff

Elearnmarkets

Elearnmarkets

Elearnmarkets (ELM) is a complete financial market portal where the market experts have taken the onus to spread financial education. ELM constantly experiments with new education methodologies and technologies to make financial education effective, affordable and accessible to all. You can connect with us on Twitter @elearnmarkets.

Related Posts

The Ultimate guide to Trading Divergences 1
Technical Analysis

The Ultimate guide to Trading Divergences

May 26, 2023
568
Trading Psychology: Guide to Master Your Mind in 5 Steps 2
Technical Analysis

Trading Psychology: Guide to Master Your Mind in 5 Steps

May 24, 2023
2.3k
Trading Psychology: 7 Keys to Successful Trading 3
Technical Analysis

Trading Psychology: 7 Keys to Successful Trading

May 22, 2023
2.5k
An Ultimate Guide to Risk Management, Stop Loss and Protecting Profits in the Stock Market 4
Technical Analysis

An Ultimate Guide to Risk Management, Stop Loss and Protecting Profits in the Stock Market

May 19, 2023
2.4k

Comments 1

  1. Ripples Advisory says:
    6 years ago

    Thanks for sharing with us.. Keep up the great work…………….

    Reply

Leave a Reply Cancel reply

Your email address will not be published. Required fields are marked *

Follow Us

Facebook-f Twitter Instagram Linkedin-in Youtube Telegram

Register on Elearnmarkets

Continue your financial learning by creating your own account on Elearnmarkets.com

Register Free Account

Download App

Categories

  • Basic Finance
  • Derivatives
  • Financial Planning
  • Fundamental Analysis
  • Technical Analysis
  • Marketshala
  • Miscellaneous

Popular On Elearnmarkets

  • Market Superheroes:
  • Vivek Bajaj
  • Chetan Panchamia
  • Ashish Kyal
  • Premal Parekh
  • Abhijit Paul
  • Jegan
  • Sivakumar Jayachadran
  • Vishal Malkan
  • Jyoti Budhia
  • Vivek Gadodia
  • Vishal Mehta
  • Piyush Chaudhry
  • Santosh Pasi
  • Gomathi Shankar
  • Market Superheroes:
  • Vivek Bajaj
  • Chetan Panchamia
  • Ashish Kyal
  • Premal Parekh
  • Abhijit Paul
  • Jegan
  • Sivakumar Jayachadran
  • Vishal Malkan
  • Jyoti Budhia
  • Vivek Gadodia
  • Vishal Mehta
  • Piyush Chaudhry
  • Santosh Pasi
  • Gomathi Shankar
  • Courses:​
  • Options Trading
  • Dow Theory
  • Momentum Trading
  • Stock Investing
  • Stock Market for Beginners
  • Harmonic Chart Patterns
  • Algo Trading
  • Elliot Wave Theory
  • Advanced Excel
  • Cryptocurrency
  • NSE Certification Course
  • Courses:​
  • Options Trading
  • Dow Theory
  • Momentum Trading
  • Stock Investing
  • Stock Market for Beginners
  • Harmonic Chart Patterns
  • Algo Trading
  • Elliot Wave Theory
  • Advanced Excel
  • Cryptocurrency
  • NSE Certification Course
  • Webinars:
  • Bank Nifty Scalping
  • Intraday Trading Strategies
  • Options Trading Strategies
  • Options selling
  • Price Action
  • Relative Strength
  • Tax Planning
  • Options Buying
  • Growth Stocks
  • Portfolio Management
  • Relative Strength Index
  • Risk Management
  • Renko Charts
  • Crude Oil
  • Traders Psychology
  • Moving Average
  • Multibagger Stocks
  • Free Learning Modules:
  • Intraday Trading
  • Options Scalping
  • Swing Trading
  • Financial Modelling
  • RSI Indicator
  • Bollinger Bands
  • Pricing of Futures
  • Personal Finance
  • Initial Public Offerings (IPO)
  • Value Investing
  • Technical Indicators
  • Candlesticks
  • Chart Patterns
  • Option Greeks
  • ELSS Funds
  • Banking and Insurance
  • Real Estate
  • Gold
  • Book Summaries:
  • Rich Dad Poor Dad
  • Psychology of Money
  • The Intelligent Investor
  • The Richest Man in Babylon
  • Think and Trade Like a Champion
  • Value Investing and Behavioural Finance
  • Trading in the Zone
  • Learn to Earn
  • Book Summaries:
  • Rich Dad Poor Dad
  • Psychology of Money
  • The Intelligent Investor
  • The Richest Man in Babylon
  • Think and Trade Like a Champion
  • Value Investing and Behavioural Finance
  • Trading in the Zone
  • Learn to Earn
  • Tools:
  • CAGR Calculator
  • SIP Calculator
  • eLearnOptions
  • Future Value Calculator
  • Present Value Calculator
  • Atal Pension Yojana
  • Cost of Delay Calculator
  • Become a Crorepati
  • Tools:
  • CAGR Calculator
  • SIP Calculator
  • eLearnOptions
  • Future Value Calculator
  • Present Value Calculator
  • Atal Pension Yojana
  • Cost of Delay Calculator
  • Become a Crorepati

© 2023 Elearnmarkets. All Rights Reserved

  • Visit Elearnmarkets
  • Courses
  • Webinars
  • Financial Guides
  • Get Free Counselling
  • Visit Elearnmarkets
  • Courses
  • Webinars
  • Financial Guides
  • Get Free Counselling

Get Elearnmarkets App

No Result
View All Result
  • Article Categories
    • Basic Finance
    • Derivatives
    • Financial Planning
    • Fundamental Analysis
    • Technical Analysis
    • Marketshala
    • Miscellaneous
  • Language
    • Hindi
    • Bengali
    • English
  • Courses
  • Webinars

© 2020 Elearnmarkets All Rights Reserved