English: Click here to read this article in English.
टेक्निकल इंडिकेटर उन लोगों के लिए ट्रेडिंग का दिल है जिनके ट्रेडिंग का तरीका टेक्निकल एनालिसिस है।
ये इंडीकेटर्स महत्वपूर्ण हैं चाहे आप डे ट्रेड करें या स्विंग ट्रेड। टेक्निकल एनालिसिस का मुख्य लक्ष्य भविष्य के मूल्य गतिविधि की भविष्यवाणी करना है। ट्रेडिंग पैटर्न और इंडीकेटर्स की कला को समझना इस इंडिकेटर के बारे में समझने में आपकी मदद करेगा।
एक और कदम आगे बढ़ाते हुए क्निकल इंडिकेटर को आगे विभाजित किया जाता है: लीडिंग और लैगिंग इंडिकेटर में।
इस लेख में, हम दोनों प्रकार के इंडीकेटर्स के बारे में चर्चा करते हैं और पहचानते हैं कि कौन सा आपकी ट्रेडिंग शैली के अनुकूल है:
एक Leading Technical Indicator क्या है?
Leading technical indicator आगे मूल्य गतिविधि का अनुमान लगाने के लिए डिज़ाइन किए गए हैं, जो ट्रेडर को ट्रेड में बढ़त देने में मदद करता है।
एक लीडिंग टेक्निकल इंडिकेटरडिंग इंडिकेटर प्रवेश या निकास के शुरुआती संकेत प्रदान करते हैं और ट्रेड के अधिक अवसर प्रदान करते हैं। वे इंडिकेटर की गणना करने के लिए उपयोग की जाने वाली कई अवधियों में मूल्य गति का संकेत देते हैं।
कुछ प्रसिद्ध प्रमुख इंडीकेटर्स हैं:
कीमतों में बदलाव होने से पहले वॉल्यूम में बदलाव दिखते हैं क्योंकि यह बाजार में खरीदारी और बिक्री के दबाव का सही मायने में प्रतिनिधित्व करता है।
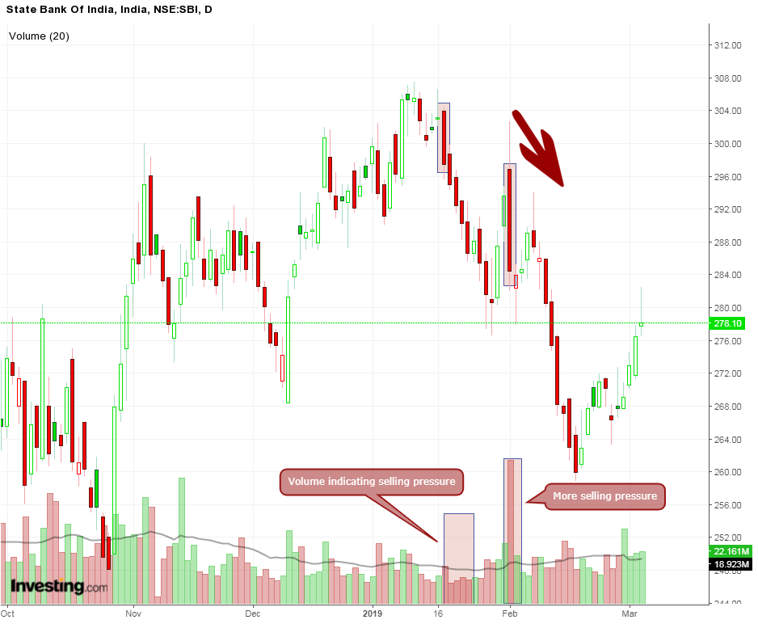
यदि आप पहले चिन्हित मूल्य और वॉल्यूम का बारीकी से विश्लेषण करते हैं तो यह है कि वॉल्यूम गिरने लगता है। दूसरे वॉल्यूम के गिरावट में, बिना वॉल्यूम के चार्ट को देखने वाले किसी व्यक्ति के लिए यह जानना आसान हो जाएगा कि ट्रेंड रिवर्स हो गई है, लेकिन स्टॉक में बिकवाली का दबाव जारी है।
Lagging Technical Indicator क्या है?
लैगिंग इंडीकेटर्स वो इंडीकेटर्स हैं जो एक ट्रेंड का पालन करते हैं फिर मूल्य रिवर्सल की भविष्यवाणी करते हैं। यह एक इवेंट को फॉलो करता है।
जब कीमतें लंबे ट्रेंड्स में चलती हैं तो ये इंडीकेटर्स अच्छा काम करते हैं।
वे कीमतों में आने वाले बदलावों के बारे में संकेत नहीं देते हैं, बस यह बताते हैं कि क्या कीमतें बढ़ रही हैं या घट रही हैं ताकि हम तदनुसार निवेश कर सकें।
विलंबित प्रतिक्रिया के बाद भी, कई लोग लैगिंग इंडिकेटर चुनना पसंद करते हैं जो उन्हें अपने परिणामों को मान्य करके अधिक आत्मविश्वास के साथ व्यापार करने में मदद करते हैं।
आमतौर पर ट्रेडर्स स्टॉक में प्रवेश करने से पहले मूल्य ट्रेंड्स की पुष्टि करने के लिए दो या दो से अधिक लैगिंग इंडीकेटर्स का उपयोग करते हैं।
मूविंग एवरेज और मूविंग एवरेज कन्वर्जेन्स एंड डाइवर्जेंस, ट्रेंड फॉलोइंग या लैगिंग इंडिकेटर्स के उदाहरण हैं।
मार्केट एक्सपर्ट्स द्वारा टेक्निकल एनालिसिस अब हुआ आसान कोर्स से टेक्निकल एनालिसिस की मूल बातें जाने
एक उदाहरण लेते हैं:
लैगिंग इंडिकेटर की स्थापना का एक क्लासिक उदाहरण 50 पीरियड 200 पीरियड मूविंग एवरेज है।
आमतौर पर एक सिक्योरिटी को तब बेयरिश कहा जाता है जब 50 एमए 200 एसएमए से नीचे हो जाता है। इसी तरह एक सिक्योरिटी को बुलिश तब कहा जाता है जब 50 एमए 200 एसएमए से ऊपर हो जाता है।
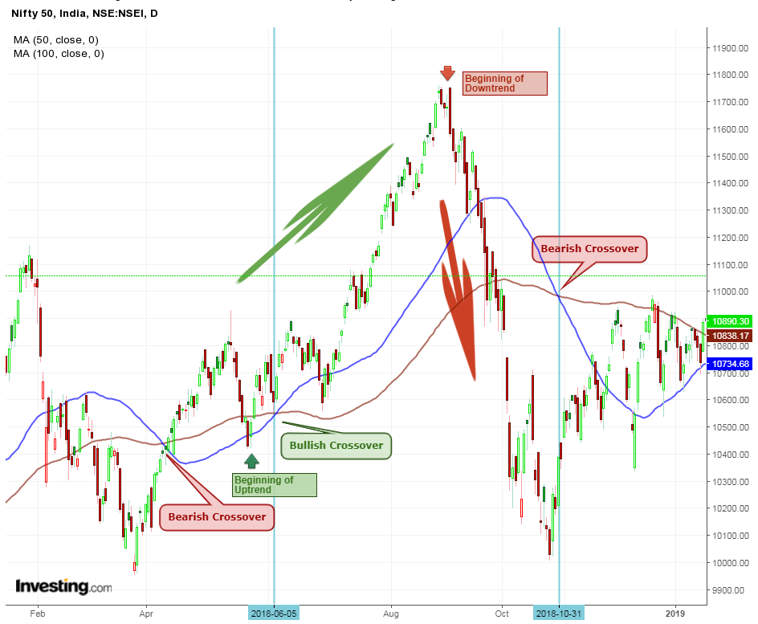
उपरोक्त चार्ट में, 200 और 50 पीरियड के मूविंग एवरेज के बुलिश और बेयरिश क्रोस ओवर्स द्वारा उत्पन्न इंडीकेटर्स पर ध्यान दें। पहले इंडीकेटर्स में अगर हम बेयरिश के संकेत के बाद शार्ट करते हैं तो यह एक खोने वाला व्यापार होता है।
इसके पीछे मुख्य कारण यह है कि जिस समय कीमत कम हुई और एसएमए की प्रतिक्रिया हुई, कीमत पहले ही काफी गिर गई और रिवर्स हो गई थी।
और पढ़ें – टेक्निकल इंडिकेटर जो बाजार में अस्थिरता(वोलैटिलिटी) को दर्शाते हैं
तब हमें बुलिश क्रॉसओवर का संकेत मिलता है। लेकिन जब तक यह संकेत करता है, तब तक अपट्रेंड शुरू हो चुका होता है। इस संकेत ने हालांकि हमारे पक्ष में काम किया।
यदि किसी ट्रेडर ने तीसरे बेयरिश के संकेत का पालन किया था और शार्ट हुआ था तो यह एक बार फिर नुकसान का कारण बनेगा।
उपरोक्त उदाहरण से पता चलता है कि लैगिंग के बावजूद, कोई इस इंडिकेटर द्वारा दिए गए संकेतों पर भरोसा नहीं कर सकता है।
Lagging और Leading Technical Indicator के बीच अंतर?
- सिग्नल उत्पन्न करना
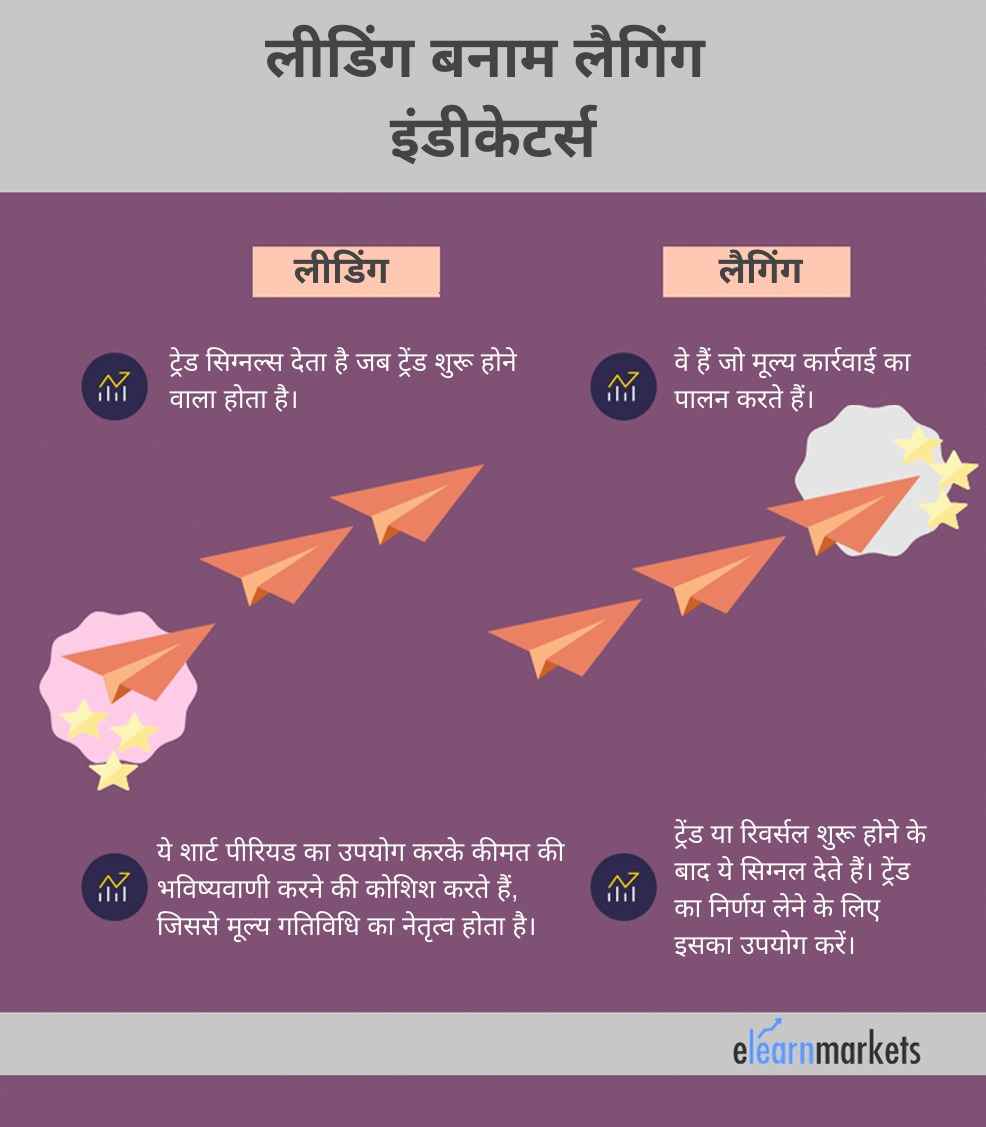
Leading technical indicator ट्रेड सिग्नल देते हैं जब ट्रेड शुरू होने वाली होती है जबकि लैगिंग इंडिकेटर वे होते हैं जो मूल्य क्रियाओं का पालन करते हैं।
- बेस्ट टाइम पीरियड्स
लीडिंग इंडिकेटर छोटी अवधि की समयावधि का उपयोग करके कीमत का अनुमान लगाने की कोशिश करते हैं और इसलिए मूल्य गतिविधि का नेतृत्व करते हैं।
लैगिंग इंडिकेटर ट्रेंड या रिवर्सल के बाद संकेत देते हैं। ट्रेंड का निर्धारण करने के लिए कोई भी उनका उपयोग कर सकता है।
Lagging & Leading Technical Indicators की कमियां
दोनों लीडिंग और लैगिंग इंडीकेटर्स की अपनी कमियां हैं।
लीडिंग इंडिकेटर कीमतों पर तुरंत प्रतिक्रिया करते हैं, जिसका अर्थ है कि वे गलत संकेतों से ग्रस्त हो सकते हैं।
लैगिंग इंडिकेटर प्रतिक्रिया के लिए धीमा हैं और वे भी गलत संकेत दे सकते हैं।
लीडिंग और लैगिंग टेक्निकल इंडीकेटर्स का संयोजन
आइए देखें कि एक ट्रेडर बाजार के बेहतर दृष्टिकोण को प्राप्त करने के लिए लीडिंग और लैगिंग दोनों इंडीकेटर्स का उपयोग कैसे कर सकता है।
निम्नलिखित चार्ट, रिलेटिव स्ट्रेंथ इंडेक्स (लीडिंग) और दो मूविंग एवरेज (लैगिंग) इंडीकेटर्स दिखाता है:
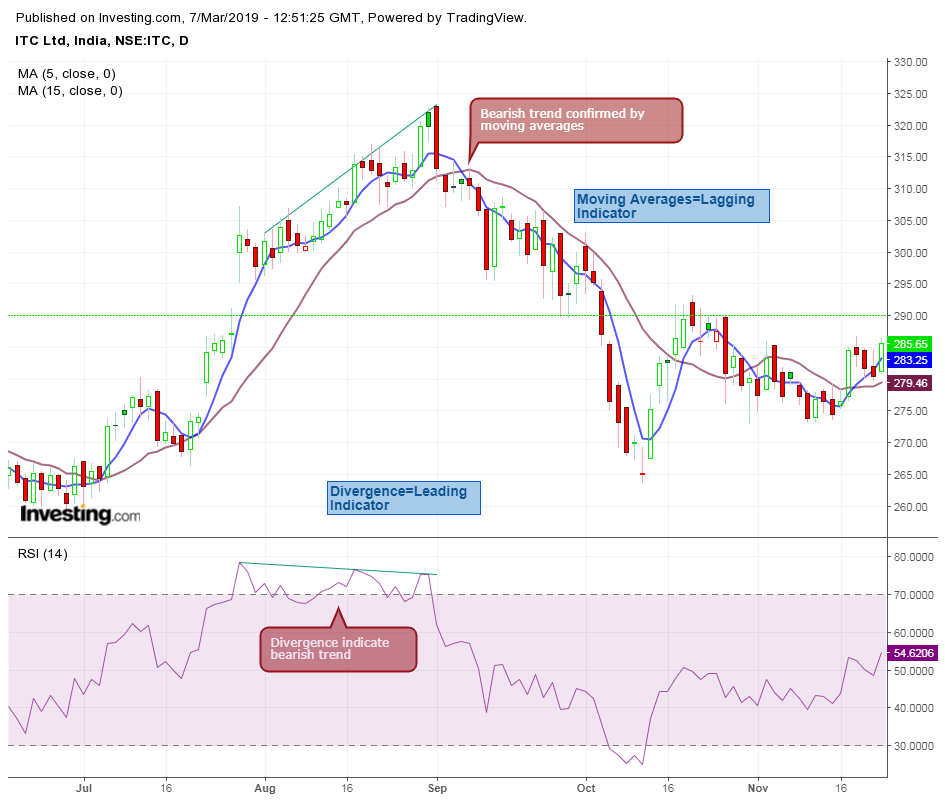
यहां चार्ट पर, हम पहले बेयरिश डाइवर्जन्स की पहचान करते हैं, जिसकी कीमत उच्चतर उच्च बनी हुई है, जबकि 14 पीरियड आरएसआई कमतर कम है। यह बेयरिश इंडिकेटर एक प्रमुख इंडिकेटर है जो एक संभावित बेयरिश ट्रेंड के बारे में व्यापारी को सूचित करता है। आप यह भी देख सकते हैं कि लीजिंग इंडिकेटर एक बेयरिश ट्रेंड का संकेत देने के बाद, इसकी पुष्टि मूविंग एवरेज बेयरिश क्रोसोवर्स द्वारा होती है।
आप देख सकते हैं कि लीडिंग और लैगिंग दोनों इंडीकेटर्स को संयोजित करना कितना सरल मगर शक्तिशाली है।
लीडिंग बनाम लैगिंग संकेतक – कौन सा बेहतर है?
ट्रेडर्स के लिए अक्सर लीडिंग और लैगिंग इंडीकेटर्स का उपयोग करने के बीच संतुलन बनाना मुश्किल होता है।
यदि आप केवल लीडिंग इंडीकेटर्स पर भरोसा करते हैं, तो संभावना बहुत सारे गलत संकेतों को देखने की है।
इसे भी पढ़ें: स्टॉक ट्रेडर्स के लिए टेक्निकल इंडीकेटर्स के लिए व्यापक गाइड
यदि आप पूरी तरह से लैगिंग संकेतकों पर भरोसा करते हैं, तो संभावना बहुत सारे गलत संकेतों को देखने की है।
उपरोक्त कमियों के साथ, इन दोनों लीडिंग और लैगिंग इंडीकेटर्स का उपयोग करके एक ट्रेडिंग रणनीति विकसित करना सबसे अच्छा है।
अंत में यह ट्रेडर पर होता है कि वह कैसे ट्रेड करना चाहता है!
मूल बातें
- लीडिंग इंडिकेटर को डिज़ाइन किया जाता है ताकि ट्रेडर ट्रेड में बढ़त पाने के लिए आगे की कीमतों की गतिविधियों का अनुमान लगा सके।
- लैगिंग इंडिकेटर वो इंडिकेटर हैं जो एक ट्रेंड का पालन करते हैं न कि मूल्य रिवर्सल की भविष्यवाणी करते हैं। यह एक इवेंट को फॉलो करते है।
- किसी को इन दोनों इंडीकेटर्स पर पूरी तरह से निर्भर नहीं होना चाहिए
- किसी को इन दोनों इंडीकेटर्स का उपयोग करके एक ट्रेडिंग रणनीति स्थापित करनी चाहिए।
