Elearnmarkets - Financial Market Learning
  • Courses
  • Webinars
  • Stories
  • Language
    • English
    • Hindi
    • Bengali
No Result
View All Result
Get Free Course
  • Basic Finance
  • Derivatives
    • Futures
    • Options
  • Financial Planning
  • Fundamental Analysis
  • Technical Analysis
  • Mutual Funds
  • Marketshala
  • Miscellaneous
Elearnmarkets - Learn Stock Market, trading, investing for Free
  • Courses
  • Webinars
  • Stories
  • Language
    • English
    • Hindi
    • Bengali
No Result
View All Result
Get Free Course
Elearnmarkets - Learn Stock Market, trading, investing for Free
No Result
View All Result
Home Technical Analysis
Piercing Pattern - How to trade with Piercing Candlestick? 1

Piercing Pattern – How to trade with Piercing Candlestick?

Vivek Bajaj by Vivek Bajaj
April 10, 2024
in Technical Analysis, Charts, Patterns & Indicators
Reading Time: 6 mins read
2
27.9k
VIEWS
Share on FacebookShare on XShare on WhatsApp

Hindi: आप इस लेख को हिंदी में भी पढ़ सकते है|

A piercing pattern is a candlestick pattern formed near the support levels, and it gives us potential bullish reversal signs. It is found towards the end of a downtrend and is quite similar to the dark cloud cover.

The only difference is that dark cloud cover signals a bearish reversal, whereas a piercing pattern signals a bullish reversal. This kind of pattern is made of two candlesticks, the first one is bearish, and the second one is the bullish candlestick.

But is this candlestick that easy to use when you use technical analysis to trade in the stock market?

Let us find out below:

Table Of Contents
  1. What is a Piercing Pattern?
  2. Formation of Piercing Candlestick Pattern
  3. How to use Piercing Patterns?
  4. Ideal Trading setup for Piercing Pattern
  5. Bottomline
  6. Frequently Asked Questions (FAQs)
    • What is a piercing candlestick pattern?
    • Is piercing pattern bullish or bearish?
    • What is the psychology behind the piercing candlestick pattern?

What is a Piercing Pattern?

It is a bullish reversal pattern that can be found at the end of a downtrend. This candlestick pattern is used as an indicator to enter a long position or exit the sell position.

This kind of pattern is formed when the bulls and bears, both are fighting to gain control over the prices. The piercing pattern is made up of two candlesticks.

The first candlestick should be red candlestick having a large real body and the second candlestick should be green in colour and also should below the low of the previous candlestick.

 The second candlestick must close above the middle of the real body of the first candlestick. Both the candlesticks should be Marubozu with no upper or lower shadows.

Formation of Piercing Candlestick Pattern

Here is the formation of the Piercing Pattern:

piercing pattern formation

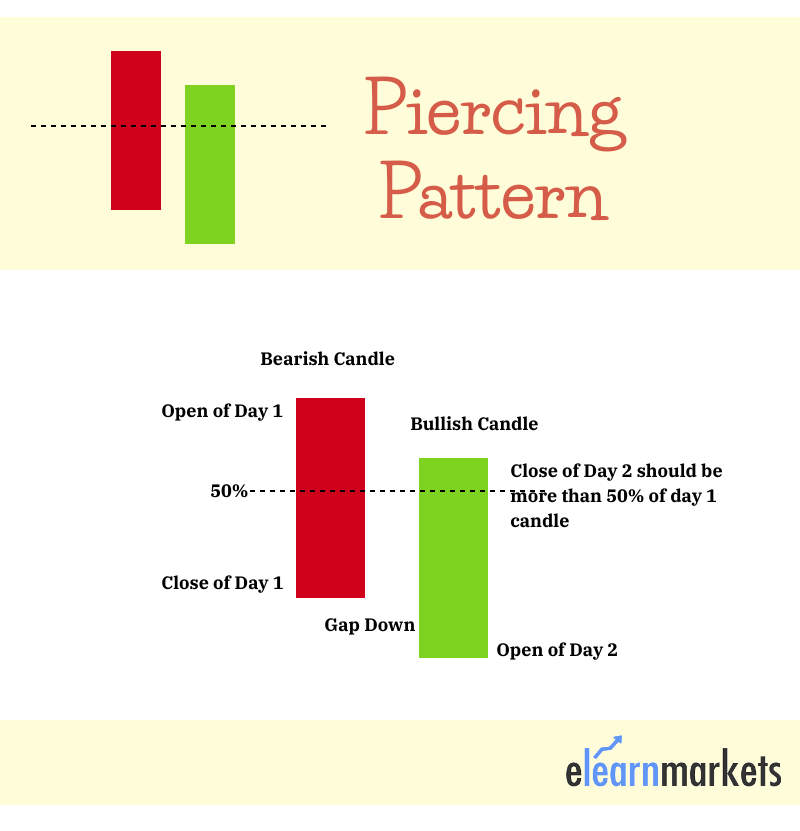
As the market is already in a downtrend, the opening price is high and the selling activity continues.

At the end of the trading session, the closing price reaches the bottom and thus a bearish candle is formed.

This bearish candlestick is usually a Marubozu having no upper or lower shadows. The opening of the next candlestick is below the closing point of the previous bearish candlestick.

There is an increase in the demand by the bulls and the price starts rising. At the end of the day, the bulls are successful in making the price rise, and the closing price is more than the middle of the previous bearish candlestick.

How to use Piercing Patterns?

Investors must look at a few characteristics when they trade with the piercing pattern:

  • Firstly, the trend should be a downtrend, as the pattern is a bullish reversal pattern.
  • Secondly, the length of the candlestick plays an important role in determining the force with which the reversal will take place.
  • The gap down between the bearish and bullish candlesticks indicates how powerful the trend reversal will be.
  • Fourthly, the bullish candlestick should close more than the midpoint of the previous bearish candlestick.
  • Lastly, the bearish, as well as the bullish candlestick, should have larger bodies.

Below is an example of the piercing pattern in the daily chart of Sun Pharmaceutical Industries Ltd.

sun pharmaceutical chart

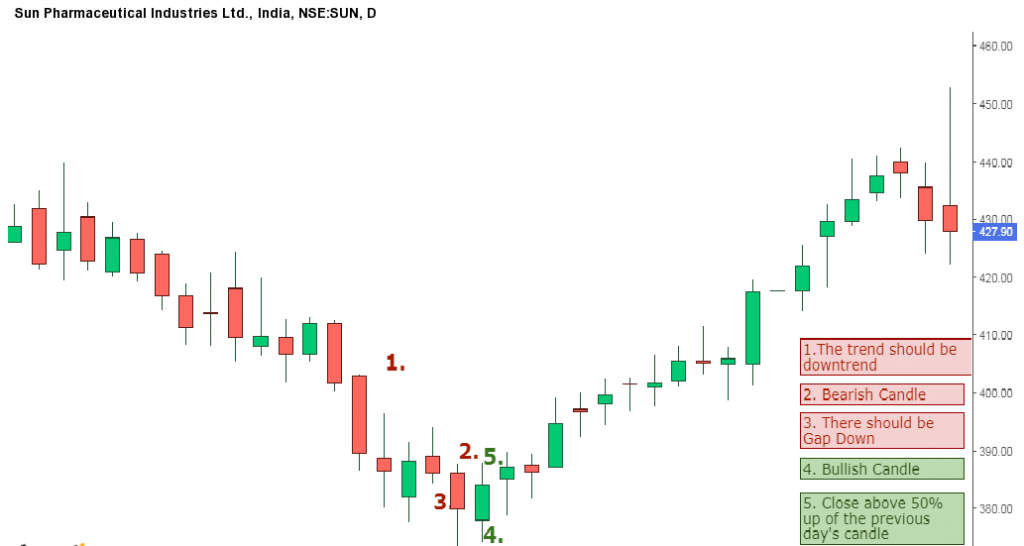
Here we can see that all of the characteristics mentioned above for trend reversal signaled by the piercing pattern are fulfilled so one can enter a long position.

Ideal Trading setup for Piercing Pattern

When a trader sees a piercing candlestick chart pattern on a particular stock chart, he should wait until the high of the first candlestick is succeed by the previous bearish candle.

 This is an ideal trade setup when trading with the piercing candlestick pattern. The stop loss should low of the previous bearish candle.

This pattern is more suitable for day and swing traders as the rate of success are quite high in longer time-frames. Also, don’t forget to confirm the signals given by this pattern with other technical indicators.

Read More- All 35 Candlestick Chart Patterns in the Stock Market

Bottomline

The piercing pattern is made of two candlesticks, the first one is bearish and the second one is a bullish candlestick. Piercing Candlestick Pattern is a bullish reversal pattern that can be found at the end of a downtrend. It is found towards the end of a downtrend and is quite similar to the dark cloud cover. Investors must look at a few characteristics when they trade with this pattern. Also, don’t forget to confirm the signals given by this pattern with other technical indicators.

Frequently Asked Questions (FAQs)

What is a piercing candlestick pattern?

A possible turnaround from a downward trend to an upward trend is signaled by the two-day candle pattern known as the piercing pattern. Usually, this candle pattern only makes predictions for the next five days.

Is piercing pattern bullish or bearish?

An indication of a bullish reversal pattern at the end of a downward trend is the Piercing Pattern. The entry into a long position or the exit from a sell position are indicated by this candlestick pattern. When bulls and bears compete to influence the pricing, patterns like this one are created.

What is the psychology behind the piercing candlestick pattern?

A two-candlestick pattern known as the Piercing Line Pattern usually indicates a possible bullish reversal in the direction of the existing downturn.

You can also use technical scans to filter out stocks for trading the next day by using StockEdge App

Tags: candlestick chartscandlestick patternenglishpiercing patterntechnical analysistechnical basics
ShareTweetSend
Get Kotak Offer Get Kotak Offer Get Kotak Offer
Previous Post

Hammer Candlestick Pattern – Formation, Example and Limitations

Next Post

How to Trade with Bullish Engulfing and Bearish Engulfing Patterns

Vivek Bajaj

Vivek Bajaj

Mr. Vivek Bajaj has over 18 years of trading experience in equities, options, currencies, and commodity markets. He is the co-founder of Stockedge and Elearnmarkets and is passionate about data, analytics, and technology. He serves on various exchange committees and has played a significant role in the evolution of India's derivative market. He has been a speaker at various colleges and higher institutions, including IIT and IIMs.

Related Posts

Understand Slippage in Trading
Technical Analysis

What is Slippage in Trading? Meaning & Examples

March 28, 2025
284
Breakout trading strategies
Technical Analysis

Top 5 Breakout Trading Strategies

March 12, 2025
1k
5 stocks for today
Technical Analysis

5 Stocks to Buy Today That Could Beat the NIFTY in 2025!

May 5, 2025
389
Image describing What is marginal trading facility
Technical Analysis

 What is a Margin Trading Facility? Advantages & Risks

April 4, 2025
657

Comments 2

  1. Rajesh Kumar Thakur says:
    4 years ago

    Simple and very focussed .

    Reply
    • Sakshi Agarwal says:
      4 years ago

      Hi,

      Thank you for reading our blog!!

      Keep Reading!

      Reply

Leave a Reply Cancel reply

Your email address will not be published. Required fields are marked *

Disclaimer

Elearnmarkets (Kredent InfoEdge Pvt. Ltd.) is a SEBI-registered Research Analyst (RA) entity (SEBI Registration No.: INH300007493). The information provided in this article is for educational and informational purposes only and should not be considered as an offer to buy or sell any securities or investment products.

The stocks, securities, and investment instruments mentioned herein are not recommendations under SEBI (Research Analysts) Regulations, 2014. Readers are advised to conduct their own due diligence and seek independent financial advice before making any investment decisions.

Investments in securities markets are subject to market risks. Please read all related documents carefully before investing. Investing in Equity Shares,
Derivatives, Mutual Funds, or other instruments carry inherent risks, including potential loss of capital. Elearnmarkets (Kredent InfoEdge Pvt. Ltd.) does not provide any guarantee or assurance of returns on any investments. Past performance is not indicative of future performance.

Elearnmarkets Logo

Follow Us

Facebook-f X-twitter Instagram Linkedin-in Youtube Telegram

Register on Elearnmarkets

Continue your financial learning by creating your own account on Elearnmarkets.com

Register Free Account

Download App

Playstore logo
Download on app store

Categories

  • Basic Finance
  • Derivatives
  • Financial Planning
  • Fundamental Analysis
  • Technical Analysis
  • Mutual Funds
  • Miscellaneous

Popular On Elearnmarkets

  • Market Superheroes:
  • Vivek Bajaj
  • Chetan Panchamia
  • Ashish Kyal
  • Premal Parekh
  • Abhijit Paul
  • Jegan
  • Sivakumar Jayachadran
  • Jyoti Budhia
  • Vivek Gadodia
  • Vishal Mehta
  • Piyush Chaudhry
  • Santosh Pasi
  • Gomathi Shankar
  • Market Superheroes:
  • Vivek Bajaj
  • Chetan Panchamia
  • Ashish Kyal
  • Premal Parekh
  • Abhijit Paul
  • Jegan
  • Sivakumar Jayachadran
  • Jyoti Budhia
  • Vivek Gadodia
  • Vishal Mehta
  • Piyush Chaudhry
  • Santosh Pasi
  • Gomathi Shankar
  • Courses:​
  • Options Trading
  • Dow Theory
  • Momentum Trading
  • Stock Investing
  • Harmonic Chart Patterns
  • Algo Trading
  • Elliot Wave Theory
  • Advanced Excel
  • Cryptocurrency
  • NSE Certification Course
  • Courses:​
  • Options Trading
  • Dow Theory
  • Momentum Trading
  • Stock Investing
  • Harmonic Chart Patterns
  • Algo Trading
  • Elliot Wave Theory
  • Advanced Excel
  • Cryptocurrency
  • NSE Certification Course
  • Webinars:
  • Bank Nifty Scalping
  • Intraday Trading Strategies
  • Options Trading Strategies
  • Options selling
  • Price Action
  • Relative Strength
  • Tax Planning
  • Options Buying
  • Growth Stocks
  • Portfolio Management
  • Risk Management
  • Renko Charts
  • Crude Oil
  • Traders Psychology
  • Moving Average
  • Multibagger Stocks
  • Free Learning Modules:
  • Intraday Trading
  • Options Scalping
  • Swing Trading
  • Financial Modelling
  • RSI Indicator
  • Bollinger Bands
  • Pricing of Futures
  • Personal Finance
  • Initial Public Offerings (IPO)
  • Value Investing
  • Technical Indicators
  • Candlesticks
  • Chart Patterns
  • Option Greeks
  • ELSS Funds
  • Banking and Insurance
  • Real Estate
  • Gold
  • Book Summaries:
  • Rich Dad Poor Dad
  • Psychology of Money
  • The Intelligent Investor
  • The Richest Man in Babylon
  • Think and Trade Like a Champion
  • Value Investing and Behavioural Finance
  • Trading in the Zone
  • Learn to Earn
  • Book Summaries:
  • Rich Dad Poor Dad
  • Psychology of Money
  • The Intelligent Investor
  • The Richest Man in Babylon
  • Think and Trade Like a Champion
  • Value Investing and Behavioural Finance
  • Trading in the Zone
  • Learn to Earn
  • Tools:
  • CAGR Calculator
  • SIP Calculator
  • eLearnOptions
  • Future Value Calculator
  • Present Value Calculator
  • Atal Pension Yojana
  • Cost of Delay Calculator
  • Become a Crorepati
  • Tools:
  • CAGR Calculator
  • SIP Calculator
  • eLearnOptions
  • Future Value Calculator
  • Present Value Calculator
  • Atal Pension Yojana
  • Cost of Delay Calculator
  • Become a Crorepati

© 2025 Elearnmarkets. All Rights Reserved

  • Visit Elearnmarkets
  • Courses
  • Webinars
  • Financial Guides
  • Get Free Counselling
  • Visit Elearnmarkets
  • Courses
  • Webinars
  • Financial Guides
  • Get Free Counselling

Download Our App

No Result
View All Result
  • Article Categories
    • Basic Finance
    • Derivatives
    • Financial Planning
    • Fundamental Analysis
    • Technical Analysis
    • ETFs & Mutual Funds
    • Marketshala
    • Miscellaneous
  • Language
    • Hindi
    • Bengali
    • English
  • Courses
  • Webinars
  • Stories
Get Free Course

© 2024 Elearnmarkets All Rights Reserved

A Handbook of Technical Analysis
To start your trading journey as a seasoned technical analyst
Download Guide For FREE
Guidebook On Chart Patterns
Take Your Trading To The Next Level With Strategies Shared In This Ebook
Download Guide For FREE
Trading Day 2025