There’s a common complaint from traders that they often exit from profitable trades too early. The noise in the market often misleads you and results in exiting your positions quickly.
The entire problem would have been solved if there would be a charting technique that could filter out market noise and you would have enjoyed the entire trend rather than exiting on minor corrections.
Well, there’s a tool named Renko charts which will solve your problem and today we’ll study what it is and how it works.
Table of Contents
What is Renko Chart?
Renko is derived from the Japanese word “Renga” or brick which ignores time and the movement is based solely on price. Renko charts filter out minor price movements, making them a preferred choice amongst many traders.
Because some minor price fluctuations are filtered out, trends in price may be easier to spot, and the chart appearance is more uniform compared to candlestick charts.
Though time is not a factor for Renko charts, it may be a technique that should be used for swing or position traders rather than for intraday traders. The only parameter which must be determined here is the size of the brick itself.
The bigger the size, the less movement a chart will show but there will be larger stops on the positions. On the other hand, if you take a smaller brick size, the sensitivity to price movement will be too high and the reason for using the Renko chart will be lost.
While there is no perfect setting, traders will often use 1% of the price of the stock as the setting on daily Renko charts. However, you need to experiment yourself and see which number suits you the best.
After understanding the basics of Renko charts, the first thing is to understand how to do brick calculations:
How to do Brick Calculation?
There are two methods for the calculation of bricks-
1. Average True Range (ATR)
You may simply use the values generated by the Average True Range (ATR) indicator. The ATR is used to filter out the normal noise or volatility of a financial instrument.
The ATR method “automatically” determines a good brick size which calculates what the ATR value would be in a regular candlestick chart and then makes this value the brick size.
2. Traditional method
You may also have your pre-defined absolute value for the brick size. New bricks are only created when price movement is at least as large as the pre-determined brick size.
The upside to this method is that it is very straightforward and it is easy to anticipate when and where new bricks will form. The downside is that selecting the correct brick size for a specific instrument will take some experimentation.
Let us now discuss Renko Chart Patterns that are commonly used when we trade with Renko Charts:
What are Renko Chart Patterns?
It’s simple to trade chart patterns. Due to the apparent way that Renko charts are constructed, it is much simpler to trade the chart patterns when using Renko charts.
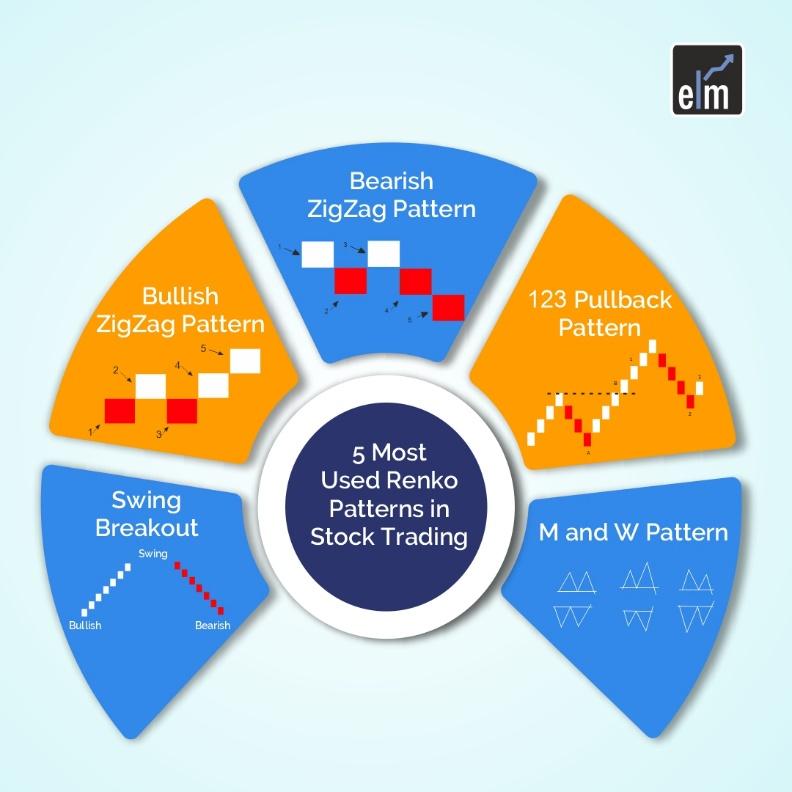
1. Swing Breakout Patterns
Swing charts are Renko charts. A series of bullish or bearish bricks represent a swing move without the extra noise.
The price has moved in a certain direction without a correction that is twice the size of a brick when we see a series of bricks on a Renko chart.
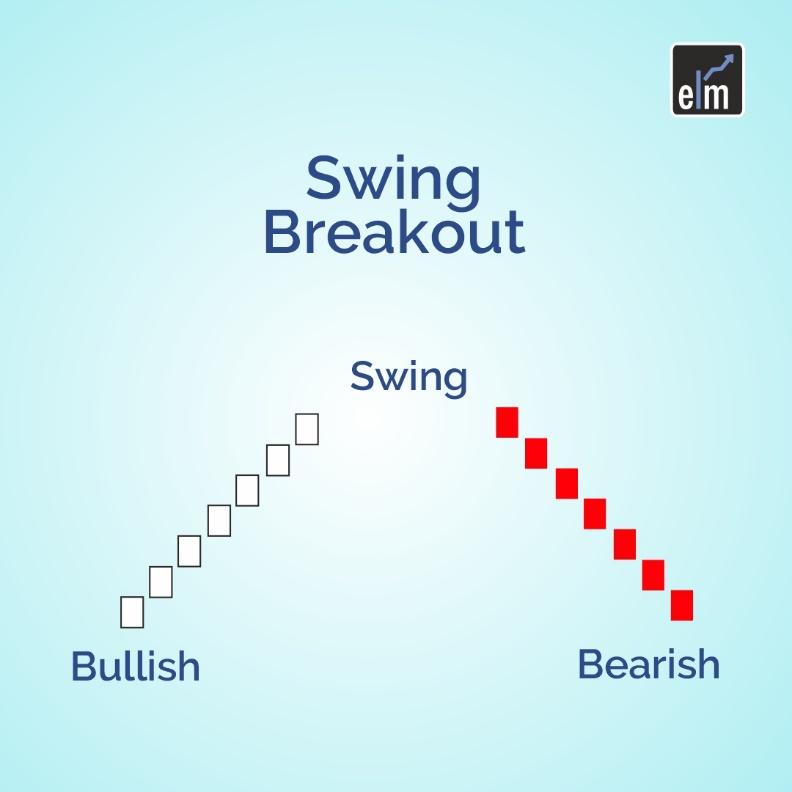
A swing move is a line of bricks moving in one direction. Bullish bricks show a bullish trend and bearish bricks show a bearish trend.
A swing high is created when a bearish brick appears following a string of bullish bricks. A bullish swing breakout occurs if the subsequent bullish bricks break above the most recent swing high. The price must print one brick higher than the previous swing high to complete a bullish swing breakout.
Accordingly, the bearish swing breakout is said to have been initiated at the brick that prints one brick below the low of an immediately preceding swing low in the following series of bearish bricks.
2. Anchor Brick
Anchor bricks are a string of succeeding bullish or bearish bricks. The number of bricks in such a series is difficult to determine because it depends on the used brick value. Generally, there should be a significant number of bricks pointing in one direction.
Any series of more than ten bricks in one direction can be regarded as anchor bricks for the sake of simplicity. A strong trend can be seen in such a series.
Following anchor bricks, one-backs, two-backs, or even straightforward swing breakouts are important patterns that should be actively traded. They represent one of the best trend continuation trade set-up types. A follow-through breakout amplifies the strength of the underlying trend, and anchor bricks signify strength or momentum.
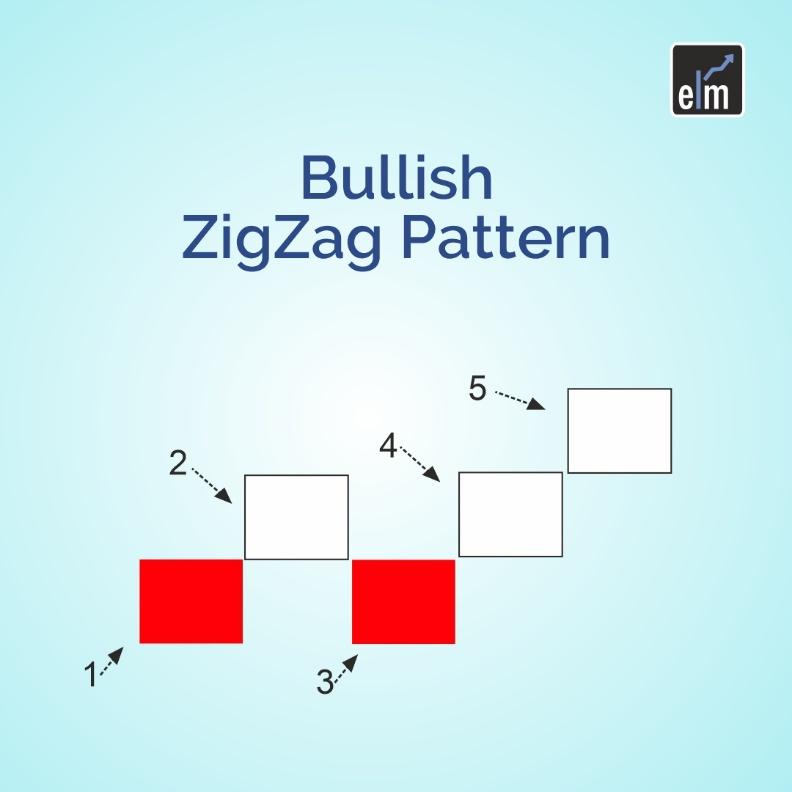
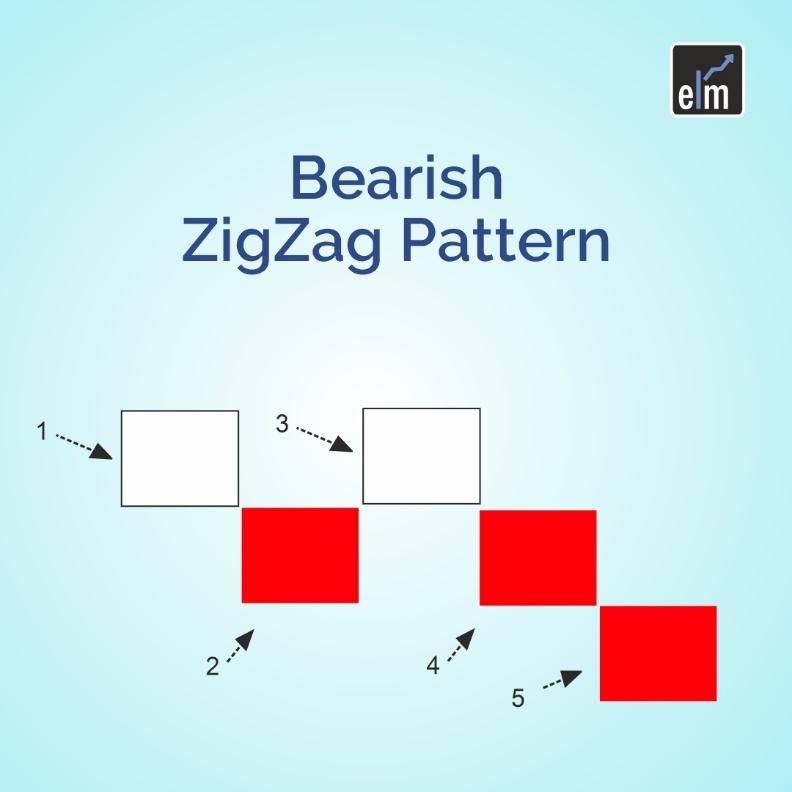
3. Zigzag
In contrast to the one-back and two-back patterns, the zigzag pattern denotes uncertainty and usually appears near the end of a trend.
As a result, a zigzag pattern that appears after a strong trend is much more significant because it signals hesitation and indecision among market participants. It also portends the possibility of a trend reversal, which presents a good trading opportunity.
4. 123 Pullback Pattern
It is a bullish 123 pullback pattern during an uptrend if the price retraces beneath the prior bullish swing breakout zone before reversing.
At least three bullish bricks follow the bullish swing breakout at Point B. The price then retraced below the swing high breakout point at Point 1 but did not fall below the low of the bullish swing at Point A, according to a subsequent series of bearish bricks. After that, at 3, there is a bullish brick reversal.
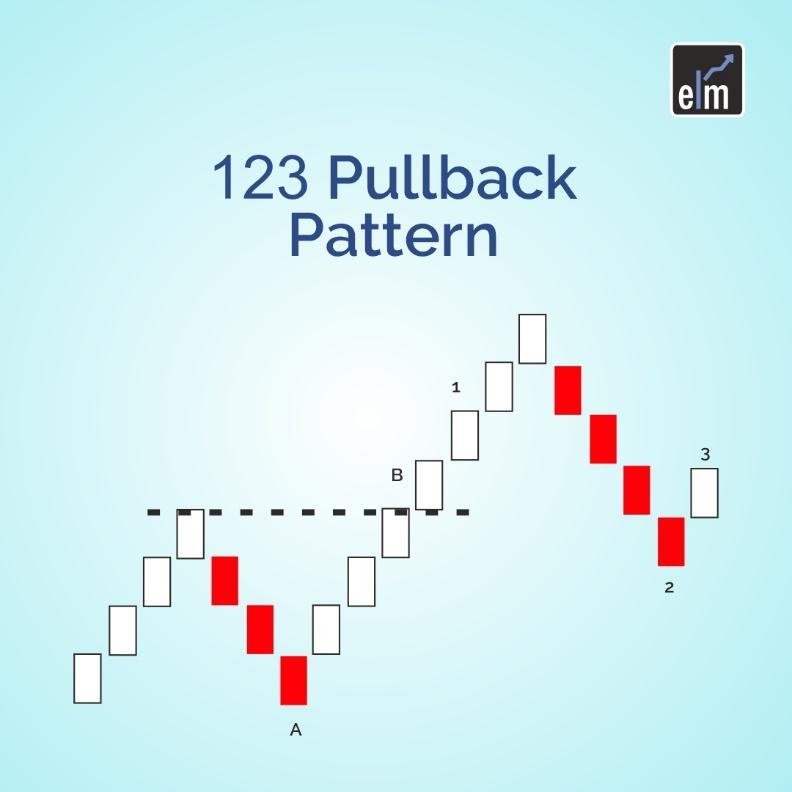
Remember to wait until the brick reversal has occurred before making a trade. Refrain from anticipating. The price will often completely reverse the previous swing move and offer no trades.
It’s also crucial to remember that trading this pattern with the trend will increase your chances of success. Before entering a trade, patterns contrary to the trend require more confirmation.
5. M and W Pattern
On Renko charts, M and W patterns are simple to spot and can be traded successfully. Spotting and trading these patterns is simpler thanks to the Renko Chart’s diagonal format for plotting the price action.
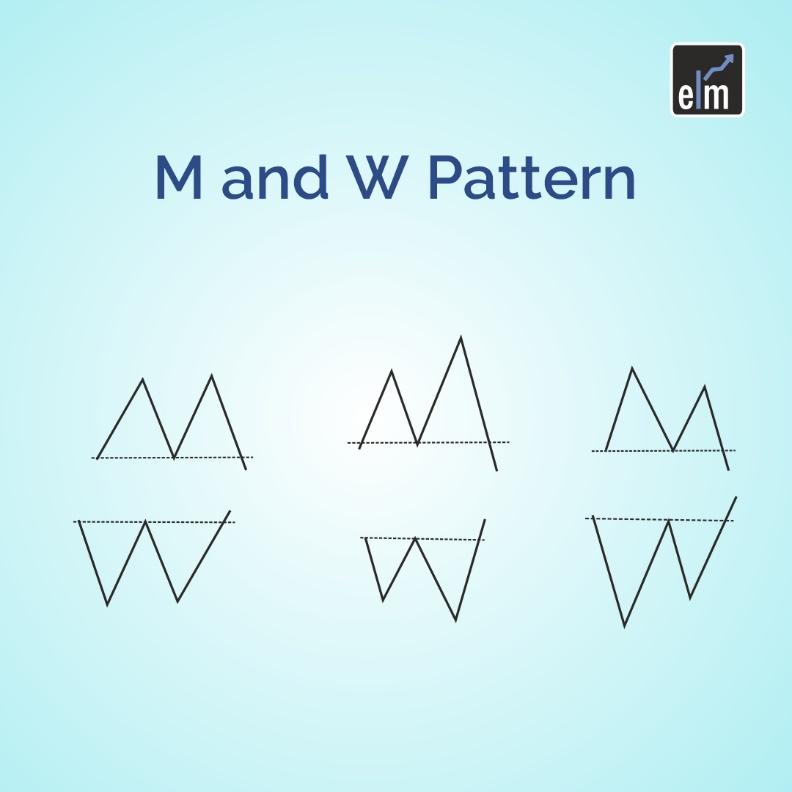
Following the horizontal neckline breakout, which occurs one brick below the neckline for “M” patterns and one brick above the neckline for “W” patterns, respectively, the breakout from these patterns is complete.
The low of the second leg of the W pattern also breaches the previous low in the case of the W pattern. These two patterns will be more significant if they become weak breakouts, with a maximum post-breakout distance of two bricks.
After discussing the patterns, let us discuss how to trade with Renko Charts:
How to trade with Renko Charts?
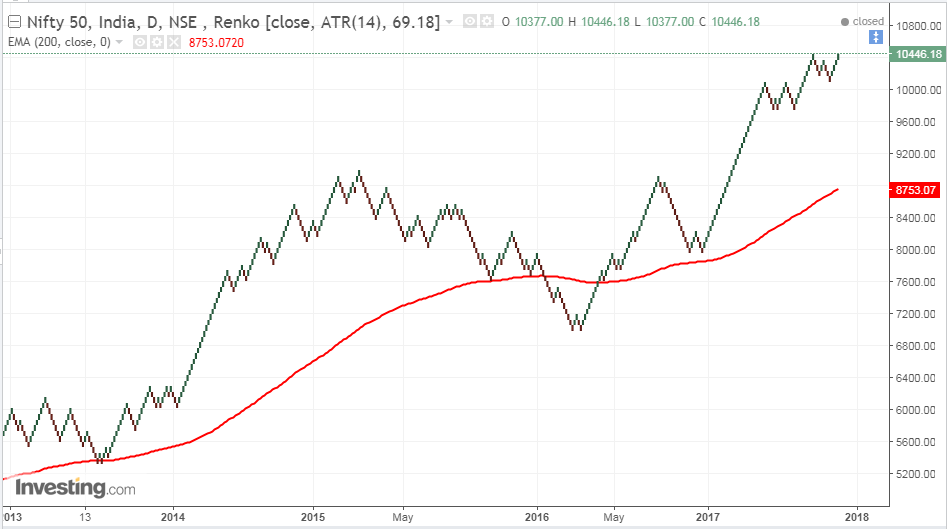
We will simply incorporate 200 Exponential Moving Average (EMA) to find trend direction. Accordingly, if the price is trading above its 200 EMA, then the trend is up. On the other hand, if the price is trading below its 200 EMA, then the trend is down.
When to enter and exit the trade?
The simple logic to enter a stock is when a green brick appears. On the other hand, you will exit your position when a red brick appears. However, to make it more refined, you may use Renko charts 13 periods EMA as a ‘trigger’ to signal an entry in the direction of the major trend.
First, wait for at least two green bricks to appear above the 13 EMA. Then enter long on the appearance of the second green brick above the 13 EMA. The same logic will be on the downside.
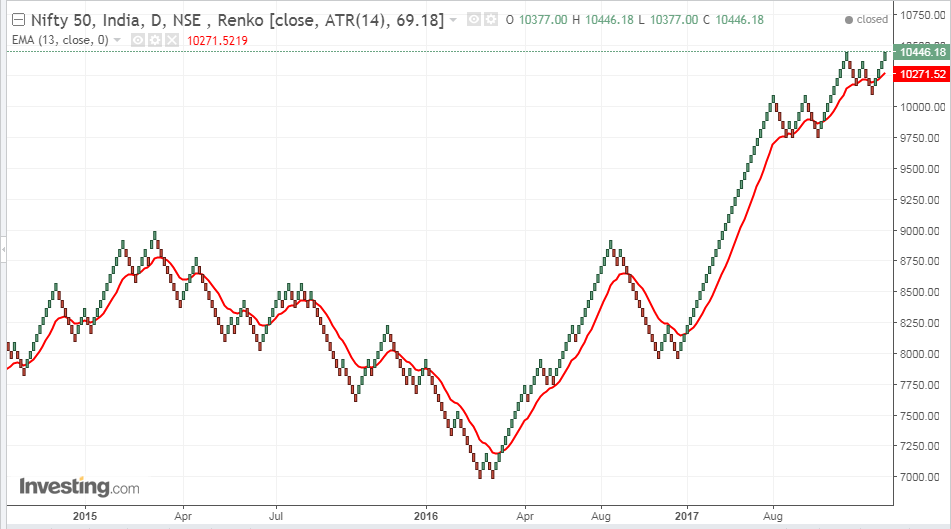
Now the important question will be what will be your target? It’s simply a trend-riding system and it will help you keep trailing your profits until a red brick appears in case of long and vice versa for the short position.
How to predict events based on Renko charts?
People generally use Renko as a trend riding system but truly speaking there are better charting techniques like Heiken Ashi, which gives works better with regard to this. Don’t just trade based on Renko but understand what Renko has to offer actually?
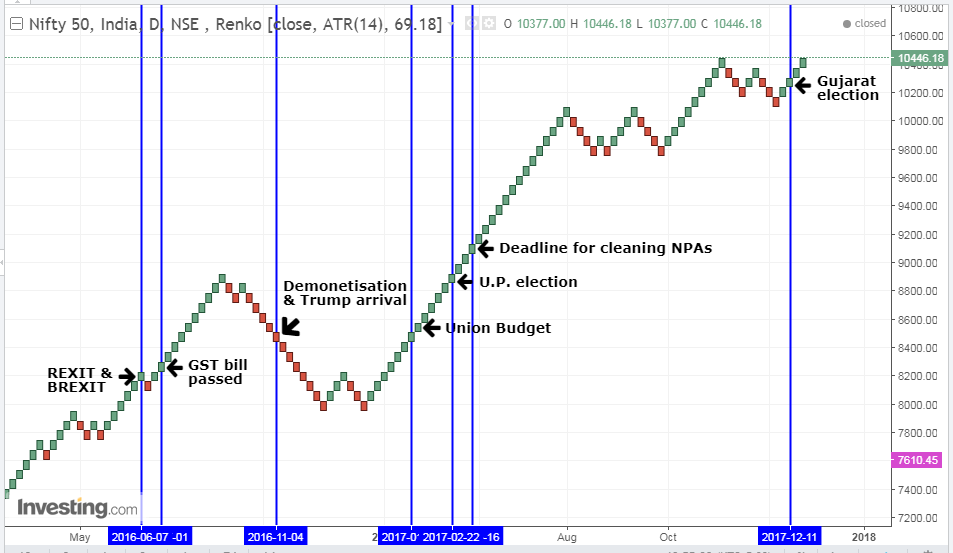
Smart traders simply use Renko to predict the outcome of major events like elections and budgets.
The day prior to an event will clearly reflect where the market will be headed. For example, say tomorrow the election is going to come out and you saw last brick to be green, you went long on the day of the election.
Similarly, if there is red brick prior to the day of the event, you may go short (with an accuracy of about 80%). Please note here we are using ATR value to be the brick size rather than giving our predefined absolute value.
Here’s a list of various events where Renko has informed us in the previous brick about the subsequent movement in the market-
Let us discuss some trading strategies that can be used with Renko Charts:
What is Renko Charts strategy ?
A Renko trading strategy can assist traders in identifying high-quality trading opportunities. A Renko chart can provide the following signals:
1. Support and Resistance
Renko charts exhibit strength when the bricks alternate at a specific price area for an extended period of time. At these levels, traders can trade range-bound strategies while keeping an eye out for them.
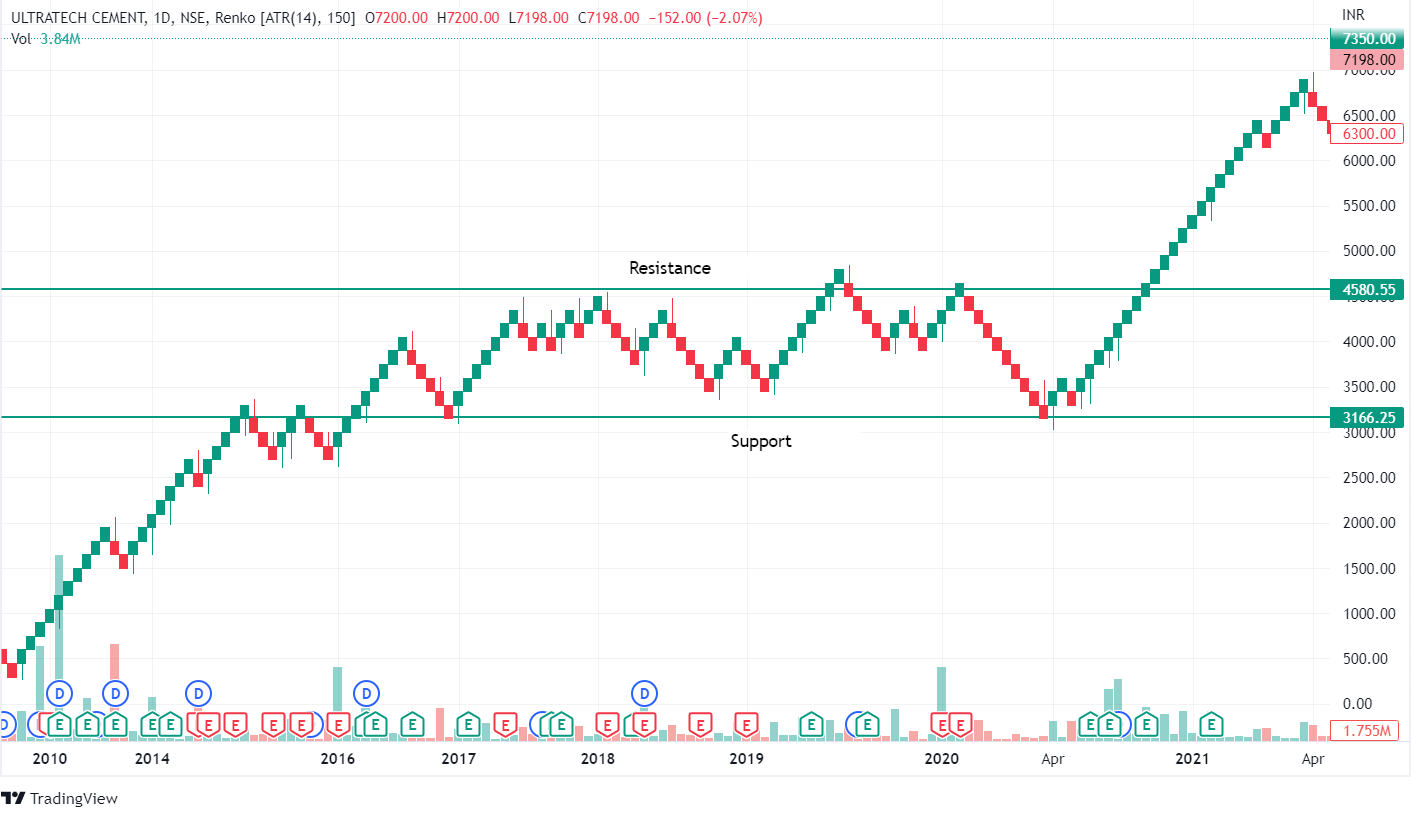
A range-bound trade will involve buying near areas of support and selling near areas of resistance. Renko charts highlight strong support and resistance areas, allowing traders to look for price breakouts and ride the new trend.
2. Trailing Stop Losses
Renko charts help traders identify the long-term dominant trend. This could allow traders to profit from the trend in the long run. While this is fantastic, it is also critical to partial book profits as the trend continues. Renko charts are excellent for determining the best price areas to enter to maximize profits from following an existing trend.
Renko charts provide traders with high-quality, dependable signals. However, the formation of boxes can sometimes be delayed, denying traders the opportunity to capitalize on a good opportunity early on. While long-term traders will not be bothered by this, it may be very restrictive.
What is the Difference Between Renko Charts and Heikin Ashi Charts?
Renko charts and the similarly designed Heikin Ashi charts both display extended periods of up or down boxes that draw attention to the trend.
Heikin Ashi charts average the open, high, low, and close for the current and past time periods, whereas Renko charts employ a fixed box amount.
As a result, each box or candle has a varied size that corresponds to its average price. The same as Renko charts, Heikin Ashi charts are helpful for highlighting patterns.
To know more in details, you can also join our Masterclass on Renko Chart Patterns
What are the Pros and Cons of Using Renko Charts?
Let us discuss the advantages and disadvantages of using Renko Charts:
Due to their lack of reliance on time, Renko charts do not provide as much detail as candlesticks or bar charts. A stock fluctuating for a long time may be represented by a single box, which does not convey everything that happened during that time. This may be advantageous to some traders but not to others.

Renko charts provide a broader view of the market and aid in identifying long-term market trends (short-term noise is filtered out), and assist traders in identifying market support and resistance areas.
Renko charts assist traders in capitalizing on long-term trends and identifying markets where the trend has clearly reversed. This can help you decide when to offset positions in trending markets.
Bottomline
Like their Japanese cousins (Kagi and Three Line Break), Renko charts filter the noise by focusing exclusively on minimum price changes. Renko bricks are not added unless the price changes by a specific amount.
Frequently Asked Questions (FAQs)
Is Renko trading profitable?
Renko charts are not statistically proven to be more beneficial for traders than traditional candlestick charts. Renko charts, however, are more useful for some traders than normal charts for identifying support and resistance levels due to their unique visuals and minimal noise.
Do Renko charts work?
Since there is a lot less noise on a Renko chart than on a candlestick chart, they are good at detecting support and resistance levels. Before even one brick in the opposite direction emerges, Renko traders may be able to ride a powerful trend for a considerable amount of time.
Which timeframe is best for the Renko chart?
The bricks are not produced based on time intervals because the Renko chart is not a time-based chart. Despite having a time axis, Renko charts do not build their bricks using time intervals. While multiple bricks may form in a single day, one brick may take months to form.
Is Renko Chart better than Candlestick?
The Renko chart is noticeably smoother than the candlestick chart, which is the most noticeable distinction between the two. Day traders may find trends, points of support and resistance, breakouts, and reversals using Renko charts.
You can also visit web.stockedge.com, a unique platform 100% focused on research and analytics.


