Elearnmarkets - Financial Market Learning
  • Courses
  • Webinars
  • Stories
  • Language
    • English
    • Hindi
    • Bengali
No Result
View All Result
Get Free Course
  • Basic Finance
  • Derivatives
    • Futures
    • Options
  • Financial Planning
  • Fundamental Analysis
  • Technical Analysis
  • Mutual Funds
  • Marketshala
  • Miscellaneous
Elearnmarkets - Learn Stock Market, trading, investing for Free
  • Courses
  • Webinars
  • Stories
  • Language
    • English
    • Hindi
    • Bengali
No Result
View All Result
Get Free Course
Elearnmarkets - Learn Stock Market, trading, investing for Free
No Result
View All Result
Home Technical Analysis
How to generate powerful trading signals using Parabolic SAR and RSI?

How to generate powerful trading signals using Parabolic SAR and RSI?

Elearnmarkets by Elearnmarkets
December 2, 2024
in Technical Analysis, Charts, Patterns & Indicators
Reading Time: 3 mins read
6
9.2k
VIEWS
Share on FacebookShare on XShare on WhatsApp

Parabolic SAR is a price and time based technical analysis tool which works very well in the trending market and also identifies potential reversal and stops.

It is plotted on the price chart which appears as a dot just above or below the candlesticks or bars.

When the price is in a bearish trend, you will notice that the Parabolic SAR dots appear above the price. On the other hand, during an uptrend, you will see the dots appear below the price.

Table of Contents
Interpretation of Parabolic SAR
Trading strategy using Parabolic SAR and RSI
Bottomline

Interpretation 

Parabolic SAR is a good trend following indicator which strictly follows price.

SAR usually works like a trailing stop loss on the price chart.

In an uptrend, the SAR dots remains below the price and rises as long as the uptrend remains in place.

reliance capital parabolic sar

Once price stops going up and reverses below the SAR dots, it marks the beginning of a downtrend. Basically, in a downtrend, the SAR dots continue to remain above the price.

Some of the traders even put their stop-loss based on SAR dots.

Trading strategy using Parabolic SAR and RSI

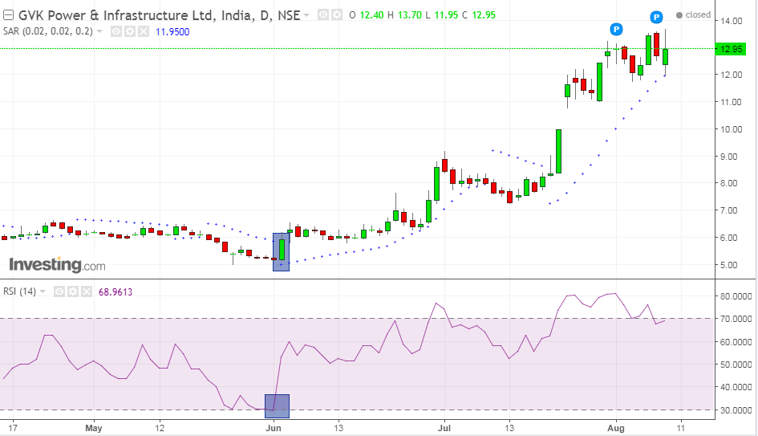
A buy signal is generated when RSI cuts 30 level from below and the first dot of Parabolic SAR comes below the price.

Learn to make best use of RSI Indicator trading strategy in 2 HRS.

The chart below is of GVK Power and Infra and as you can see in the chart that in the first week of June when the first dot of Parabolic SAR appeared below the price and simultaneously RSI also 30  level from below, a buy signal was generated.

After the signal, the stock gave a very rapid move on the upside.

parabolic sar strategy chart

Also read: CANSLIM- the winning techno-fundamental strategy

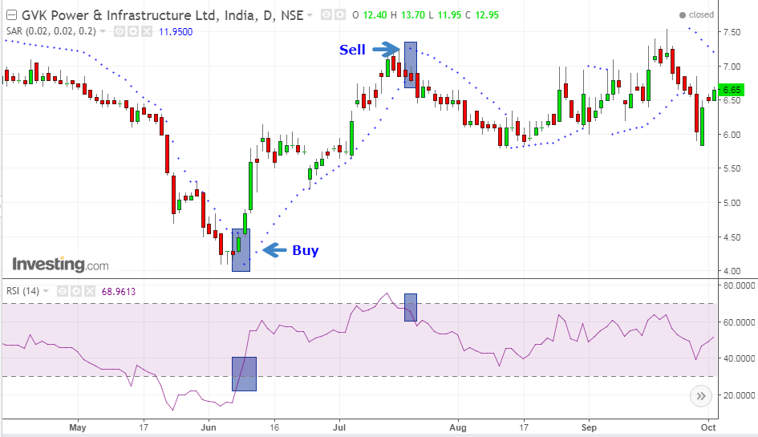
A sell signal is generated when RSI cuts 70 level from above and the first dot of Parabolic SAR comes above the price.

You may also see the video below to understand various scans using Stockedge app.

The chart below shows that when the first SAR dot came above the price and simultaneously the RSI also cut 70 from above, it generated a sell signal. The stock gave a good correction after the sell signal was generated.

buy sell strategy chart

Bottomline

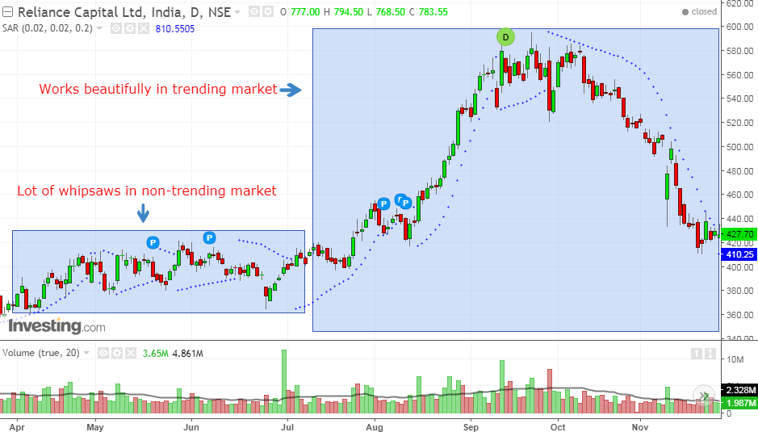
The SAR works wonderfully with the trending securities, which according to Welles Wilder occurs about 30% of the time.

Thus you will witness a lot of whipsaws when the security is a non-trending mode.

Also Read – Parabolic SAR – Calculation, Indicators & Use

Like other indicators, the signal quality will also depend upon the characteristics of the underlying security.

It should also be used in conjunction with other indicators and technical analysis techniques to generate better trading signals.

Tags: advanceenglishIndicators and oscillatorsParabolic SARrsitechnical analysis
ShareTweetSend
Get Kotak Offer Get Kotak Offer Get Kotak Offer
Previous Post

CANSLIM- the winning Techno-Fundamental strategy

Next Post

Nifty Closes Above All Short-Term Moving Average; Bulls Back In Control

Elearnmarkets

Elearnmarkets

Elearnmarkets (ELM) is a complete financial market portal where the market experts have taken the onus to spread financial education. ELM constantly experiments with new education methodologies and technologies to make financial education effective, affordable and accessible to all. You can connect with us on Twitter @elearnmarkets.

Related Posts

Understand Slippage in Trading
Technical Analysis

What is Slippage in Trading? Meaning & Examples

March 28, 2025
297
Breakout trading strategies
Technical Analysis

Top 5 Breakout Trading Strategies

March 12, 2025
1.1k
5 stocks for today
Technical Analysis

5 Stocks to Buy Today That Could Beat the NIFTY in 2025!

May 5, 2025
398
Image describing What is marginal trading facility
Technical Analysis

 What is a Margin Trading Facility? Advantages & Risks

April 4, 2025
661

Comments 6

  1. jugal kishore bothra says:
    7 years ago

    good tool

    Reply
    • Tista Sengupta says:
      7 years ago

      Hello Jugal,

      Thank you for your comment.

      If you want to learn technical analysis from scratch you can enroll in: NSE Academy Certified Technical Analysis course on Elearnmarkets.
      Happy Learning!!

      Reply
  2. Samantha Denning says:
    6 years ago

    Great info, thanks for sharing this!

    Reply
    • Sakshi Agarwal says:
      6 years ago

      Hi,

      Thank you for Reading!

      Keep Reading

      Reply
  3. DSEETHARAMARAO says:
    4 years ago

    EXCELLENT COMBINATION. TRADING IS EASY.

    Reply
    • Sakshi Agarwal says:
      4 years ago

      Hi,

      We really appreciated that you liked our blog.

      Keep Reading!

      Reply

Leave a Reply Cancel reply

Your email address will not be published. Required fields are marked *

Disclaimer

Elearnmarkets (Kredent InfoEdge Pvt. Ltd.) is a SEBI-registered Research Analyst (RA) entity (SEBI Registration No.: INH300007493). The information provided in this article is for educational and informational purposes only and should not be considered as an offer to buy or sell any securities or investment products.

The stocks, securities, and investment instruments mentioned herein are not recommendations under SEBI (Research Analysts) Regulations, 2014. Readers are advised to conduct their own due diligence and seek independent financial advice before making any investment decisions.

Investments in securities markets are subject to market risks. Please read all related documents carefully before investing. Investing in Equity Shares,
Derivatives, Mutual Funds, or other instruments carry inherent risks, including potential loss of capital. Elearnmarkets (Kredent InfoEdge Pvt. Ltd.) does not provide any guarantee or assurance of returns on any investments. Past performance is not indicative of future performance.

Elearnmarkets Logo

Follow Us

Facebook-f X-twitter Instagram Linkedin-in Youtube Telegram

Register on Elearnmarkets

Continue your financial learning by creating your own account on Elearnmarkets.com

Register Free Account

Download App

Playstore logo
Download on app store

Categories

  • Basic Finance
  • Derivatives
  • Financial Planning
  • Fundamental Analysis
  • Technical Analysis
  • Mutual Funds
  • Miscellaneous

Popular On Elearnmarkets

  • Market Superheroes:
  • Vivek Bajaj
  • Chetan Panchamia
  • Ashish Kyal
  • Premal Parekh
  • Abhijit Paul
  • Jegan
  • Sivakumar Jayachadran
  • Jyoti Budhia
  • Vivek Gadodia
  • Vishal Mehta
  • Piyush Chaudhry
  • Santosh Pasi
  • Gomathi Shankar
  • Market Superheroes:
  • Vivek Bajaj
  • Chetan Panchamia
  • Ashish Kyal
  • Premal Parekh
  • Abhijit Paul
  • Jegan
  • Sivakumar Jayachadran
  • Jyoti Budhia
  • Vivek Gadodia
  • Vishal Mehta
  • Piyush Chaudhry
  • Santosh Pasi
  • Gomathi Shankar
  • Courses:​
  • Options Trading
  • Dow Theory
  • Momentum Trading
  • Stock Investing
  • Harmonic Chart Patterns
  • Algo Trading
  • Elliot Wave Theory
  • Advanced Excel
  • Cryptocurrency
  • NSE Certification Course
  • Courses:​
  • Options Trading
  • Dow Theory
  • Momentum Trading
  • Stock Investing
  • Harmonic Chart Patterns
  • Algo Trading
  • Elliot Wave Theory
  • Advanced Excel
  • Cryptocurrency
  • NSE Certification Course
  • Webinars:
  • Bank Nifty Scalping
  • Intraday Trading Strategies
  • Options Trading Strategies
  • Options selling
  • Price Action
  • Relative Strength
  • Tax Planning
  • Options Buying
  • Growth Stocks
  • Portfolio Management
  • Risk Management
  • Renko Charts
  • Crude Oil
  • Traders Psychology
  • Moving Average
  • Multibagger Stocks
  • Free Learning Modules:
  • Intraday Trading
  • Options Scalping
  • Swing Trading
  • Financial Modelling
  • RSI Indicator
  • Bollinger Bands
  • Pricing of Futures
  • Personal Finance
  • Initial Public Offerings (IPO)
  • Value Investing
  • Technical Indicators
  • Candlesticks
  • Chart Patterns
  • Option Greeks
  • ELSS Funds
  • Banking and Insurance
  • Real Estate
  • Gold
  • Book Summaries:
  • Rich Dad Poor Dad
  • Psychology of Money
  • The Intelligent Investor
  • The Richest Man in Babylon
  • Think and Trade Like a Champion
  • Value Investing and Behavioural Finance
  • Trading in the Zone
  • Learn to Earn
  • Book Summaries:
  • Rich Dad Poor Dad
  • Psychology of Money
  • The Intelligent Investor
  • The Richest Man in Babylon
  • Think and Trade Like a Champion
  • Value Investing and Behavioural Finance
  • Trading in the Zone
  • Learn to Earn
  • Tools:
  • CAGR Calculator
  • SIP Calculator
  • eLearnOptions
  • Future Value Calculator
  • Present Value Calculator
  • Atal Pension Yojana
  • Cost of Delay Calculator
  • Become a Crorepati
  • Tools:
  • CAGR Calculator
  • SIP Calculator
  • eLearnOptions
  • Future Value Calculator
  • Present Value Calculator
  • Atal Pension Yojana
  • Cost of Delay Calculator
  • Become a Crorepati

© 2025 Elearnmarkets. All Rights Reserved

  • Visit Elearnmarkets
  • Courses
  • Webinars
  • Financial Guides
  • Get Free Counselling
  • Visit Elearnmarkets
  • Courses
  • Webinars
  • Financial Guides
  • Get Free Counselling

Download Our App

No Result
View All Result
  • Article Categories
    • Basic Finance
    • Derivatives
    • Financial Planning
    • Fundamental Analysis
    • Technical Analysis
    • ETFs & Mutual Funds
    • Marketshala
    • Miscellaneous
  • Language
    • Hindi
    • Bengali
    • English
  • Courses
  • Webinars
  • Stories
Get Free Course

© 2024 Elearnmarkets All Rights Reserved

A Handbook of Technical Analysis
To start your trading journey as a seasoned technical analyst
Download Guide For FREE
Guidebook On Chart Patterns
Take Your Trading To The Next Level With Strategies Shared In This Ebook
Download Guide For FREE
Trading Mentorship Program