English: Click here to read this article in English.
महत्वपूर्ण बिंदु:
- मूविंग एवरेज कन्वर्जेन्स डाइवर्जेंस जो कि एक MACD indicator है, वह एक लोकप्रिय ट्रेंड फॉलो करने वाला और मोमेंटम इंडिकेटर है׀
- MACD मूविंग एवरेज पर आधारित है जिसका अर्थ है कि यह मोमेंटम का एनालिसिस करने के लिए आदर्श है, यह ट्रेंड को फॉलो करती हुई एंट्री का पता लगाता है, और जब तक मोमेंटम का अंत नहीं हो जाता यह ट्रेंड में बना रहता है׀
- जब हम यह देखते है कि MACD इंडिकेटर की दो लाइनें एक-दूसरे से दूर हो जाती है, तो इसका अर्थ होता है कि मोमेंटम बढ़ रहा है और ट्रेंड मजबूत हो रहा है׀
मूविंग एवरेज कन्वर्जेन्स डाइवर्जेंस जो कि एक MACD इंडिकेटर है, वह एक लोकप्रिय ट्रेंड फॉलोविंग है और मोमेंटम इंडिकेटर है, जो मूविंग एवरेज की जानकारी पर आधारित है और एक अतिरक्त मोमेंटम टूल के साथ-साथ ट्रेडिंग के लिए मोमेंटम फ़िल्टर की भांति कार्य करता है׀
“बाज़ार का केवल एक ही पक्ष है और यह बुल पक्ष या बेयर पक्ष नहीं है, बल्कि सही पक्ष हैं׀”– जेसी लीवरमोर
इस इंडिकेटर को पूरी तरह समझने के लिए सबसे पहले टेक्निकल एनालिसिस के कांसेप्ट को समझना होगा׀ इस ब्लॉग में, हम बताएँगे कि यह MACD indicator क्या करता है, यह प्राइस का एनालिसिस करने में कैसे मदद करता है और इसे अपनी ट्रेडिंग में कैसे उपयोग करें:
MACD Indicator के घटक:
MACD लाइन: यह लाइन इंडिकेटर का एक महत्वपूर्ण हिस्सा है और डिफ़ॉल्ट रूप से यह 12 पीरियड EMA और 26 पीरियड EMA के बीच का अंतर है׀ इसका अर्थ यह है कि MACD लाइन मूल रूप से एक पूर्ण मूविंग एवरेज क्रॉसओवर सिस्टम है׀
सिग्नल लाइन: यह MACD लाइन का 9 पीरियड EMA है׀
MACD Indicator की मूल बातें:
जैसा की हमने ऊपर चर्चा की है, MACD मूविंग एवरेज पर आधारित है जिसका अर्थ है कि यह मोमेंटम के एनालिसिस के लिए आदर्श है, ट्रेंड को फॉलो करती हुई एंट्रीज का पता लगाता है और जब तक मोमेंटम का अंत नहीं हो जाता यह ट्रेंड में बना रहता है׀
यहाँ आमतौर पर विशेष रूप से 2 MACD सिग्नल होते है जिनके बारे में हम इस लेख में पता लगाएंगे और यह बताएँगे कि ट्रेड को खोजने के लिए MACD का उपयोग कैसे करें:
- MACD लाइन क्रॉस 0
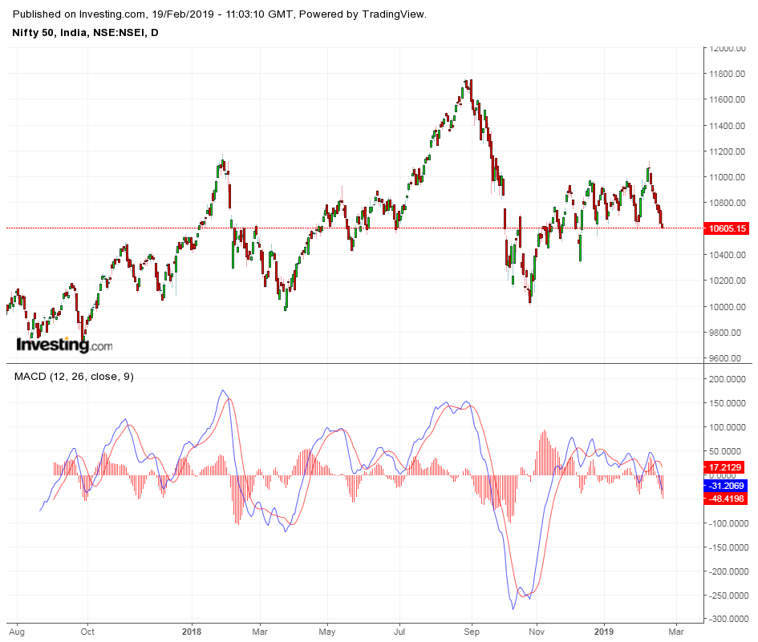
मैंने MACD लाइनों के साथ चार्ट पर दो मूविंग एवरेज, 12 और 26 EMA को भी प्लाट किया है ताकि MACD कैसे काम करता है यह समझाया जा सके׀
जब 12 EMA नीचे या ऊपर से 26 EMA, को पार करता है, तो MACD भी 0 पार करता है׀ जैसा कि ऊपर कहा गया है, MACD स्वयं ही केवल एक लाइन में खुद का मूविंग एवरेज क्रॉसओवर सिस्टम है׀
- सिग्नल लाइन
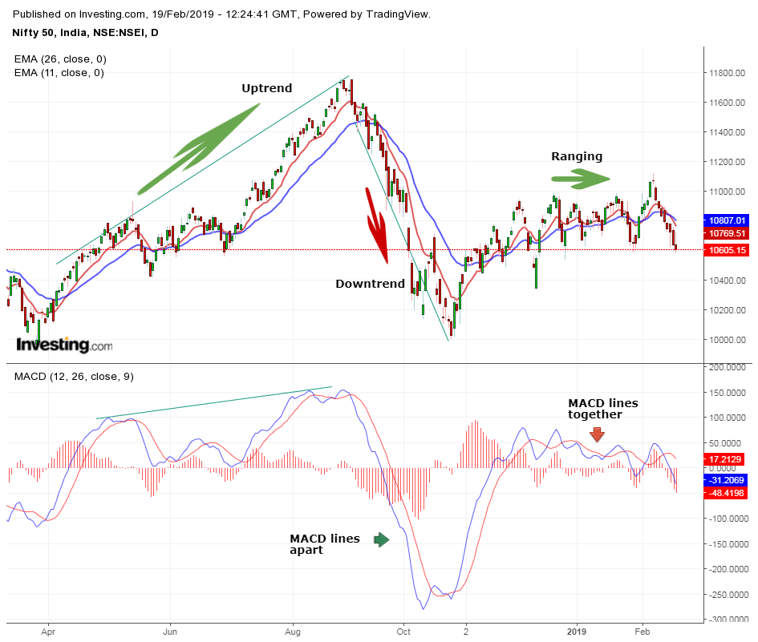
जब हम यह देखते है कि MACD इंडिकेटर की दो लाइनें एक-दूसरे से दूर हो जाती है, तो इसका अर्थ होता है कि मोमेंटम बढ़ रहा है और ट्रेंड मजबूत हो रहा है׀ जब यह दो लाइनें एक-दूसरे के करीब आती हैं तो यह ये दर्शाता है कि कीमतों की मजबूती में कमी आ रही है׀
नोट: जब तक कीमत 12 और 26 EMAs से ऊपर है और MACD लाइनें 0 से ऊपर है तो ट्रेंड अभी भी जारी है׀
मार्केट एक्सपर्ट्स द्वारा टेक्निकल एनालिसिस अब हुआ आसान कोर्स से टेक्निकल एनालिसिस की मूल बातें जाने
ट्रेंड को फॉलो करती हुई एंट्री
आइये देखें कि MACD की व्याख्या को समझने से कोई कैसे बाज़ार के विभिन्न चरणों में प्रवेश कर सकता है:
- कंसोलिडेशन:
रेंज के दौरान, दो MACD लाइनें एक साथ बहुत करीब हैं और वे 0 के आसपास मंडराते है, जैसा कि हम नीचे दिए गए चार्ट से देख सकते है׀ इसका अर्थ यह है कि यहाँ न तो मोमेंटम है और न ही मजबूती׀
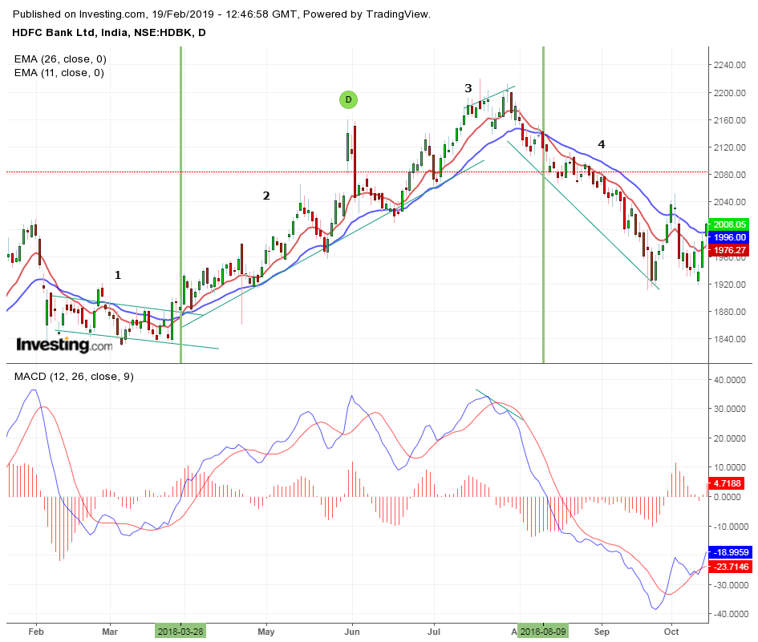
बिंदु #1 पर, कीमत ने भी एक छोटी रेंज बनायीं׀ बिंदु 1 की तरह कंसोलिडेशन के दौरान, साथ ही साथ MACD तेज़ी से सिकुड़ जाता है और ट्रेडर्स नए ट्रेंड के शुरू होने के लिए वैज के ब्रेकआउट का इंतज़ार करते है׀
- अपट्रेंड:
जब कीमत वैज को तोड़ देती है, तो EMA 26 नीचे से EMA 12 को पार करता है, MACD लाइनें भी एक-दूसरे से अलग हो कर 0 से ऊपर मूव करती है׀ नीचे दिए गए चार्ट से हम देख सकते है कि बिंदु #2 पर दोनों मूविंग एवरेज एक-दूसरे से अलग हो गयी है और 0 को पार कर गयी है׀ यह नए अपट्रेंड की शुरुआत है׀
यह भी पढ़ें: टेक्निकल इंडिकेटर में लीडिंग इंडिकेटर क्या हो सकता है?
- डाउनट्रेंड:
बिंदु #3 पर डाइवर्जेंस एक सिग्नल है जिसके बारे में हम नीचे पता लगाएंगे और इसने रिवर्सल के लिए शुरूआती संकेत दिए׀ डाउनट्रेंड के दौरान #4 में कीमतें फिर से मूविंग एवरेज से नीचे रहीं और MACD लाइनें 0 से नीचे रहीं׀
प्रारंभिक एंट्री के रूप में MACD डाइवर्जेंस:
MACD डाइवर्जेंस एंट्री या एग्जिट के बाद शुरुआती ट्रेंड का पता लगाने और एनालिसिस करने का एक शानदार तरीका है׀
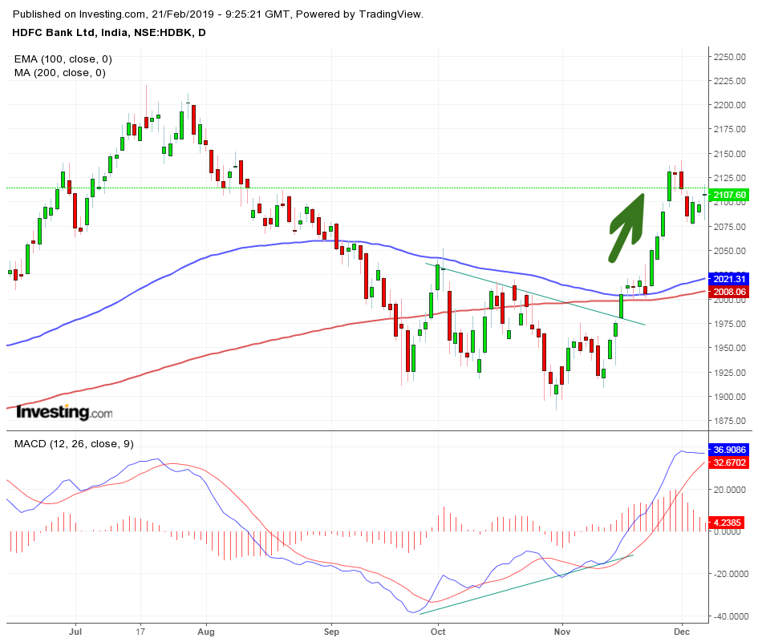
आप नीचे दिए गए चार्ट से देख सकते है कि लम्बे समय तक कीमत कैसे धीरे-धीरे कम हो रही थी׀ और उस ही समय, MACD उच्चतर चली जाती है और यह दिखाती है कि स्लो ग्राइंड के पीछे कोई बिक्री की मजबूती नहीं थी׀
अचानक मूविंग एवरेज के ऊपर प्राइस टूट गया जबकि MACD लाइनें 0 से ऊपर चली गयीं और आगे जा कर अलग हो गयी׀ यह नए अपट्रेंड का सिग्नल हो सकता है׀
MACD Indicator बनाम रिलेटिव स्ट्रेंथ:
रिलेटिव स्ट्रेंथ इंडिकेटर (RSI) सिग्नल देता है, यदि कोई बाज़ार हाल के प्राइस लेवल के सम्बन्ध में ओवरबॉट या ओवरसोल्ड माना जाता है׀

जहाँ, MACD दो EMAs के बीच सम्बन्ध को मापता है, वहीं RSI हाल के प्राइस हाई और लो के सम्बन्ध में मूल्य परिवर्तन को मापता है׀
इन दो इंडिकेटर का एकसाथ उपयोग एनालिस्ट को बाज़ार की पूरी टेक्निकल तस्वीर प्रदान करने के लिए किया जाता है׀
MACD Indicator के लिमिटेशन:
डाइवर्जेंस अक्सर एक संभावित रिवर्सल का सिग्नल देता है लेकिन यह कभी-कभी एक झूठी सकरात्मकता भी पैदा कर सकता है׀
दूसरी समस्या यह है कि डाइवर्जेंस बहुत से रिवर्सल का प्रेडिक्शन करता है जो होते नहीं है और पर्याप्त रियल प्राइस रिवर्सल नहीं होते है׀
इसके अलावा, मोमेंटम में मंदी के कारण MACD अपने पूर्व चरम से दूर हो जाएगा׀
जैसे कि अधिकांश इंडिकेटरों के साथ, जब हम चार्ट से सीधे मोमेंटम की सूचनाओं को पढ़ते हैं, तो शायद हमें उनकी आवश्यकता नहीं होती है׀ लेकिन इंडिकेटर विश्वास बनाने और हमारी ट्रेडिंग में निष्पक्षता बनाने के लिए एक महान उपकरण हो सकते है׀
हालाँकि, कभी किसी को यह न बताने दें कि इंडिकेटर काम नहीं करते हैं׀ हाँ, वो काम करते है! यह आप पर निर्भर करता है कि आप उनका उपयोग किस प्रकार करते है׀


Very very special 📚 knowledge. 🌹 thanks.
Hi,
We are glad that you liked our blog post.
Thank you for Reading!
Very useful post
Hi,
We really appreciated that you liked our blog!
Thank you for Reading!
Keep Reading!