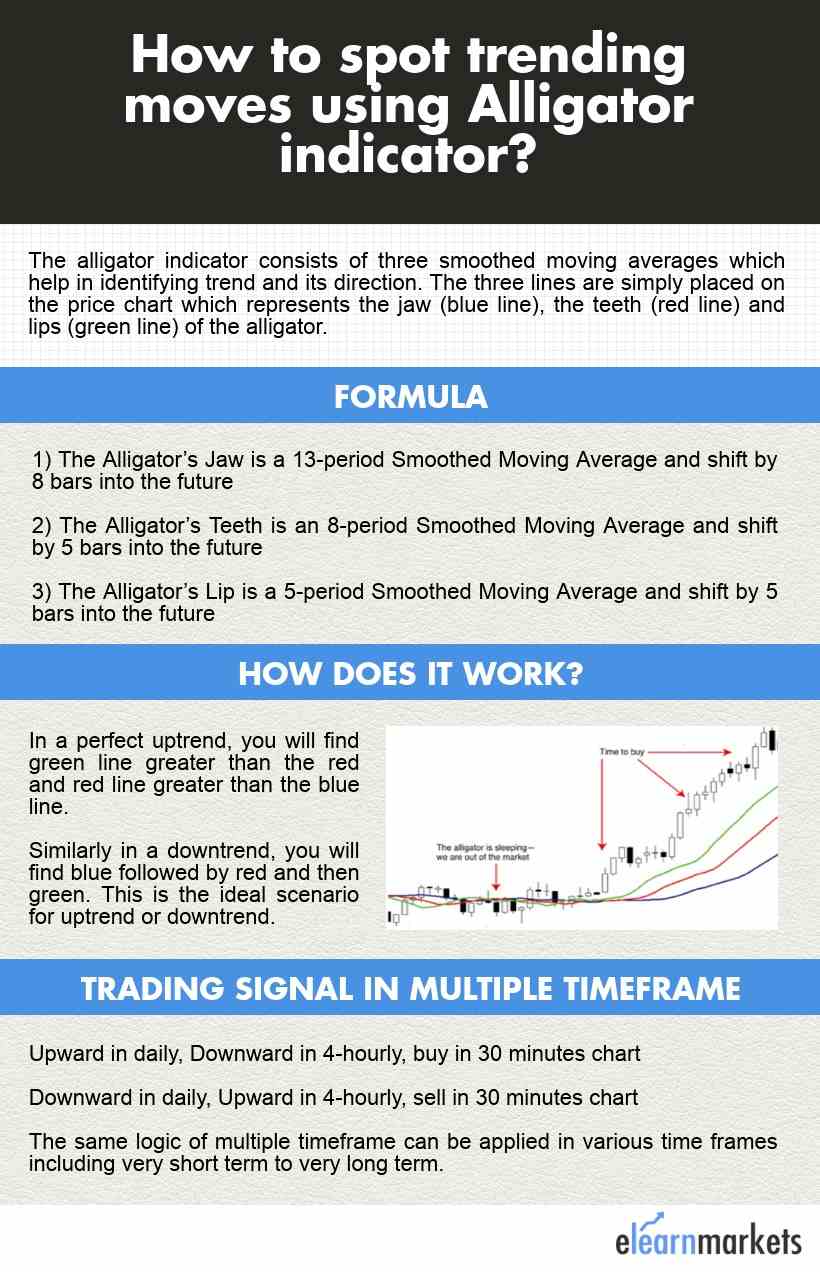
The alligator indicator developed by Bill Williams consists of three smoothed moving averages which help in identifying a trend and its direction.
The three lines are simply placed on the price chart which represents the jaw (blue line), the teeth (red line) and lips (green line) of the alligator.
When three lines are twisted together, it is implied that the beast is sleeping and its mouth is closed.
However, when it enters into a trend, it wakes up and starts eating and again it goes back to sleep mode. This is how the process continues.
| Table of Contents |
|---|
| Alligator Indicator Formula |
| Trading signal in Multiple Time frame |
| Bottomline |
In a perfect uptrend, you will find green greater than the red and redline greater than the blue line.
Similarly, in a downtrend, you will find blue followed by red and then green.
This is the ideal scenario for uptrend or downtrend.
You should always enter the trade when it is entering into a particular trend and avoid when these lines are twisted together.
Alligator Indicator Formula
The Alligator indicator is easily available on various charting platforms and it is done using the following steps-
1) The Alligator’s Jaw (Blue line) is a 13-period Smoothed Moving Average and shift by 8 bars into the future
Know More: How to trade using moving average on different timeframes?
2) The Alligator’s Teeth (Red” line) is an 8-period Smoothed Moving Average and shift by 5 bars into the future
3) The Alligator’s Lips (Green line), is a 5-period Smoothed Moving Average and shift by 5 bars into the future
Trading signal in multiple time frame
Look for proper trading setup in the daily time frame whether on the upside or downside.
Say you identified the buy or sell setup in daily time frame but due to lag you may miss the initial move.
Also read: 5 important uses of RSI
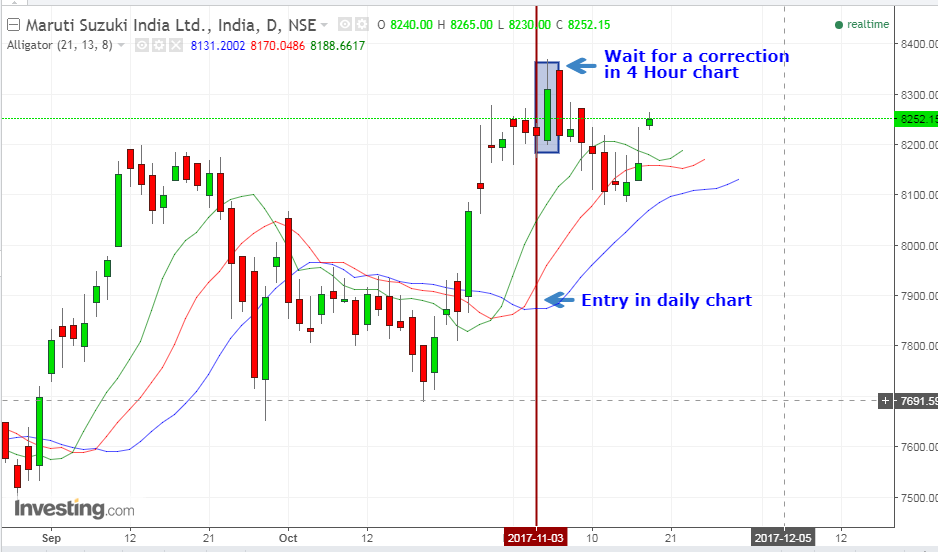
But as you know that price does not move in a straight line but moves in a series of peaks and troughs.
So you may aim to enter a wave in a smaller time frame say 4 hours in a different direction to find a good entry point.
Here you will wait for the alligator to move against the daily signal.
In simple words, you are looking for a wave inside the flow to identify the move in a different direction so as to identify a proper entry point.
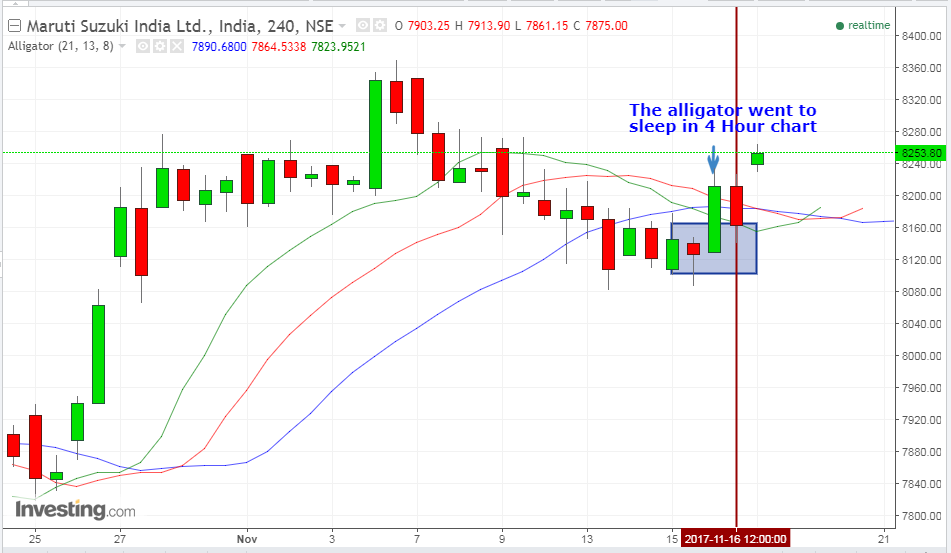
You found the uptrend in the daily timeframe so you will wait for the downtrend in 4 Hour chart.
Similarly, once you identified downtrend in daily, you will look for the uptrend in 4 Hour chart.
This is simply to look for proper entry along the trend.
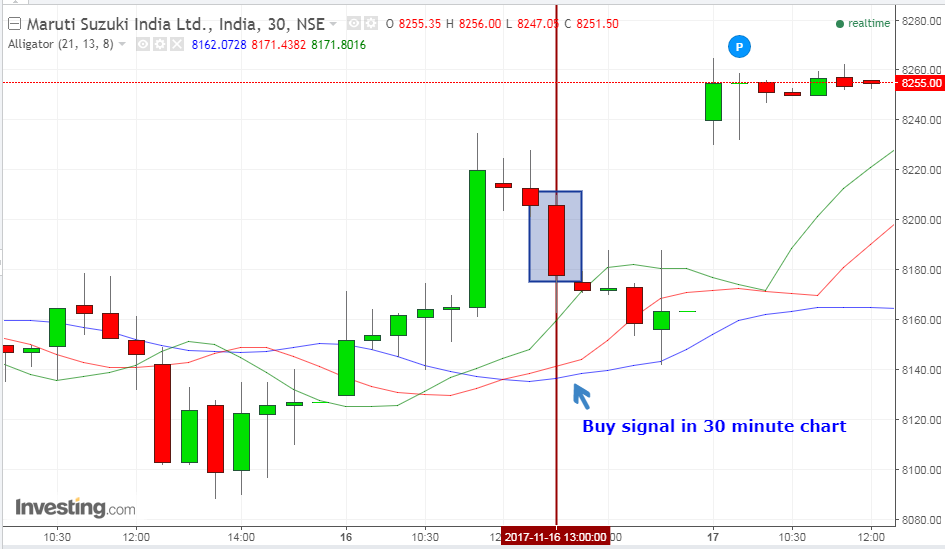
But as it bounced back in 4-hour chart, you will make your entry in the 30-minute chart when the alligator gives a positive or negative crossover as the case may be.
To simplify:
Upward in daily, Downward in 4-hourly, buy in 30 minutes chart
Downward in daily, Upward in 4-hourly, sell in 30 minutes chart
The same logic of multiple timeframes can be applied in various time frames including a very short- term to very long term.
Bottomline
You may combine Alligator indicator with a momentum-based indicator like CCI to enhance your trading experience and to get better trading signals.
Say when the alligator awakes and you found that CCI has already entered the overbought area (i.e. above +100) so its an early indication that the uptrend is likely to continue and with speed.
Like all the moving averages, the alligator is a lagging indicator.
Such a lag in getting a trade signal leads to a partial loss of profit.
Further, this lag functions as a filter and helps eliminate insignificant and false signals.


Good Info..
Hi there!
“The Alligator’s Jaw (Blue line) is a 13-period Smoothed Moving Average and shift by 8 bars into the future”
would you please help me out here how to perform shift by 8 bars into future??
I am really struck on my back testing using data in Excel.
Thank you.
Krishna.
Hi Krishna,
This strategy is already explained in the blog itself.
Thank you for Reading!
Keep Reading!
Nice very helpful blog
Hi,
Thank you for reading our blog!!
Keep Reading!