Elearnmarkets - Financial Market Learning
  • Courses
  • Webinars
  • Stories
  • Language
    • English
    • Hindi
    • Bengali
No Result
View All Result
Get Free Course
  • Basic Finance
  • Derivatives
    • Futures
    • Options
  • Financial Planning
  • Fundamental Analysis
  • Technical Analysis
  • Mutual Funds
  • Marketshala
  • Miscellaneous
Elearnmarkets - Learn Stock Market, trading, investing for Free
  • Courses
  • Webinars
  • Stories
  • Language
    • English
    • Hindi
    • Bengali
No Result
View All Result
Get Free Course
Elearnmarkets - Learn Stock Market, trading, investing for Free
No Result
View All Result
Home Fundamental Analysis
Factors that affect EBITDA and EBIT 1

Factors that affect EBITDA and EBIT

Elearnmarkets by Elearnmarkets
May 28, 2024
in Fundamental Analysis, Financial Statement Analysis
Reading Time: 6 mins read
0
4.9k
VIEWS
Share on FacebookShare on XShare on WhatsApp

The difference between EBITDA and EBIT is that Depreciation and Amortization have been added back to Earnings in EBITDA, while they are not backed out of EBIT. This guide on EBITDA and EBIT will explain everything you need to know!

A company while running its business needs to make some operating profits after meeting all its expenses. Operating profits are the ones which are left over after paying for the cost of making a product.

For example the raw material cost, the employee cost, the power and fuel cost, the new purchases and the other expenses. Thus these are known as operating costs. So whatever is left after subtracting these costs from Sales is known as EBITDA.

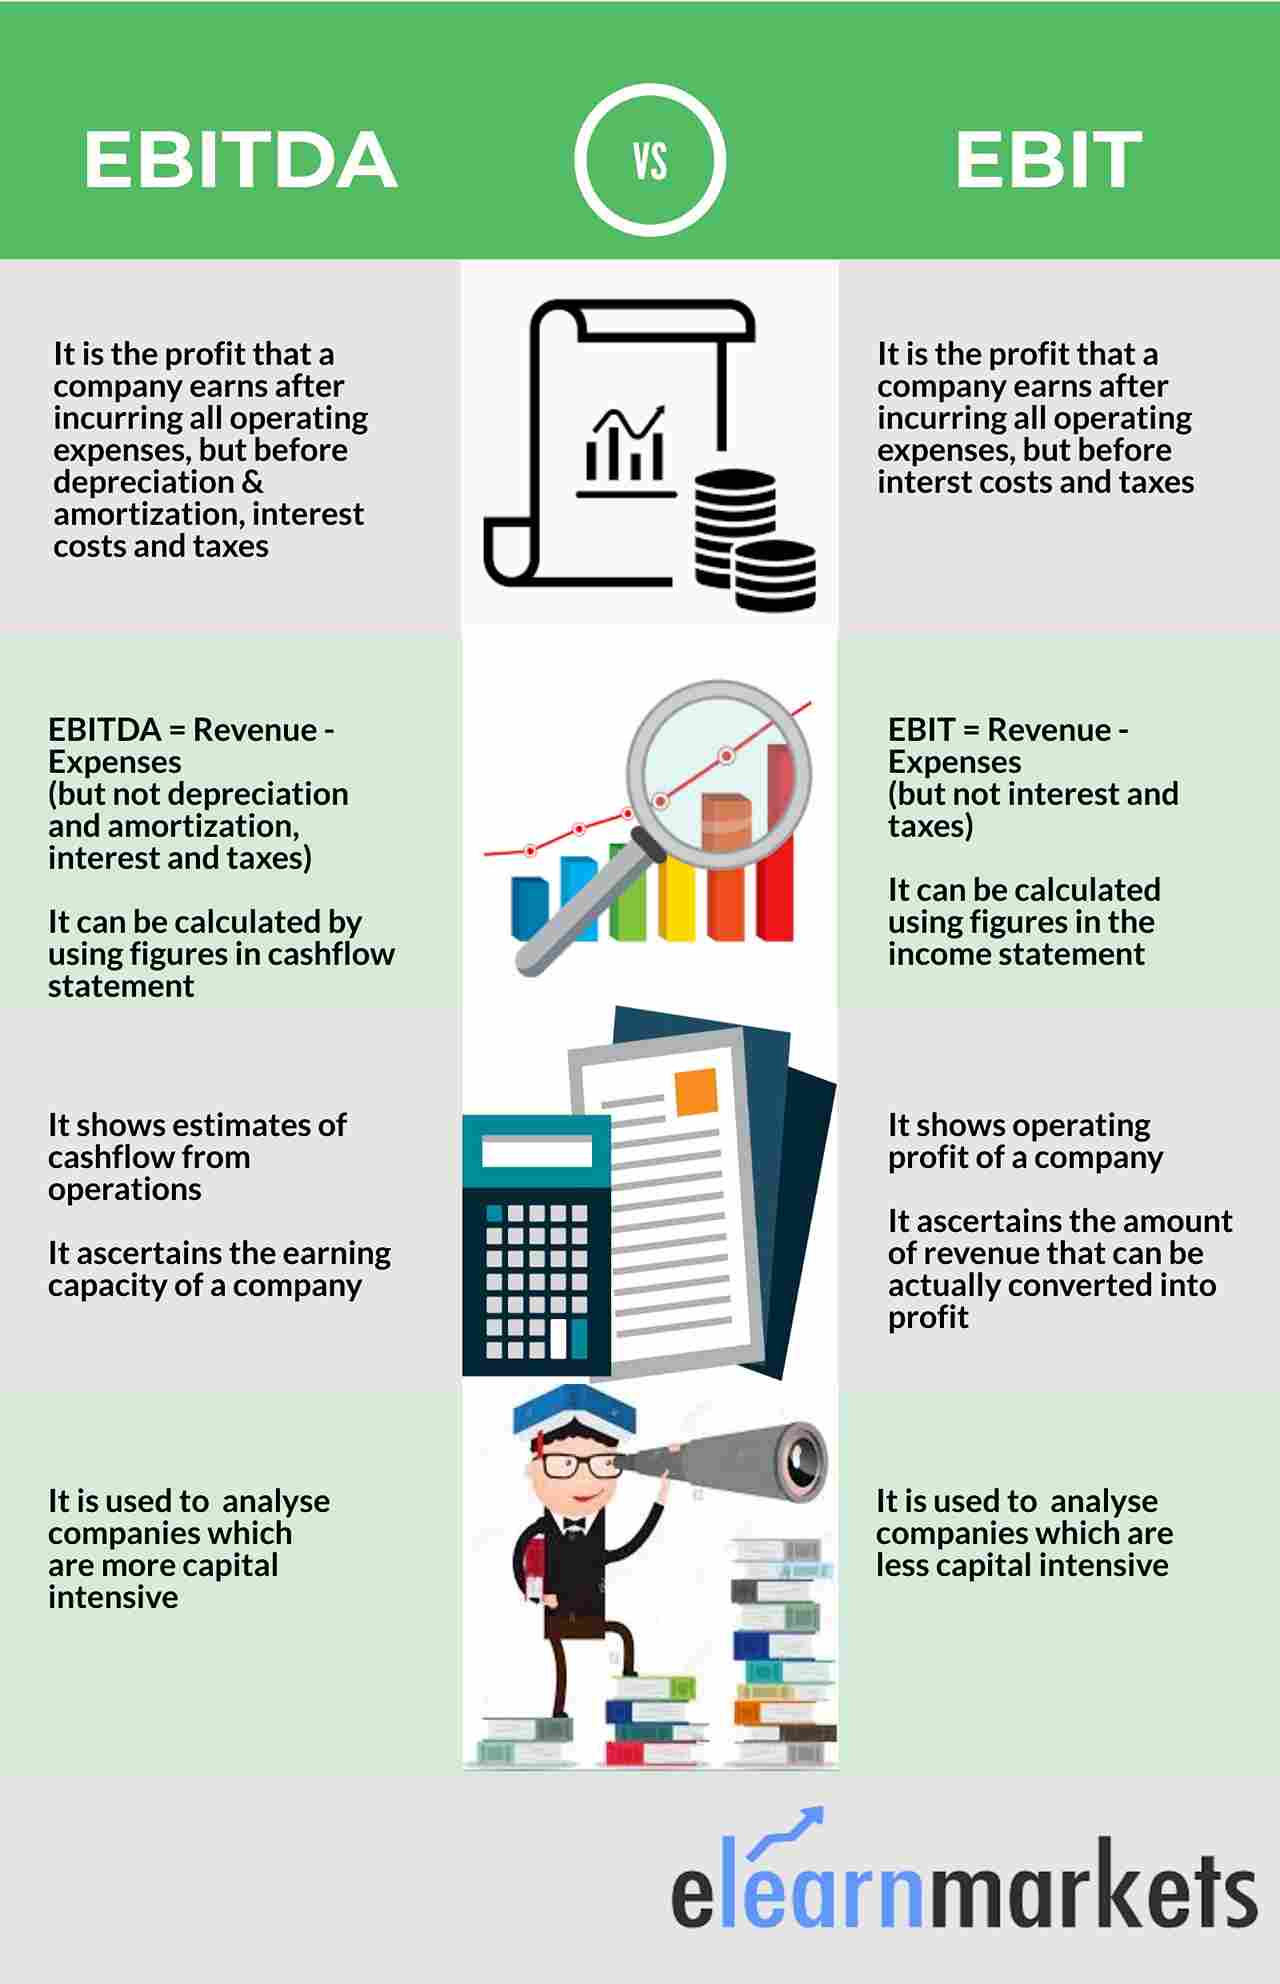
Thus EBITDA means Earnings before Interest, Tax, Depreciation and Amortization.

EBIT on the other hand takes into account the Depreciation and amortization and hence is also known as operating profits as it removes noncash items from its books which actually remains in the Balance Sheet. Thus the operating profits do not look inflated due to high depreciation or amortization.

EBIT means Earnings before Interest and Tax.

Table Of Contents
  • How is EBITDA and EBIT calculated?
  • What affects EBIT and EBIDTA?
  • How can EBITDA and EBIT rise?
  • Pros and cons of EBITDA
  • Pros and cons of EBIT
  • Key Takeaways

How is EBITDA and EBIT calculated?

 EBITDA and EBIT

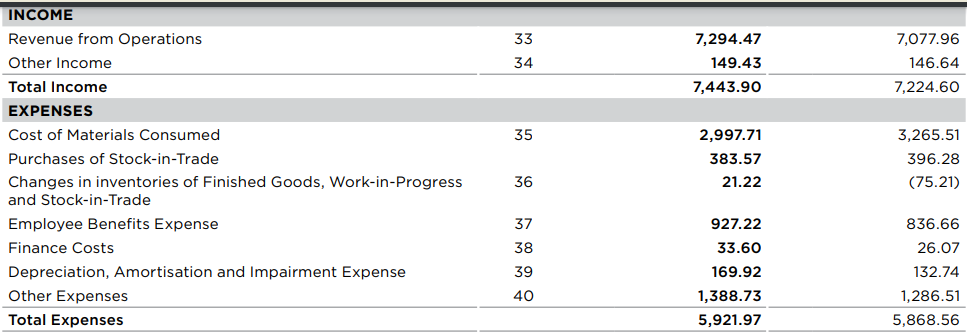
In this case the EBIDTA calculation goes like this

Revenue from Operations – Total Expenses + Finance Cost + Depreciation & Amortization + Taxes

Similarly EBIT calculation means

Revenue from Operations – Total Expenses + Finance Cost + Taxes

Even Income – operating expenses + Finance costs + Taxes gives us EBIT

Thus any company to be an Investment bet should have rising EBIT and EBITDA annually.

What affects EBITDA and EBIT?

Any increase in raw material costs Employee costs or other expenses or power and fuel expenses affect these metrics. Now any rise in these costs will affect EBITDA and EBIT adversely. EBIT means Earnings before Interest and Tax.

Factors that affect EBITDA and EBIT 2

Power and fuel expenses increase either due to increase in coal prices or the crude oil prices. Similarly raw material price increase affects the products market price and makes it difficult for some companies to pass it on to their consumers or to other businesses.

There are some other expenses which my rise due to advertisement or logistics cost increase or due to some increase in recurring expenses for the company. For example due to Covid there were major expenses related to hygiene and sanitation which was mandatory for the companies to follow to avert spread of Pandemic.

How can EBITDA and EBIT rise?

An increase in Sales and control on operating expenses through efficient management of the operating Business can drive EBITDA and EBIT growth. Other expenses should be carefully managed and monitored so that it does not increase in absurd percentages. In case of EBIT the depreciation and amortisation should be of lesser value. Depreciation of Infrastructure, Oil and Gas and Mining companies are very high thus they are valued using EBIT.

Pros and cons of EBITDA

EBITDA does not take into account any Capex by the company such as expansion or any purchase of Plant and Equipment. This is taken care of by Cash Flow. It also does not take into account high debt burden or Tax nor does it take into account any depreciation or amortization which is higher in case of Infra and Telecom stocks thus profits might not be correctly represented.

For example Future Retail had EBITDA growth but its depreciation and debt burden being high left it with no profits or cash flow.

EBITDA is normally used to interpret a firm’s solvency and its operating profits to undermine whether its business will be able to service its debt and Interest burden or not.

You can also read our latest article on Understanding Sector Funds and their Benefits to our Portfolio

Pros and cons of EBIT

EBIT is earnings before deduction of Interest or taxes. Thus companies having high interest burden like realty and Infra will show lower operating profits if valued using EBIT. Similarly companies having higher tax expenses like export oriented companies will show higher taxes compared to domestic companies operating in the same sector.

EBIT removes all non cash expenses which are incurred on property plant and equipment as depreciation and under Intangible assets as amortization. Thus it takes into account a portion of Capex.

Key Takeaways

  • A healthy EBIT should always be higher than net profits.
  • Both EBIT and EBITDA are the key ratios in determining the operational efficiency of a Business.
  • EBIT and EBIDTA margin decides the longevity of the operational efficiency of any business. Higher and growing margins depict strong business.
  • EBIT does not take into account non cash expenses whereas EBITDA takes into account noncash expenses.
  • Better cost synergies and higher revenues will always propel the growth in both EBIT and EBITDA.
  • Higher operating profits can only be driven if the business has a pricing power among its consumers.
  • If EBIT is lower than net profits than it means that the business is not being managed efficiently.
  • Both EBIT and EBITDA can be used to value the companies under same sector business.

Click here to know more about the Premium offering of StockEdge.

You can check out the desktop version of StockEdge using this link.

Tags: EBITEBITDAintermediate
ShareTweetSend
Get Kotak Offer Get Kotak Offer Get Kotak Offer
Previous Post

4 mistakes that Traders should avoid while Trading with Fibonacci

Next Post

How to do Trend Analysis?

Elearnmarkets

Elearnmarkets

Elearnmarkets (ELM) is a complete financial market portal where the market experts have taken the onus to spread financial education. ELM constantly experiments with new education methodologies and technologies to make financial education effective, affordable and accessible to all. You can connect with us on Twitter @elearnmarkets.

Related Posts

Top 5 Valuation Ratios in the Stock Market 3
Fundamental Analysis

Top 5 Valuation Ratios in the Stock Market

May 5, 2025
816
price to sales ratio
Fundamental Analysis

Price to Sales Ratio: A Key Metric for Understanding Company Value

May 5, 2025
441
Gearing Ratio
Fundamental Analysis

What Is the Gearing Ratio? Formula & Calculation

December 3, 2024
1.1k
Top 5 Fundamental Analysis Tools 4
Fundamental Analysis

Top 5 Fundamental Analysis Tools

January 31, 2025
4.1k

Leave a Reply Cancel reply

Your email address will not be published. Required fields are marked *

Disclaimer

Elearnmarkets (Kredent InfoEdge Pvt. Ltd.) is a SEBI-registered Research Analyst (RA) entity (SEBI Registration No.: INH300007493). The information provided in this article is for educational and informational purposes only and should not be considered as an offer to buy or sell any securities or investment products.

The stocks, securities, and investment instruments mentioned herein are not recommendations under SEBI (Research Analysts) Regulations, 2014. Readers are advised to conduct their own due diligence and seek independent financial advice before making any investment decisions.

Investments in securities markets are subject to market risks. Please read all related documents carefully before investing. Investing in Equity Shares,
Derivatives, Mutual Funds, or other instruments carry inherent risks, including potential loss of capital. Elearnmarkets (Kredent InfoEdge Pvt. Ltd.) does not provide any guarantee or assurance of returns on any investments. Past performance is not indicative of future performance.

Elearnmarkets Logo

Follow Us

Facebook-f X-twitter Instagram Linkedin-in Youtube Telegram

Register on Elearnmarkets

Continue your financial learning by creating your own account on Elearnmarkets.com

Register Free Account

Download App

Playstore logo
Download on app store

Categories

  • Basic Finance
  • Derivatives
  • Financial Planning
  • Fundamental Analysis
  • Technical Analysis
  • Mutual Funds
  • Miscellaneous

Popular On Elearnmarkets

  • Market Superheroes:
  • Vivek Bajaj
  • Chetan Panchamia
  • Ashish Kyal
  • Premal Parekh
  • Abhijit Paul
  • Jegan
  • Sivakumar Jayachadran
  • Jyoti Budhia
  • Vivek Gadodia
  • Vishal Mehta
  • Piyush Chaudhry
  • Santosh Pasi
  • Gomathi Shankar
  • Market Superheroes:
  • Vivek Bajaj
  • Chetan Panchamia
  • Ashish Kyal
  • Premal Parekh
  • Abhijit Paul
  • Jegan
  • Sivakumar Jayachadran
  • Jyoti Budhia
  • Vivek Gadodia
  • Vishal Mehta
  • Piyush Chaudhry
  • Santosh Pasi
  • Gomathi Shankar
  • Courses:​
  • Options Trading
  • Dow Theory
  • Momentum Trading
  • Stock Investing
  • Harmonic Chart Patterns
  • Algo Trading
  • Elliot Wave Theory
  • Advanced Excel
  • Cryptocurrency
  • NSE Certification Course
  • Courses:​
  • Options Trading
  • Dow Theory
  • Momentum Trading
  • Stock Investing
  • Harmonic Chart Patterns
  • Algo Trading
  • Elliot Wave Theory
  • Advanced Excel
  • Cryptocurrency
  • NSE Certification Course
  • Webinars:
  • Bank Nifty Scalping
  • Intraday Trading Strategies
  • Options Trading Strategies
  • Options selling
  • Price Action
  • Relative Strength
  • Tax Planning
  • Options Buying
  • Growth Stocks
  • Portfolio Management
  • Risk Management
  • Renko Charts
  • Crude Oil
  • Traders Psychology
  • Moving Average
  • Multibagger Stocks
  • Free Learning Modules:
  • Intraday Trading
  • Options Scalping
  • Swing Trading
  • Financial Modelling
  • RSI Indicator
  • Bollinger Bands
  • Pricing of Futures
  • Personal Finance
  • Initial Public Offerings (IPO)
  • Value Investing
  • Technical Indicators
  • Candlesticks
  • Chart Patterns
  • Option Greeks
  • ELSS Funds
  • Banking and Insurance
  • Real Estate
  • Gold
  • Book Summaries:
  • Rich Dad Poor Dad
  • Psychology of Money
  • The Intelligent Investor
  • The Richest Man in Babylon
  • Think and Trade Like a Champion
  • Value Investing and Behavioural Finance
  • Trading in the Zone
  • Learn to Earn
  • Book Summaries:
  • Rich Dad Poor Dad
  • Psychology of Money
  • The Intelligent Investor
  • The Richest Man in Babylon
  • Think and Trade Like a Champion
  • Value Investing and Behavioural Finance
  • Trading in the Zone
  • Learn to Earn
  • Tools:
  • CAGR Calculator
  • SIP Calculator
  • eLearnOptions
  • Future Value Calculator
  • Present Value Calculator
  • Atal Pension Yojana
  • Cost of Delay Calculator
  • Become a Crorepati
  • Tools:
  • CAGR Calculator
  • SIP Calculator
  • eLearnOptions
  • Future Value Calculator
  • Present Value Calculator
  • Atal Pension Yojana
  • Cost of Delay Calculator
  • Become a Crorepati

© 2025 Elearnmarkets. All Rights Reserved

  • Visit Elearnmarkets
  • Courses
  • Webinars
  • Financial Guides
  • Get Free Counselling
  • Visit Elearnmarkets
  • Courses
  • Webinars
  • Financial Guides
  • Get Free Counselling

Download Our App

No Result
View All Result
  • Article Categories
    • Basic Finance
    • Derivatives
    • Financial Planning
    • Fundamental Analysis
    • Technical Analysis
    • ETFs & Mutual Funds
    • Marketshala
    • Miscellaneous
  • Language
    • Hindi
    • Bengali
    • English
  • Courses
  • Webinars
  • Stories
Get Free Course

© 2024 Elearnmarkets All Rights Reserved

Guide to Basics of Stock Investing
Learn to interpret the financial performance and health of a company.
Download Guide For FREE
Infinity Plan
Trading Day 2025