
Double Top Pattern and Double Bottom Patterns are types of price reversal patterns. These reversal chart patterns take a longer period to be formed. The recent market movements also highlight the importance of recognizing technical patterns for traders. One such formation to watch is the W pattern, often referred to as a W pattern breakout when it completes. This bullish reversal pattern typically indicates a shift from a downtrend to an uptrend, providing potential buying opportunities. Traders often analyze the W pattern trading strategy to identify breakout points and set profit targets. Understanding these patterns can be beneficial in navigating market uncertainties, especially when combined with other technical indicators.
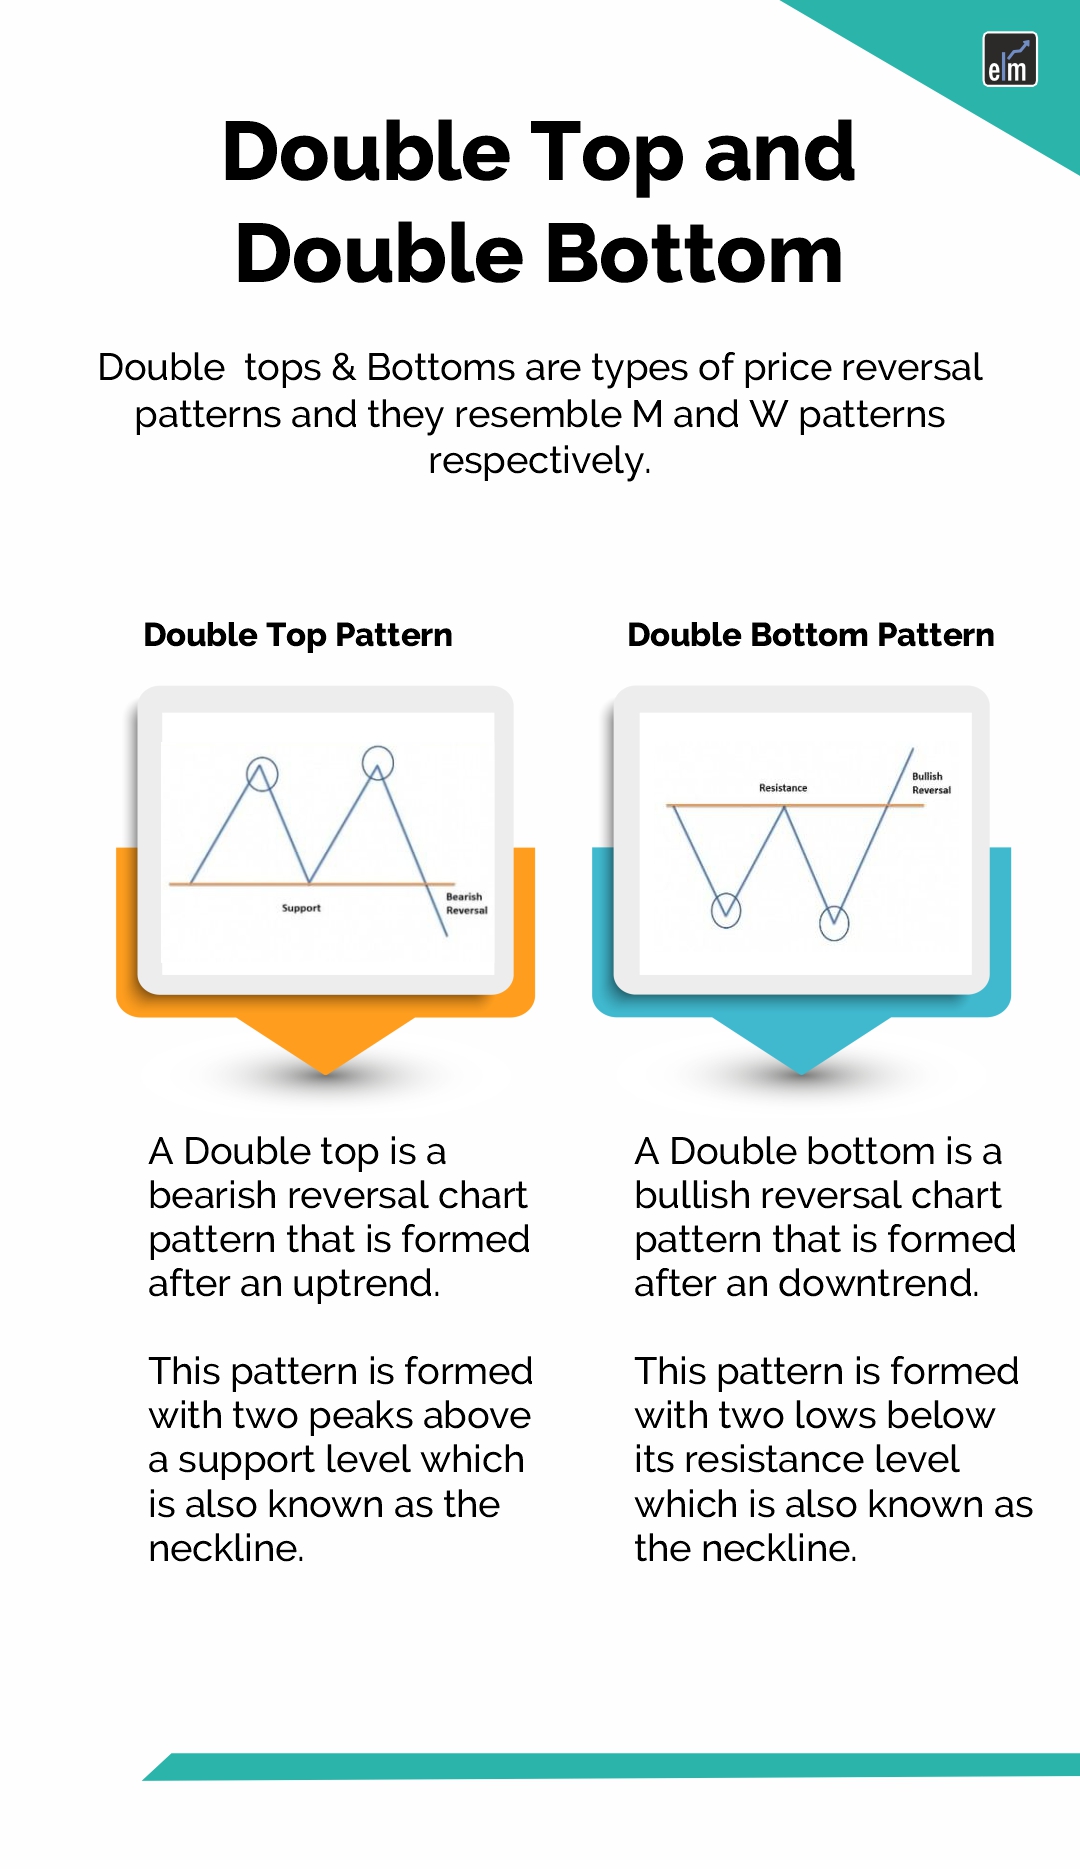
Double Top resembles the M pattern and indicates a bearish reversal whereas Double Bottom resembles the W pattern and indicates a bullish reversal.
The Double Top and Double Bottom chart patterns are usually formed after consecutive rounding tops and bottoms. Let us discuss in detail the psychology behind the formation of these reversal chart patterns and how to trade with them.
Table of Contents
What is a double-top pattern?
A double-top pattern is a bearish reversal chart pattern that is formed after an uptrend. This double top pattern is formed with two peaks above a support level which is also known as the neckline.
The first peak is formed after a strong uptrend and then retraces back to the neckline. After reaching back to its neckline, the price becomes bullish and rises again to form the second peak.
The formation of this pattern is completed when the prices move back to the neckline after forming the second peak. When the prices break through the neckline or the support level, then the bearish trend reversal is confirmed.
What is a Double Bottom Pattern?
A double-bottom chart pattern is a bullish reversal chart pattern that is formed after the downtrend. This pattern is formed with two lows below its resistance level, which is also known as the neckline.
The first low is formed after a strong downtrend and then the prices retrace back to the neckline. After reaching back to its neckline, the price becomes bearish and falls again to form the second low.
The formation of this pattern is completed when the prices move back to the neckline after forming the second low. When the prices break through the neckline or the resistance level then the bullish trend reversal is confirmed and traders can enter a long position.
Formation of Double Top and Double Bottom Pattern
Here is how the double top pattern and double bottom chart pattern are formed –
What do Double Tops and Double Bottoms tell traders?
A double top and double bottom chart pattern for traders indicates possible trend reversal to the traders.
Like other technical indicators and chart patterns, the double top and double bottom patterns do not indicate certain trend reversals. Traders should always use the chart patterns with other indicators such as volume for confirming the reversal before taking a position.
Trading with Double Top Pattern
There are certain rules when trading with Double Top chart patterns.
- Firstly, one should see the market phase, whether it is up or down. As the double top is formed at the end of an uptrend, the prior trend should be an uptrend.
- Traders should spot if two rounding tops are forming and also note the size of the tops.
- Traders should only enter the short position when the price breaks out from the support level or the neckline.
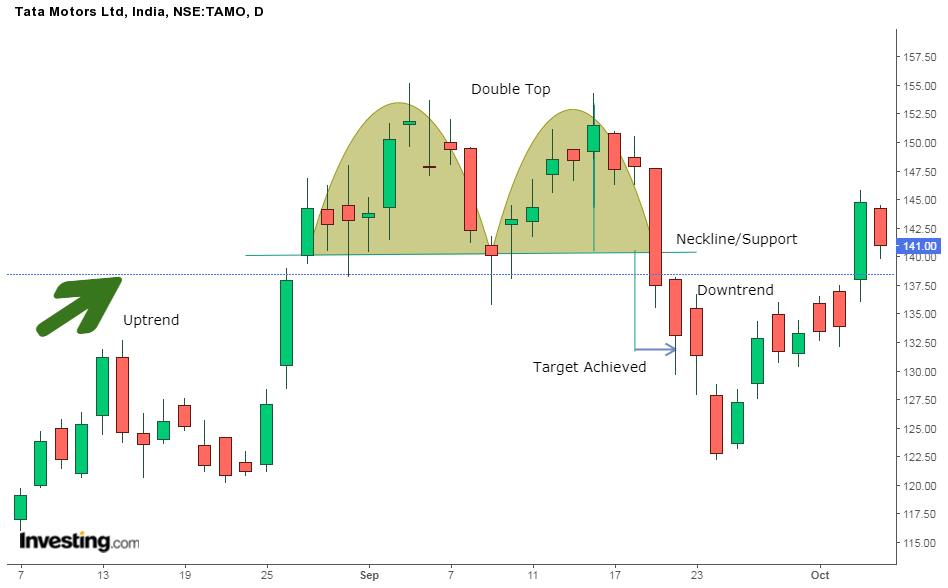
Example
From the below example of the daily chart of Tata Motors Ltd. we can see how a bearish reversal takes place after the formation of the double top at the end of an uptrend:
Stop Loss
In the case of a Double Top chart pattern, the stop loss should be placed at the second top of the pattern.

Price Target
The price target should be equal to the distance between the neckline and the tops.
Trading with Double Bottom
There are certain rules when trading with double-bottom chart patterns.
- Firstly, one should see the market phase, whether it is up or down. As the double bottom is formed at the end of the downtrend, the prior trend should be the downtrend.
- Traders should spot if two rounding bottoms are forming and also note the size of the bottoms.
- Traders should only enter the long position when the price breaks out from the resistance level or the neckline.
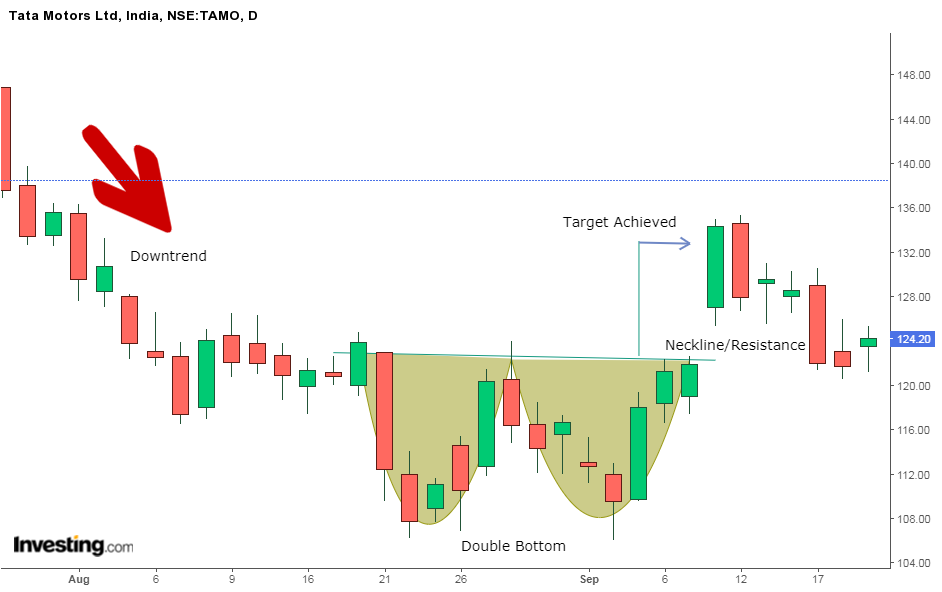
Example
From the below example of the daily chart of Tata Motors Ltd. we can see how a bullish reversal takes place after the formation of the double bottom at the end of the downtrend:
Stop Loss
In the case of the double-bottom chart pattern, the stop loss should be placed at the second bottom of the pattern.
Price Target
The price target should be equal to the distance between the neckline and the bottoms.
How do filter Stocks using a Double Top and Double Bottom Screener?
There are so many stocks in which this chart pattern is formed, and it is difficult for traders to look at the charts of more than 500 stocks to find this pattern.
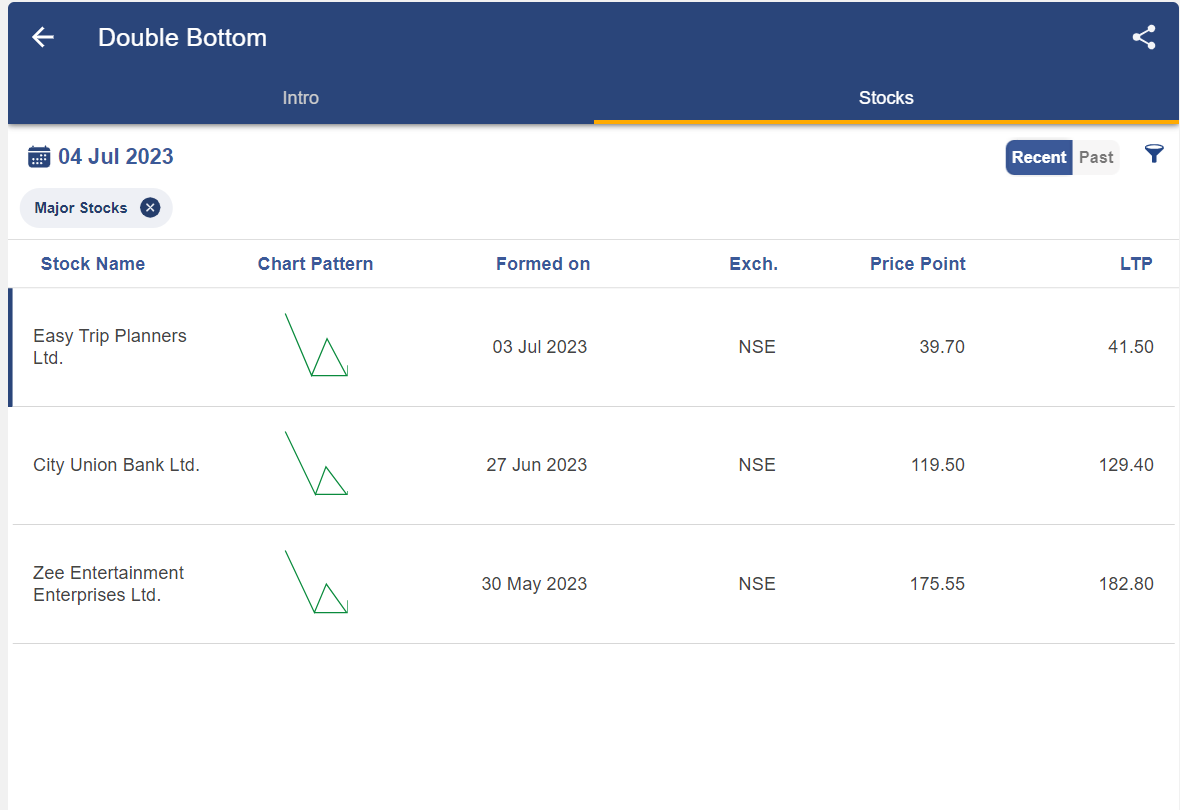
So, with the help of StockEdge, one can filter out stocks in which the double top and double bottom pattern are formed:
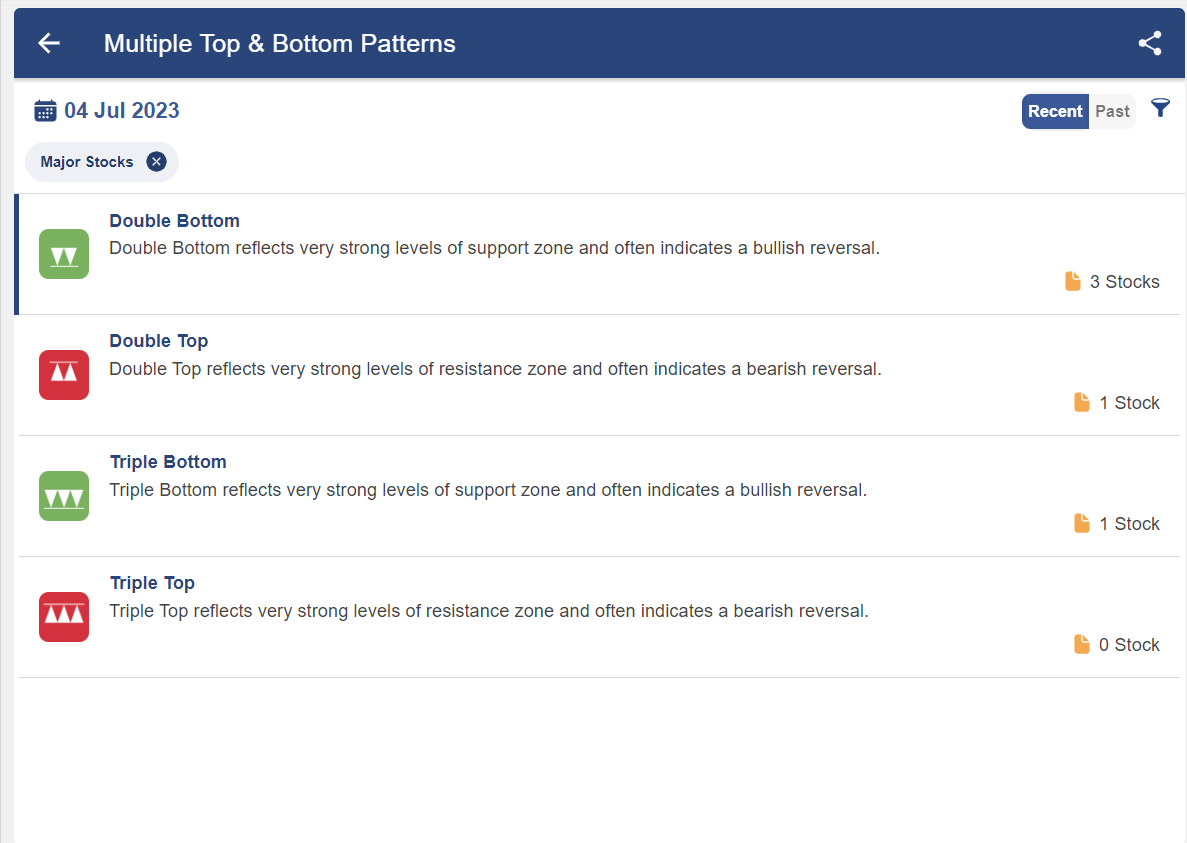
After clicking on the double top or double bottom, you will get a list of stocks in which this pattern is formed:
After clicking on any of the above stocks, you will get a technical chart showing the pattern as below:
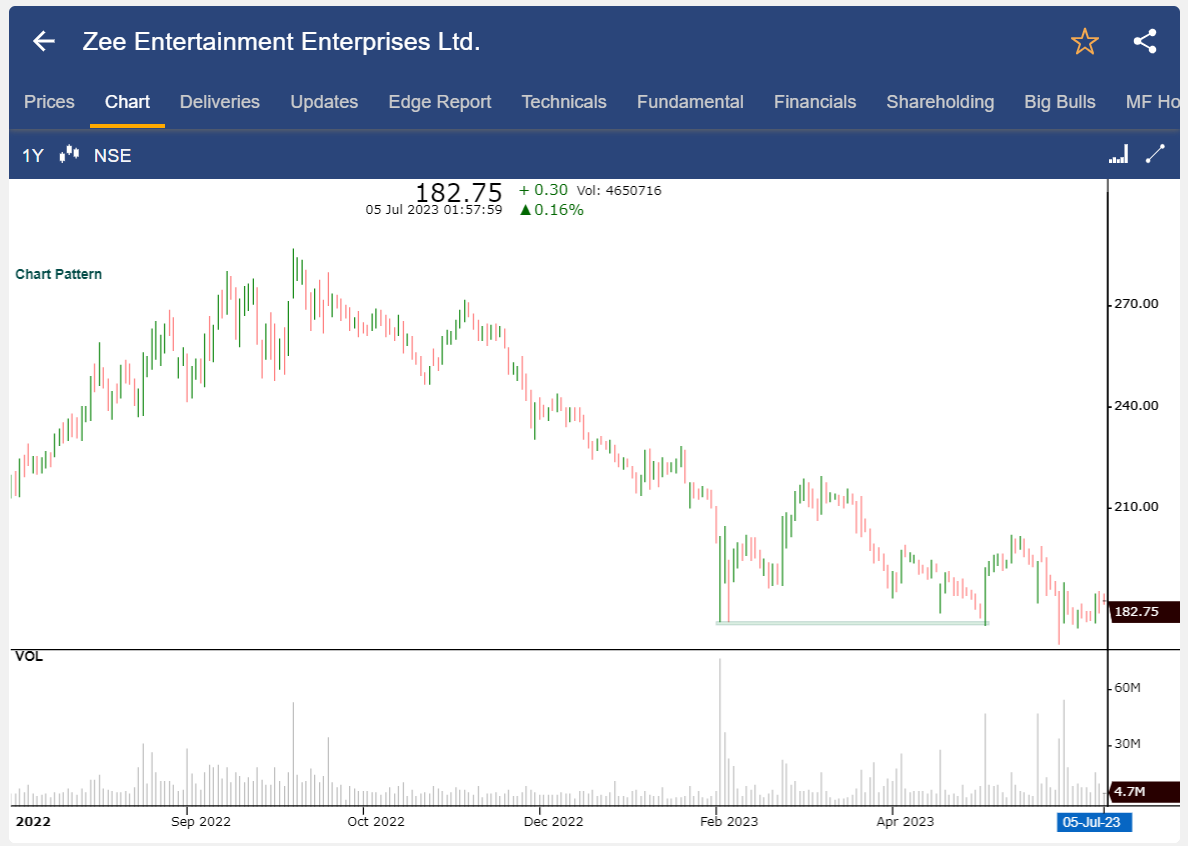
Once you have identified this chart pattern in the stocks, you can trade accordingly, as discussed above.
Bottomline
Double top and bottom formations are highly effective when identified correctly. However, they can be extremely detrimental when they are interpreted incorrectly. Therefore, one must be extremely careful and patient before jumping to conclusions.
Frequently Asked Questions (FAQs)
What is the double top and double bottom strategy?
The double bottom pattern is a bullish reversal pattern, which indicates that the downward trend is about to reverse, whereas the double top pattern is a bearish reversal pattern, which indicates that the upward trend is about to reverse. Rounding tops and bottoms that follow each other provide double top and bottom patterns.
Is a double bottom pattern bullish or bearish?
The double bottom pattern is bullish. A potential trend transition from a downtrend to an uptrend is indicated by the bullish pattern on the chart.
Is a double top bullish or bearish?
The double top pattern is bearish. A potential trend transition from an uptrend to a downtrend is indicated by the bearish pattern on the chart.
What is the win rate of double top and double bottom?
(78.55%) – One of the most frequent patterns for price reversals is the double top/bottom. A double bottom is formed by two nearly equal lows, whereas a double top is defined by two nearly equal highs with some space between the touches.


