Elearnmarkets - Financial Market Learning
  • Categories
    • Basic Finance
    • Derivatives
      • Futures
      • Options
    • Financial Planning
    • Fundamental Analysis
    • Technical Analysis
    • Marketshala
    • Miscellaneous
  • Language
    • English
    • Hindi
    • Bengali
No Result
View All Result
  • Courses
  • Webinars
  • Stories
Elearnmarkets - Learn Stock Market, trading, investing for Free
No Result
View All Result
Home Technical Analysis Charts, Patterns & Indicators
How to trade with Dark Cloud Cover: Candlestick Pattern 1

How to trade with Dark Cloud Cover: Candlestick Pattern

Elearnmarkets by Elearnmarkets
September 22, 2022
in Charts, Patterns & Indicators, Technical Analysis
Reading Time: 8 mins read
8
13k
VIEWS
Share on FacebookShare on XShare on WhatsApp

Hindi: आप इस लेख को हिंदी में भी पढ़ सकते है|

Dark Cloud Cover is a bearish reversal candlestick pattern that is formed at the end of an uptrend.

It signals potential weakness in the uptrend.

It is made of two candlesticks. The first candlestick is a bullish candlestick and the second one is a bearish candlestick.

The second candlestick is a bearish candlestick that signals reversal and the uptrend’s end.

This candlestick pattern is similar to the piercing pattern.

The only difference is that piercing pattern occurs at the end of the downtrend, whereas dark cloud cover occurs at the end of an uptrend.

Let us discuss how to trade with dark cloud cover in detail:

Table Of Contents
  1. What is a Dark Cloud Cover?
  2. Formation of Dark Cloud Cover:
  3. How to use Dark Cloud Cover:
  4. Importance of Dark Cloud Cover in Trading:
    • How do I identify a dark cloud cover candlestick pattern?
    • Is dark cloud cover a bearish candlestick?
    • How to trade using dark cloud cover pattern?
  5. Key Takeaways:

What is a Dark Cloud Cover?

The Dark Cloud Cover pattern includes a large black candle forming a “dark cloud” over the previous day’s candle.

The buyers push the price higher at the open, but then the sellers take over later in the session and push the prices down.

This shift from buying to selling signals that a price reversal to the downside could be forthcoming.

Most traders consider the Dark Cloud Cover pattern useful only when it occurs at the end of an uptrend

As the prices rise, the pattern becomes more important for the reversal to the downside.

If the price action is choppy then the pattern is less significant as the price remains choppy after this pattern.

Formation of Dark Cloud Cover:

The dark cloud cover pattern involves a large bearish candle after a bullish trend. This large bearish candle forms a dark cloud over the previous day’s candle.

RelatedPosts

5 Tools to Spot Trend Reversals in Stocks 3

5 Tools to Spot Trend Reversals in Stocks

September 28, 2023
6.5k
Beginner's Guide to Trading Penny Stocks 4

Beginner’s Guide to Trading Penny Stocks

September 26, 2023
2k
5 Important Volatility Indicators that Traders should know 5

5 Important Volatility Indicators that Traders should know

September 19, 2023
58.5k

We can see how this pattern is formed from the image below:

Dark cloud cover pattern

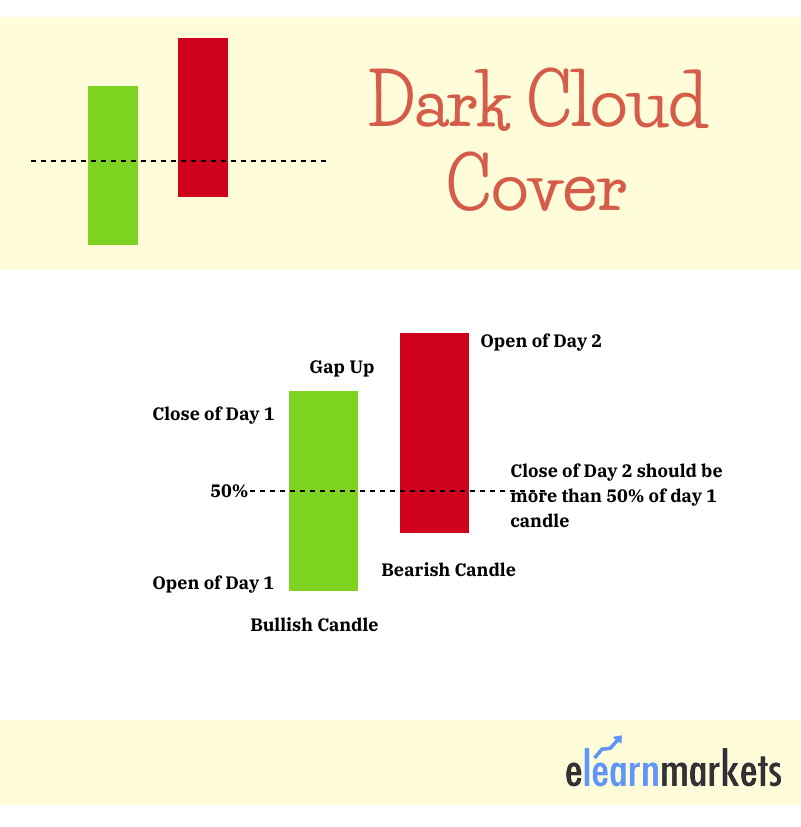
It starts with a bullish candle in an uptrend, followed by a gap up the next day.

The candlestick of the next day turns to be a bearish candle. The close of this bearish candle is below the midpoint of the previous day candle.

The bullish and bearish candlesticks in this candlestick pattern have large real bodies with very short or no shadows.

The formation of this pattern is confirmed by the form of a bearish candle at the end of this pattern.

How to use Dark Cloud Cover:

Investors must look at a few characteristics when they trade with the dark cloud cover pattern:

  • Firstly, the trend should be an uptrend, as the dark cloud cover pattern is a bearish reversal pattern.
  • Secondly, the length of the candlestick plays an important role in determining the force with which the reversal will take place.
  • The gap up between the bullish and bearish candlesticks indicates how powerful the trend reversal will be.
  • Fourthly, the bearish candlestick should close more than the midpoint of the previous bullish candlestick.
  • Lastly, the bullish, as well as the bearish candlestick, should have larger bodies.

To know about other candlesticks, read our blog on All 35 Candlestick Chart Patterns in the Stock Market-Explained

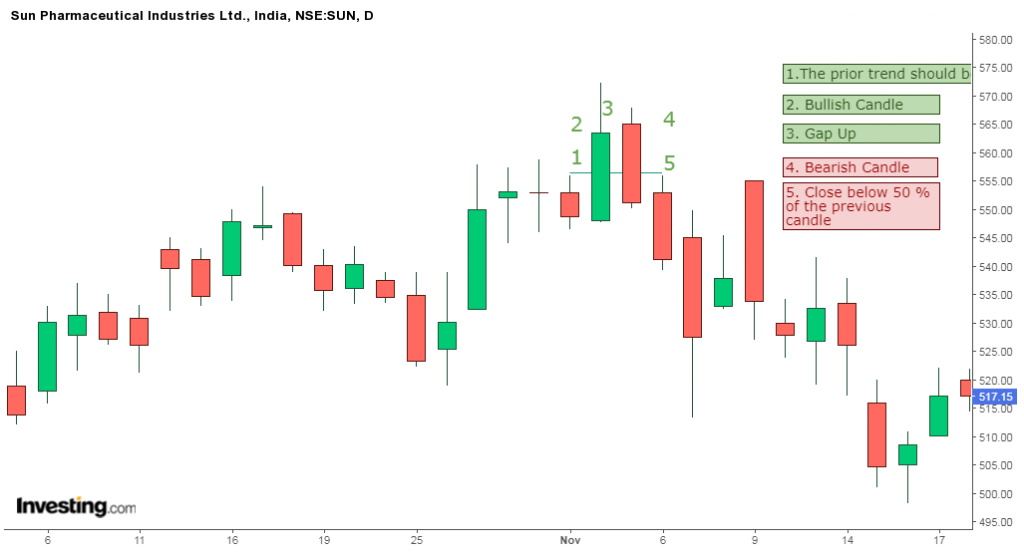
Below is an example of the piercing pattern in the daily chart of Sun Pharmaceutical Industries Ltd.

How to trade with Dark Cloud Cover: Candlestick Pattern 2

Importance of Dark Cloud Cover in Trading:

The traders find this pattern important as it signals the reversal of the uptrend into a downtrend.

One should look at the daily charts for this pattern as this pattern is less significant in the lesser time-frame charts.

Another reason why the traders like to trade with this pattern is that this pattern occurs near the resistance level.

Also if the volume is high during the formation of this candle, there are more chances of the reversal to take place.

Also, don’t forget to confirm the signals given by this pattern with other technical indicators.

You can also use technical scans to filter out stocks for trading the next day by using StockEdge App, now also available in the web version.

Frequently Asked Questions

How do I identify a dark cloud cover candlestick pattern?

One can identify a dark cloud cover candlestick pattern when a large black candle forms a “dark cloud” over the previous day’s candle.

Is dark cloud cover a bearish candlestick?

Dark Cloud Cover is a bearish reversal candlestick pattern that is formed at the end of an uptrend. It signals potential weakness in the uptrend.

How to trade using dark cloud cover pattern?

Investors must look at a few characteristics when they trade with the dark cloud cover pattern:
1. Firstly, the trend should be an uptrend, as the dark cloud cover pattern is a bearish reversal pattern.
2. Secondly, the length of the candlestick plays an important role in determining the force with which the reversal will take place.
3. The gap up between the bullish and bearish candlesticks indicates how powerful the trend reversal will be.
4. Fourthly, the bearish candlestick should close more than the midpoint of the previous bullish candlestick.
5. Lastly, the bullish, as well as the bearish candlestick, should have larger bodies.

Key Takeaways:

  • Dark Cloud Cover is a bearish reversal candlestick pattern that is formed at the end of an uptrend.
  • It is made of two candlesticks. The first candlestick is a bullish candlestick and the second one is a bearish candlestick.
  • The traders find this pattern important as it signals the reversal of uptrend into a downtrend.
  • If the volume is high during the formation of this candle, there are more chances of the reversal to take place.
  • Also, don’t forget to confirm the signals given by this pattern with other technical indicators.

Did you find this candlestick chart pattern useful? Tell us by commenting below.

Happy Learning!

Tags: candlestick patternchart patterndark cloud coverenglishtechnical analysistechnical basics
Share2TweetSend
Get Kotak Offer Get Kotak Offer Get Kotak Offer
Previous Post

All that you wanted to know about Calculation of Intrinsic Value

Next Post

স্টক মার্কেটের ওপর (Covid-19) নভেল করোনা ভাইরাসের প্রভাব

Elearnmarkets

Elearnmarkets

Elearnmarkets (ELM) is a complete financial market portal where the market experts have taken the onus to spread financial education. ELM constantly experiments with new education methodologies and technologies to make financial education effective, affordable and accessible to all. You can connect with us on Twitter @elearnmarkets.

Related Posts

5 Tools to Spot Trend Reversals in Stocks 6
Technical Analysis

5 Tools to Spot Trend Reversals in Stocks

September 28, 2023
6.5k
Beginner's Guide to Trading Penny Stocks 7
Technical Analysis

Beginner’s Guide to Trading Penny Stocks

September 26, 2023
2k
5 Important Volatility Indicators that Traders should know 8
Technical Analysis

5 Important Volatility Indicators that Traders should know

September 19, 2023
58.5k
Top 5 Momentum Indicators that Analyses Trend Strength 9
Technical Analysis

Top 5 Momentum Indicators that Analyses Trend Strength

September 7, 2023
94.5k

Comments 8

  1. Dinesh shah says:
    3 years ago

    Nicely explained

    Reply
    • Sakshi Agarwal says:
      3 years ago

      Hi,

      Thank you for reading our blog!

      Keep Reading!

      Reply
  2. Pandurang Raje says:
    3 years ago

    great its helpful

    Reply
    • Sakshi Agarwal says:
      3 years ago

      Hi,

      Thank you for reading our blog!

      Keep Reading!

      Reply
  3. dev raj dev says:
    2 years ago

    lucid and clear explanation. short and clear

    Reply
    • Sakshi Agarwal says:
      2 years ago

      Hi,

      We are glad that you liked our post, you can read more blogs on Technical Analysis from here.

      Thank you for Reading!

      Reply
  4. Tina says:
    2 years ago

    This is extremely helpful. Thank you so much!

    Reply
    • Sakshi Agarwal says:
      2 years ago

      Hi,

      We really appreciated that you liked our blog!

      Thank you for Reading!

      Keep Reading!

      Reply

Leave a Reply Cancel reply

Your email address will not be published. Required fields are marked *

Elearnmarkets Logo

Follow Us

Facebook-f Twitter Instagram Linkedin-in Youtube Telegram

Register on Elearnmarkets

Continue your financial learning by creating your own account on Elearnmarkets.com

Register Free Account

Download App

Playstore logo
Download on app store

Categories

  • Basic Finance
  • Derivatives
  • Financial Planning
  • Fundamental Analysis
  • Technical Analysis
  • Marketshala
  • Miscellaneous

Popular On Elearnmarkets

  • Market Superheroes:
  • Vivek Bajaj
  • Chetan Panchamia
  • Ashish Kyal
  • Premal Parekh
  • Abhijit Paul
  • Jegan
  • Sivakumar Jayachadran
  • Vishal Malkan
  • Jyoti Budhia
  • Vivek Gadodia
  • Vishal Mehta
  • Piyush Chaudhry
  • Santosh Pasi
  • Gomathi Shankar
  • Market Superheroes:
  • Vivek Bajaj
  • Chetan Panchamia
  • Ashish Kyal
  • Premal Parekh
  • Abhijit Paul
  • Jegan
  • Sivakumar Jayachadran
  • Vishal Malkan
  • Jyoti Budhia
  • Vivek Gadodia
  • Vishal Mehta
  • Piyush Chaudhry
  • Santosh Pasi
  • Gomathi Shankar
  • Courses:​
  • Options Trading
  • Dow Theory
  • Momentum Trading
  • Stock Investing
  • Stock Market for Beginners
  • Harmonic Chart Patterns
  • Algo Trading
  • Elliot Wave Theory
  • Advanced Excel
  • Cryptocurrency
  • NSE Certification Course
  • Courses:​
  • Options Trading
  • Dow Theory
  • Momentum Trading
  • Stock Investing
  • Stock Market for Beginners
  • Harmonic Chart Patterns
  • Algo Trading
  • Elliot Wave Theory
  • Advanced Excel
  • Cryptocurrency
  • NSE Certification Course
  • Webinars:
  • Bank Nifty Scalping
  • Intraday Trading Strategies
  • Options Trading Strategies
  • Options selling
  • Price Action
  • Relative Strength
  • Tax Planning
  • Options Buying
  • Growth Stocks
  • Portfolio Management
  • Relative Strength Index
  • Risk Management
  • Renko Charts
  • Crude Oil
  • Traders Psychology
  • Moving Average
  • Multibagger Stocks
  • Free Learning Modules:
  • Intraday Trading
  • Options Scalping
  • Swing Trading
  • Financial Modelling
  • RSI Indicator
  • Bollinger Bands
  • Pricing of Futures
  • Personal Finance
  • Initial Public Offerings (IPO)
  • Value Investing
  • Technical Indicators
  • Candlesticks
  • Chart Patterns
  • Option Greeks
  • ELSS Funds
  • Banking and Insurance
  • Real Estate
  • Gold
  • Book Summaries:
  • Rich Dad Poor Dad
  • Psychology of Money
  • The Intelligent Investor
  • The Richest Man in Babylon
  • Think and Trade Like a Champion
  • Value Investing and Behavioural Finance
  • Trading in the Zone
  • Learn to Earn
  • Book Summaries:
  • Rich Dad Poor Dad
  • Psychology of Money
  • The Intelligent Investor
  • The Richest Man in Babylon
  • Think and Trade Like a Champion
  • Value Investing and Behavioural Finance
  • Trading in the Zone
  • Learn to Earn
  • Tools:
  • CAGR Calculator
  • SIP Calculator
  • eLearnOptions
  • Future Value Calculator
  • Present Value Calculator
  • Atal Pension Yojana
  • Cost of Delay Calculator
  • Become a Crorepati
  • Tools:
  • CAGR Calculator
  • SIP Calculator
  • eLearnOptions
  • Future Value Calculator
  • Present Value Calculator
  • Atal Pension Yojana
  • Cost of Delay Calculator
  • Become a Crorepati

© 2023 Elearnmarkets. All Rights Reserved

  • Visit Elearnmarkets
  • Courses
  • Webinars
  • Financial Guides
  • Get Free Counselling
  • Visit Elearnmarkets
  • Courses
  • Webinars
  • Financial Guides
  • Get Free Counselling

Get Elearnmarkets App

No Result
View All Result
  • Article Categories
    • Basic Finance
    • Derivatives
    • Financial Planning
    • Fundamental Analysis
    • Technical Analysis
    • Marketshala
    • Miscellaneous
  • Language
    • Hindi
    • Bengali
    • English
  • Courses
  • Webinars
  • Stories

© 2020 Elearnmarkets All Rights Reserved

A Handbook of Technical Analysis
To start your trading journey as a seasoned technical analyst
Download Now
View Details
View Course Details
Guidebook On Chart Patterns
Take Your Trading To The Next Level With Strategies Shared In This Ebook
Download Now