
Making money in the market is not an easy job, especially on a daily basis. Long-term investments make sure that short term fluctuations don’t affect returns. However, being able to tap the short term fluctuations correctly is the biggest challenge.
Timing the entry and exit accurately is not everyone’s cup of tea. In such a case, technical charts on best charting websites can be seen as your only friend, which can help you get nearly the best entry and exit points.
In this topic, we are going to discuss about the free best charting websites available to be accessed by Indian equity and commodity market participants. These Indian stock market best websites can also help you identify stocks that can be invested in for a long period of time.
1. NSE India & BSE India
The national stock exchange (NSE India) and Bombay stock exchange (BSE India) is the mother of all charting websites. It’s the most followed and oldest financial website. NSE has a benchmark index of Nifty while BSE has a benchmark index of Sensex. The site provides real-time stock data. The number of listed companies on NSE and BSE is 1696 and 5749 respectively.
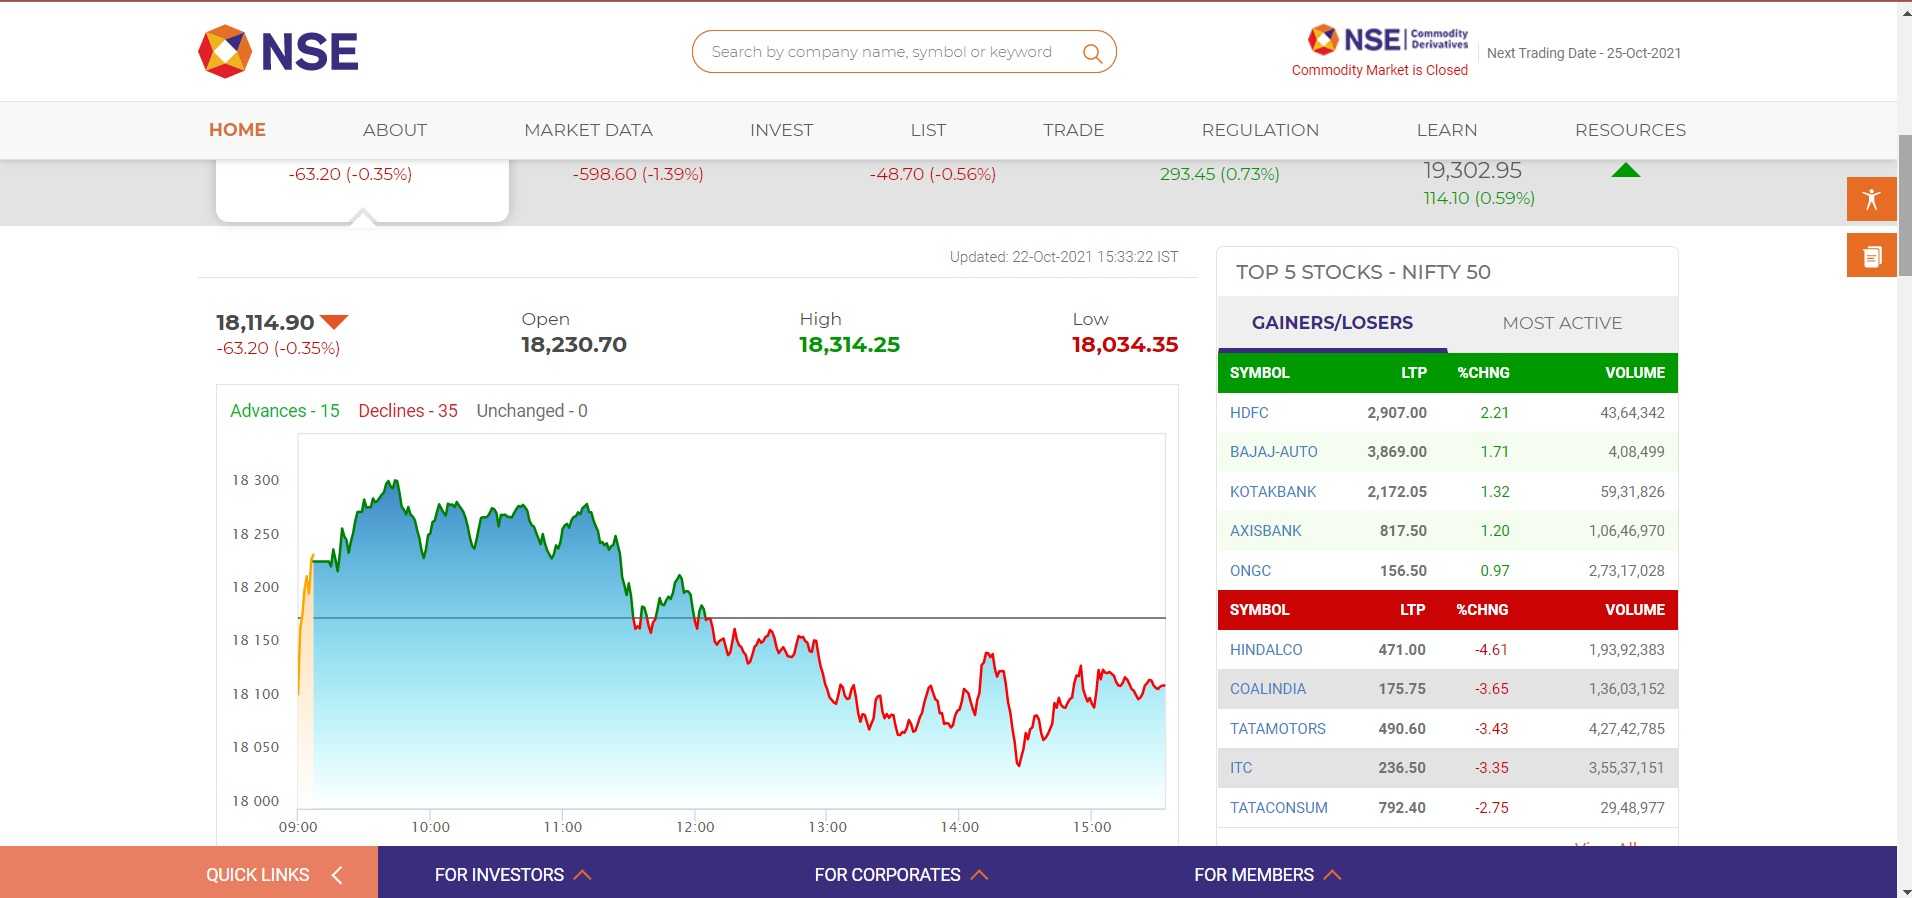
For charting websites compared to NSE, BSE has an edge over it. NSE only provides a line chart with no other indicators, which makes it difficult to read. On the other hand, BSE has a decent charting platform that is very easy to read and is also customizable. They also carry a small chart on their home page which gives a quick representation of the Indian market.
Learn to trade with Technical Trading Made Easy course by Market Experts
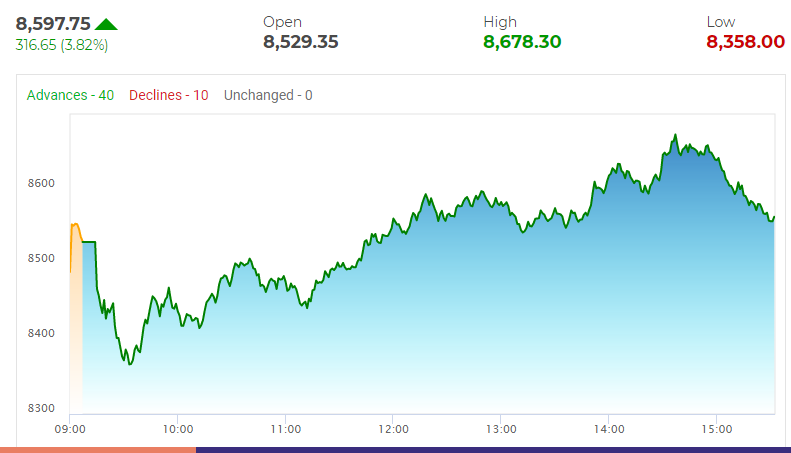
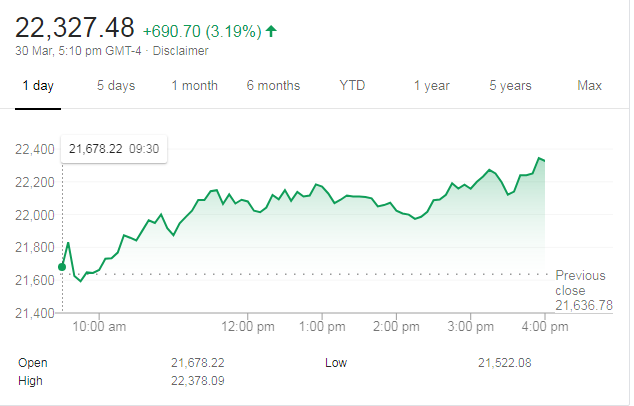
2. Google Finance
This is another most followed financial website, with over 40+ million daily users. Google Finance provides news based content and also carries real-time stock data. This site also comes in the list of the top 15 most popular financial sites in the world along with Yahoo Finance. Google sheets can be used to automate data of stocks directly from Google Finance, on a real-time basis.
Examples of a few formulas:
- Updating the open price of NIFTY:- =GOOGLEFINANCE(“NSE:NIFTY”, “priceopen”)
- Updating the current price of NIFTY :- =GOOGLEFINANCE(“NSE:NIFTY”, “price”)
These formulae are available online.
Charting platform of this site is quite good; it contains some useful indicators which a user can apply as per his/her need. The site also has a mobile version which helps us to get quick information on-the-go.
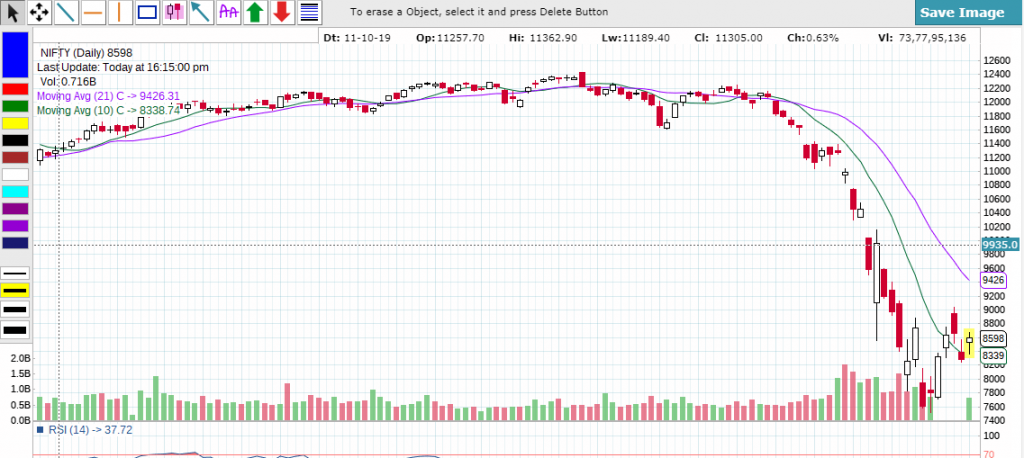
3. Tradingview Charting Websites
This is one of the best charting websites which is most favourite among the traders. The website is developed and controlled by Tradingview.inc. Though it is not an Indian website, trading view consists of an entirely different section for the Indian market.
You will also find the current situation of the global market on its home page. It really helps you to understand the real-time situation of the market which makes you a wise decision-maker while trading.
The website has innumerable features in the field of charting which are extremely helpful. Apply indicators, tools and drawing elements as per the requirement, it helps to understand the market or the scenario of the situation in more detail.
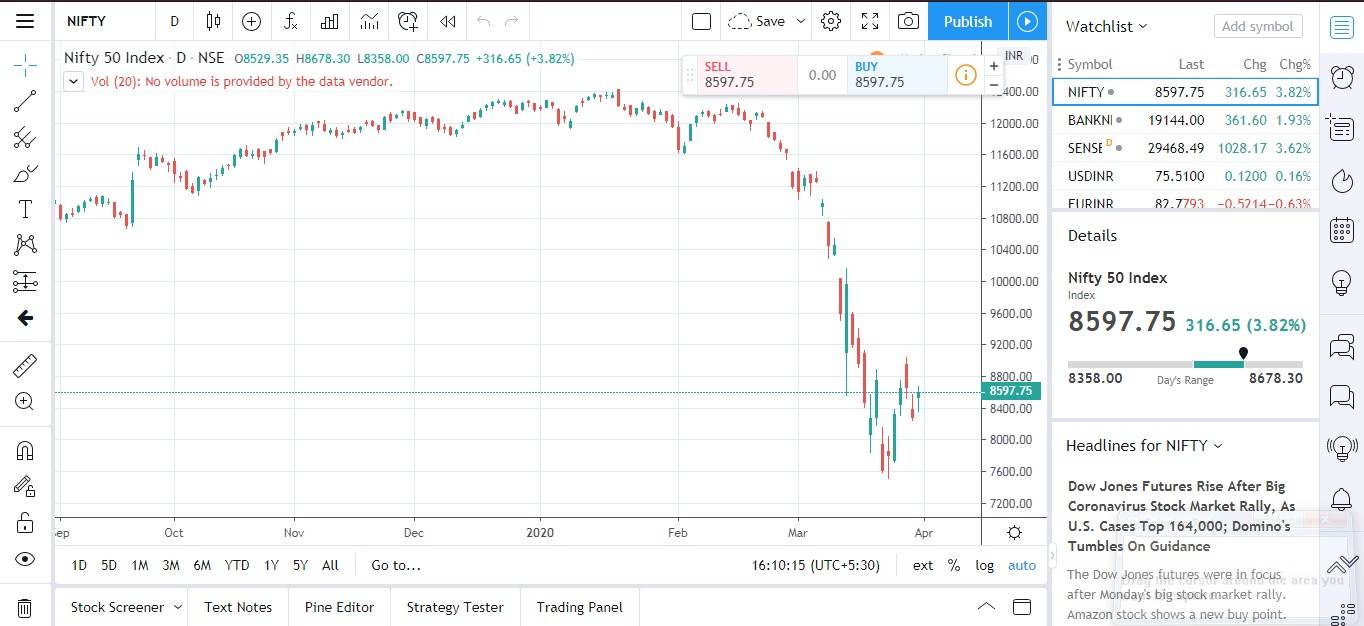
Besides all the conventional trading tools and indicators, the website also provides news (related to the stock or the product) and the latest market scenario along with the chart, so that you can stay updated while taking your decision. The chart is delayed by 15 minutes and limited number of indicators is usable in the free version of the website.
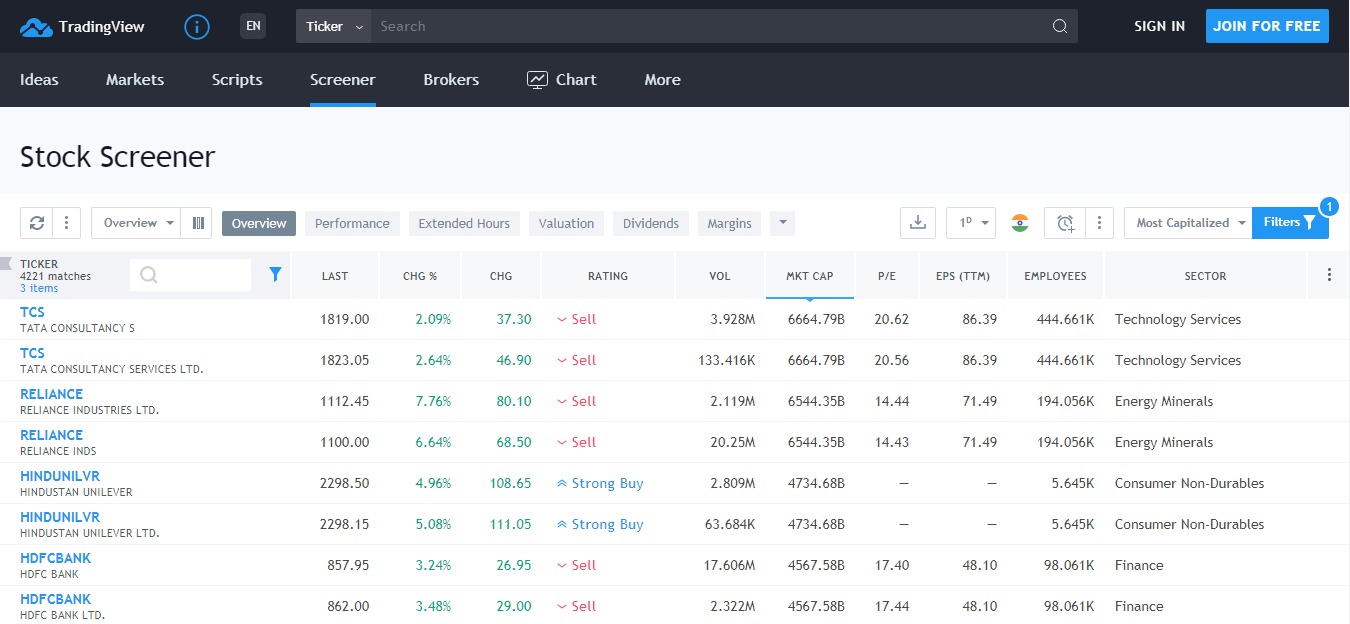
Screener section of trading view is also quite good. Here, stocks can be filtered as per requirement. Screener has both fundamental and technical screening capabilities which let you scan the product as per the pre-defined condition provided by the user.
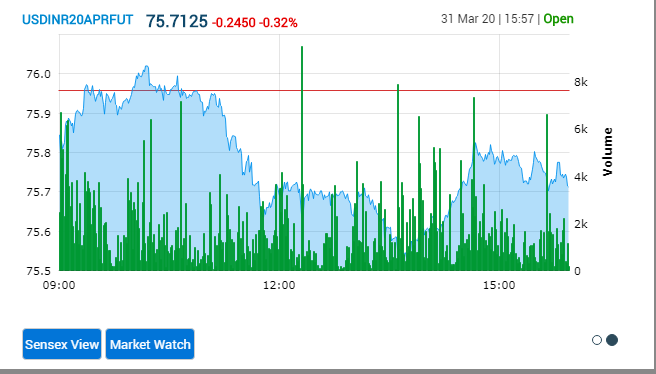
4. Investing Charting website
This website may not be that advanced in terms of chart representation as is tradingview.com but it has its own unique features. Investing website is actually news based so it has an edge over the other websites when it comes to equip the viewer with what is happening in the market.
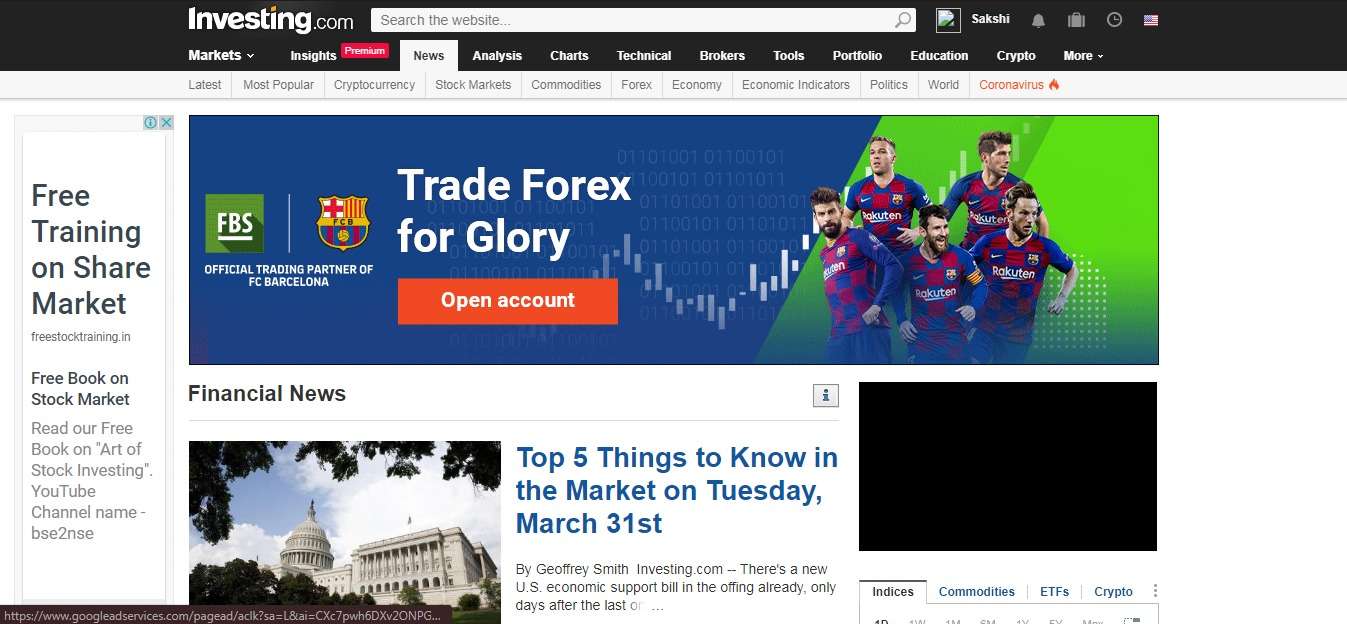
In the case of charting, the website contains a wide variety of indicators and tools. The ambit of this website is enormous and features like live data make gives it the extra edge.
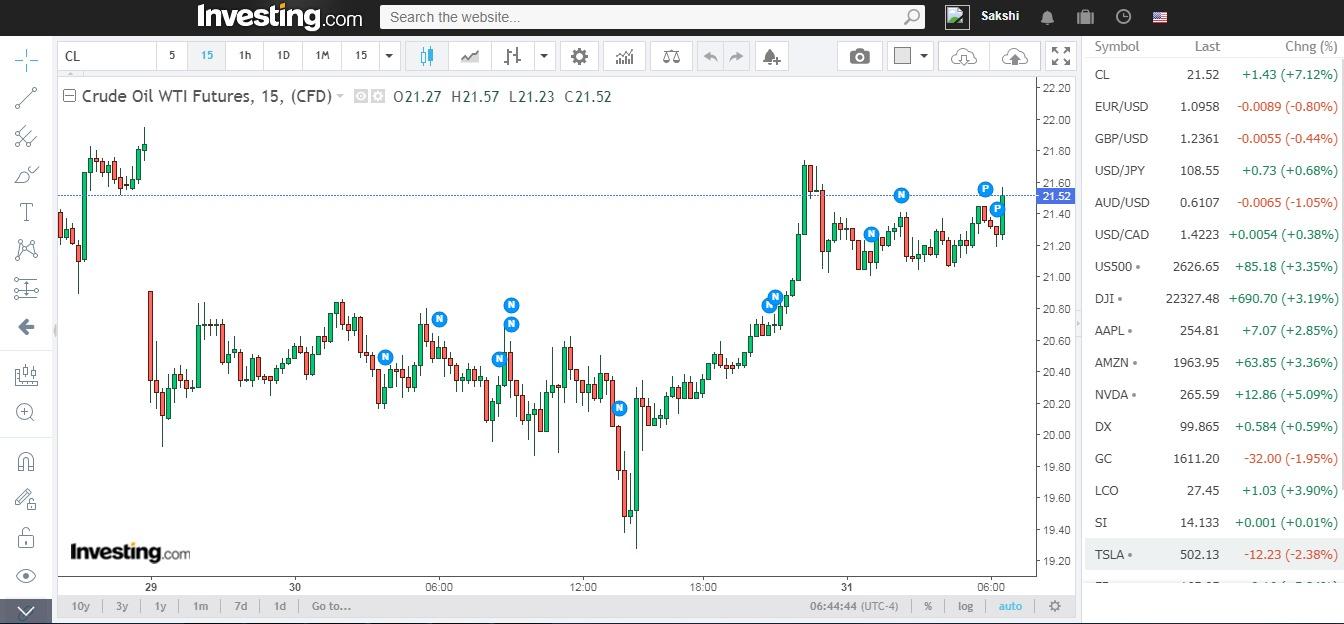
As we can see the chart is easy to understand, multiple indicators along with the tools can be applied in the chart and it is free. The candlestick pattern helps give the reader a clearer view.
Learn how to analyse stocks for free using Investing.com
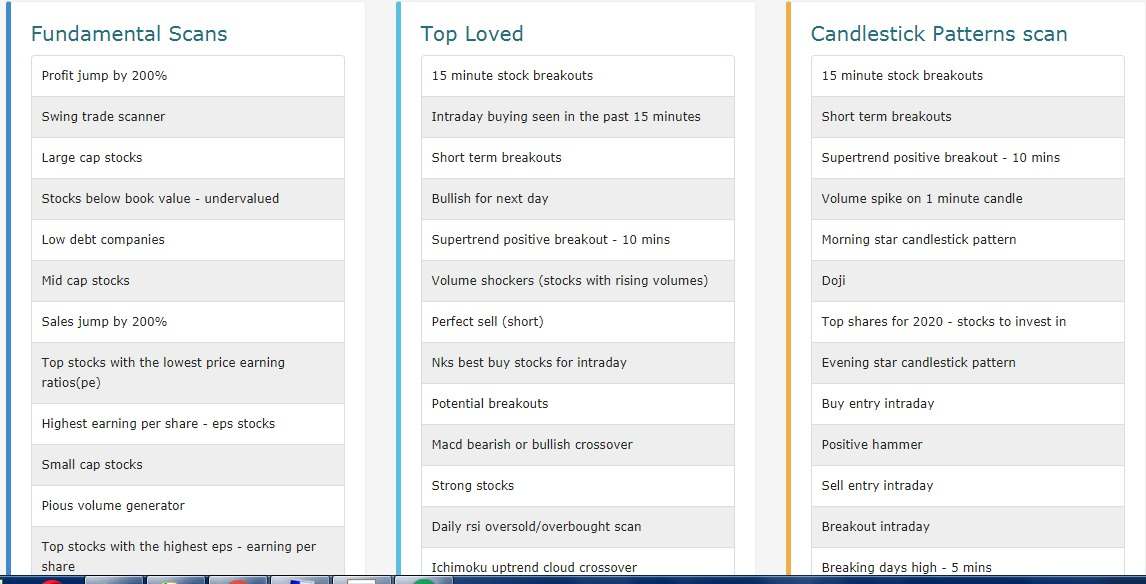
5. Chartink
If we are discussing about charting platforms, chartink is an unforgettable name. Chartink may not be the best charting website out there but it is famous for its easily programmable scanner/screener.
This website does not only help us with the scanning, but it also has a really good charting platform. However, the chart is delayed by 5minutes.
Here, getting access to the basket of indicators and other tools makes the work very easy. We can change the chart settings as per the need (tools and indicators).
The screener is the key feature of this website and this makes it special among the retail trader. With the help of an easy programmable coding language, anyone can create his/her scan. The scanner also works in the live market (5minute delay) and we can also use its feature for the end of the day’s scanning. A huge list of scanners is present by default which is freely available for use.
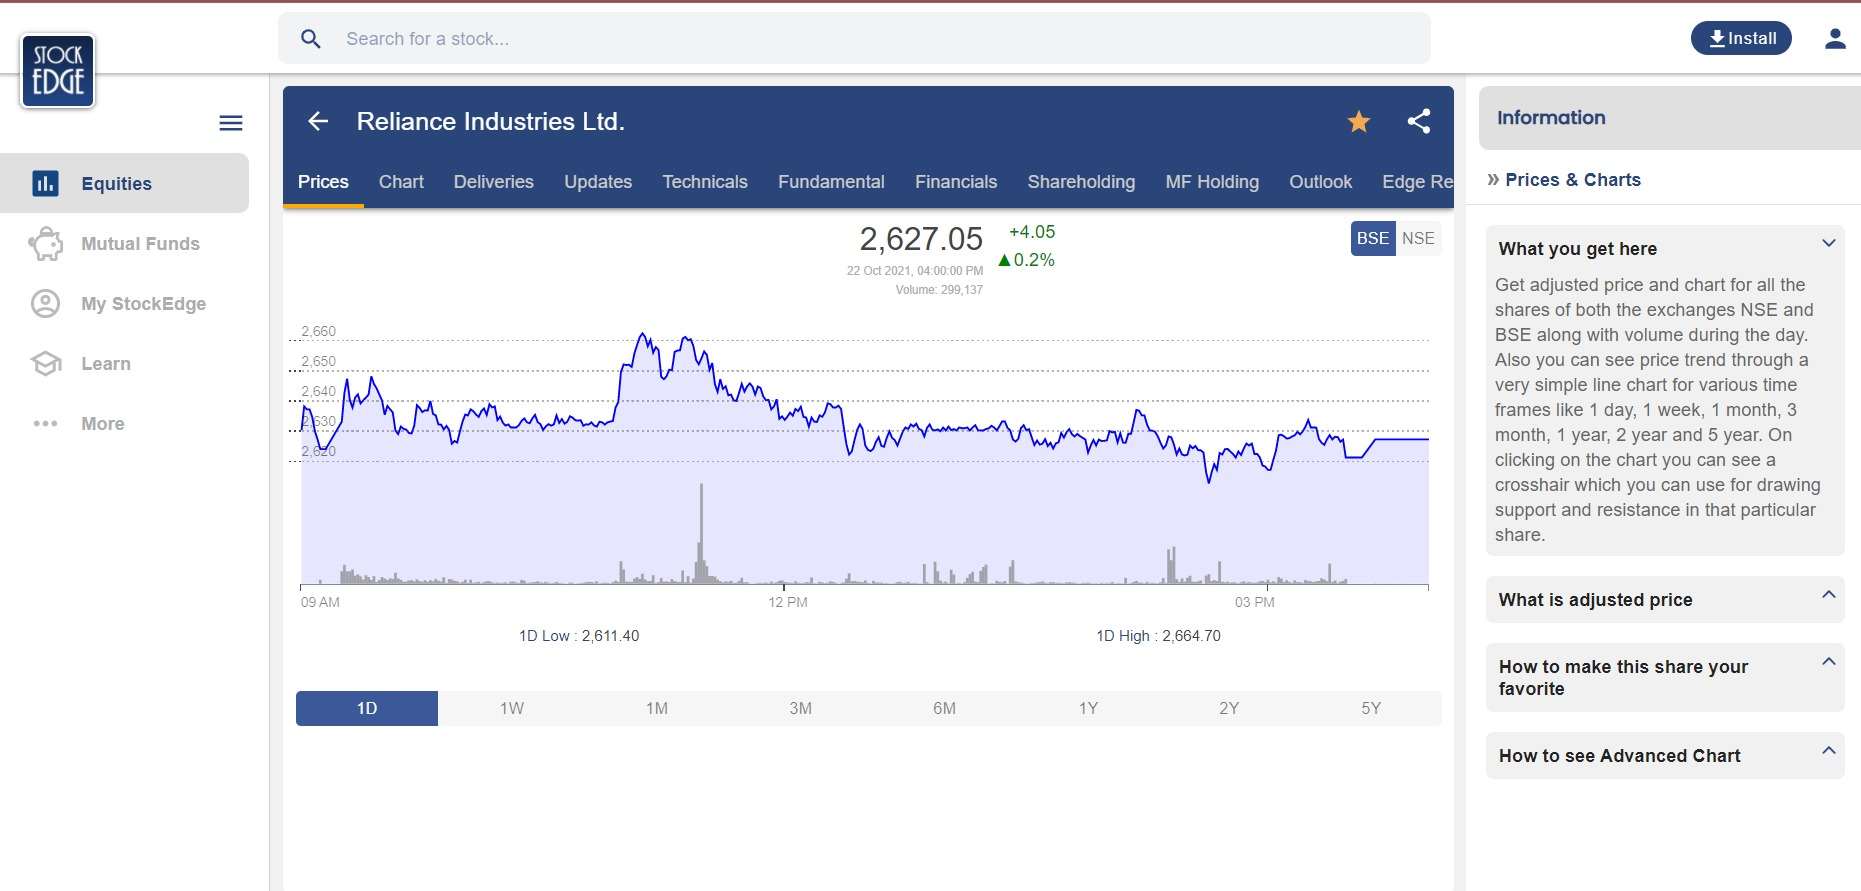
6. StockEdge
StockEdge is also one of the best charting websites as well as a research tool that helps traders in filtering out stocks for trading or investing purposes. In StockEdge we can filter out stocks based on technical, fundamental or combination scans and take trading or investing decisions accordingly.
Edge Charts is one of the most widely used and effective premium features of StockEdge for technical analysis and it fits very well with the main aim of StockEdge i.e. Getting an edge in your analysis and markets and that’s what exactly edge charts are meant for.
Edge Charts is a powerful advanced tool with 4 exclusive charting patterns: Candlestick, OHLC, Area and Line Charts. Traders and investors have an option to plot charts on periods ranging from 1 Day to 5 Years for both NSE and BSE.
Traders can draw trend lines and plot various technical parameters and metrics to enhance their research and analysis. There are 30 different sets of technical parameters with all having different bases and conclusions which can be combined to deliver out their synergistic results.

How to choose best charting websites?

Bottomline
It takes time to get a hold of these charting websites. We should choose one of the best charting websites as per our style of trading. An investor generally works with end of the day’s data. On the other hand, a trader needs real-time data feed to make perfect his entry and exit timings into the market.
Enhance your trading skills with our comprehensive capital market courses online. Dive into technical charting for the Indian market. Enroll today!
Happy Investing!


