Let’s discuss Capital Asset Pricing Model.
Every investment comes with a certain degree of risk, attached to it.
For example, the fixed deposits may see a decline in interest rates, real estate might lose value, or the stocks purchased might witness capital erosion.
The additional income or the rate of return earned from an investment compensates an investor for the risk he undertakes.
That is, the higher the risk, the higher the return the stock has to pay back, to become a rational investment.
So, it can be understood that the concept of risk and return go hand in hand.
Investment in the stock market is comparatively riskier and no matter how much an investor diversifies his investments, some level of risk will always be there.
So, understanding the risk-return trade-off is of utmost importance for any investor while making an equity investment.
Moreover, equity investments demand higher returns.
| Table of Contents |
|---|
| Understanding CAPM |
| CAPM Formula |
| CAPM Example |
| Advantages of Capital Asset Pricing Model |
| Problems with Capital Asset Pricing Model |
| Key Takeaways |
This is well explained by the Capital Asset Pricing Model (CAPM) that provides a methodology to quantify risk and translate that into expected return on equity.
Understanding CAPM
- The model was developed by Nobel laureate William Sharpe in 1970 and states that every individual investment comprises of two kinds of risk:
Systematic risk – This is a risk that is inherent to the entire market or a market segment. This type of risk is both unpredictable and non-diversifiable in nature.
Unsystematic risk – This is a risk that is inherent to a specific company or industry. This risk can be reduced through diversification. Thus,
Total Risk = Systematic risk + Unsystematic riskTherefore, when calculating the expected or appropriate return, the systematic risk is what an investor should focus upon.
So, capital asset pricing model (CAPM) evolved as a way to measure the undiversifiable or systematic risk of a stock or portfolio of stocks. The model assumes that investors hold fully diversified portfolio and thus want a return that compensates them for bearing the systematic risk, rather than the total risk.
Thus, the concept of Beta (β) is central to this model, as it measures the systematic risk of a stock.
It explains the relationship between the expected return on assets, particularly stocks where systematic risk is involved. It is widely used by corporate and financial managers in their attempt to calculate the realistic and useful costs of equity.
CAPM can be used to identify risk premiums, examine corporate financing decisions, spot undervalued investment opportunities and compare companies across different sectors.
Take Control of Your Financial Journey – Enroll in the Stock Investment Course and Learn to Invest Like a Pro!
CAPM Formula
The CAPM formula represents the linear relationship between the required rate of return on an investment and its systematic risk.
It is mathematically represented as:
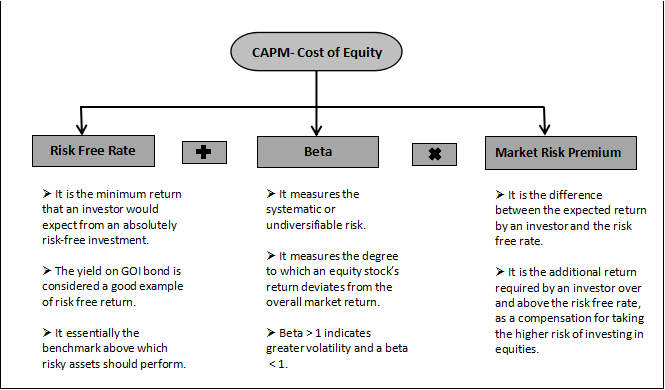
Re = Rf +β(Rm – Rf)
Where;
Re = Expected rate of return or Cost of Equity
Rf = Risk-free rate
β = Beta
(Rm – Rf) = Market risk premium
Rm = Expected return of the market
The CAPM calculation states that every investor expects to be compensated in two ways: Time Value of Money and the Risk.
The risk-free rate (Rf), accounts for the time value of money while the other components [β(Rm – Rf)], account for the additional risk that an investor bears by investing in risky investments.
Thus, the goal of the above calculation is to assess the fair value of a stock by comparing its risk and the time value of money to its expected return.
CAPM Example:
Companies like Hindustan Unilever and Pidilite publish their respective cost of equity in the annual report, as shown below.
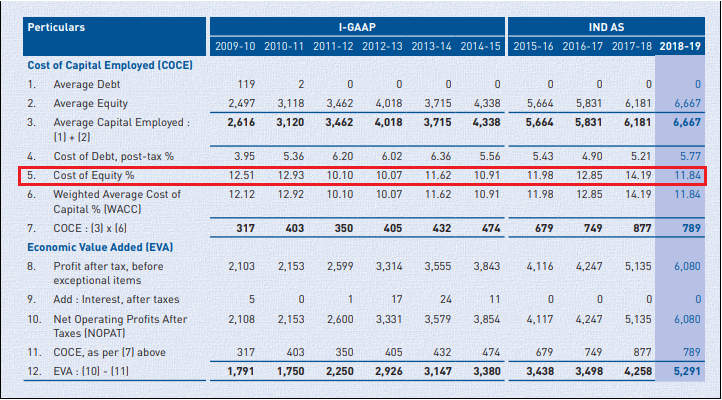
i. Pidilite’s Cost of Equity
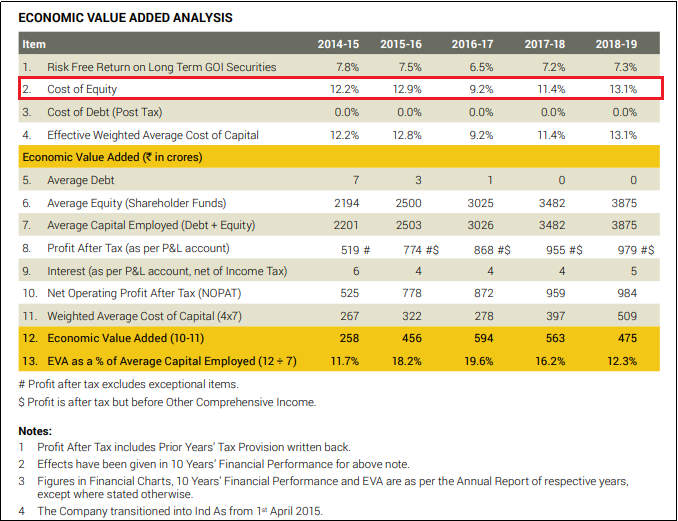
ii. Hindustan Unilever’s Cost of Equity
Advantages of Capital Asset Pricing Model
Capital asset pricing model is a widely used, return model that is simple and easy to calculate. Moreover, it equates the relationship between the rate of return and risk in Theoretical form, so it can be useful in empirical researches and testing.
It is vital in calculating the Weighted Average Cost of Capital (WACC), as it calculates cost of equity, a major component of WACC.
It is comparatively much better method of calculating cost of equity as it takes into account a company’s level of systematic risk relative to the stock market as a whole. This is generally left out by other return models, like the dividend discount model (DDM).
When exploring business opportunities, if the business mix and financing differ from the current business, then other return models, especially WACC, cannot be used but CAPM can easily be used. Thus, CAPM is superior to other return models in providing discount rate to be used in investment appraisal.


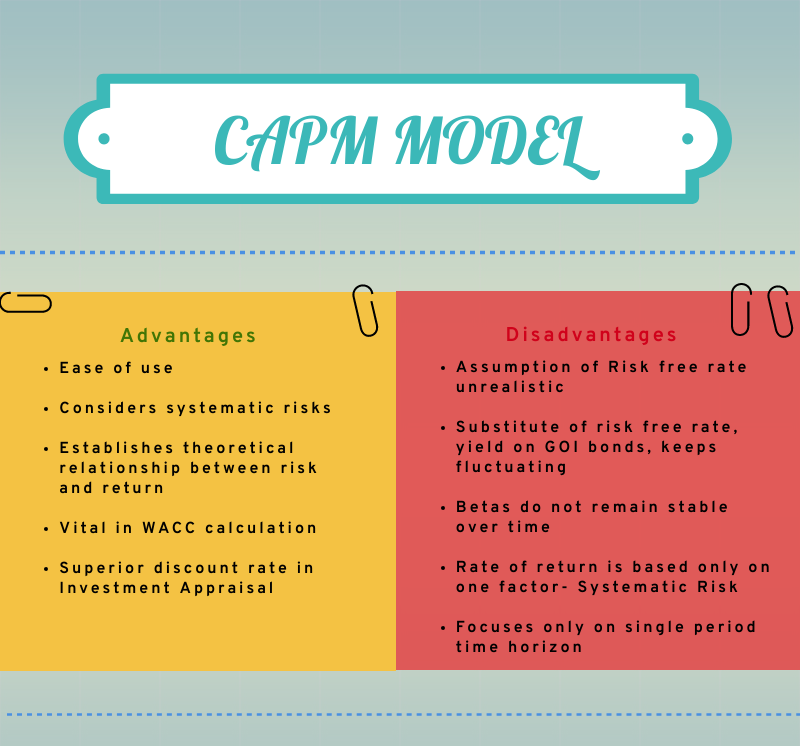
Problems with Capital Asset Pricing Model
One of the assumptions used in CAPM is that investors can borrow as well as lend funds at a risk free rate, which is actually unreal. Investors are unable to borrow or lend at the GOI bond rate. Thus, the minimum required rate of return by an investor might be more than what the model incorporates.
The yield on GOI bonds is used as a substitute for the risk free rate. However, this rate keeps on changing on regular basis with the changing economic circumstances. Thus creating volatility.
The Beta values are unstable and vary from time to time. Thus, these may not be reflective of the true risk involved and therefore are not good estimates of future risk.
CAPM assumes that a security’s required rate of return is based only on one factor, i.e., systematic risk. However, other factors such as relative sensitivity to inflation, dividend payout and others may also impact a security’s return.
The model focuses on single period time horizon. It suggests that investors are only concerned with the wealth their portfolio produces at the end of the current period. However, this does not hold true in the real world.
Key Takeaways
CAPM is one of the widely used model for calculating the risk and returns associated with investing in a stock. It helps investors ascertain the amount of risk premium required as a compensation for the extra risk that they take.
It is a better return model as it considers systematic risk, reflecting a reality, which is usually ignored by other models, to calculate the cost of equity.
The principal advantage of CAPM is the nature of the estimated cost of equity that it can generate.
However, the model is criticized for relying on assumptions regarding investor behaviors, risk and return distributions, and market fundamentals that are highly volatile and unrealistic in nature.
Despite these criticisms, the model provides more useful results than any other return models like DDM and WACC, under many situations. In addition to these, the ease of use makes it one of the logical ways to help investors in their decision making.
In order to get the latest updates of Financial Markets to visit our website StockEdge.


