Breadth Indicators help in understanding the internal strength of the market. Sometimes you will not be able to understand the direction of the market trend by just looking at the prices of the market alone.
Breadth indicators help us in understanding how the “market of stocks” is doing instead of just understanding the stock market.
Often the Breadth indicators signal a market move before it happens through divergences, where the markets are making a new move but many stocks are not participating in that move.
In this blog, we will discuss the basics of breadth indicators and the 14 most used breadth indicators which traders should know when analyzing the trend move in the market.
- What are Breadth Indicators?
- 14 Breadth Indicators that Trader should know:
- 1. Breadth Line:
- 2. McClellan Oscillator:
- 3. McClellan Ratio-Adjusted Oscillator:
- 4. McClellan Summation Index:
- 5. Breadth Thrust:
- 6. Advance- Decline ratio:
- 7. ARMS Index:
- 8. Net New High and Net New Lows:
- 9. New High Versus New Lows:
- 10. Plurality Index :
- 11. 90% Downside Days:
- 12. Absolute Breadth Index:
- 13. High-Low Logic Index:
- 14. Ticks Index:
- Bottomline:
What are Breadth Indicators?
Breadth indicators help traders and investors gauge the overall view of the market. The movement in the stock market is examined by using stock indexes.
For example, the Nifty 50 Advance/Decline Line is a cumulative guide that helps us in understanding whether more stocks are rising or falling over time.
This calculation helps us in analyzing the overall investor sentiment in all the stocks within the index.
Breadth indicators are mainly used for two purposes:
- Market Sentiment: These indicators can help us in determining if the ongoing trend of the market is going to reverse.
- Trend Strength: Breadth indicators can also help us in determining the strength of a bullish or bearish trend.
14 Breadth Indicators that Trader should know:
Below is the list of 15 Breadth Indicators that Trader should know to understand the stock market sentiment:
1. Breadth Line:
Breadth line is also known as the Advance/Decline line which is one of the best ways of measuring market internal strength.
This line is the cumulative sum of advances minus decline. The formula for the same is shown below:
Breadth Line Value= (No. of Advance Stocks – No of Decline Stocks) + Breadth Line Value of the Previous day.
When the number of advance stocks exceeds the number of the decline stocks then the breadth line will rise and vice versa.
When the stock market average is rising but the breadth line is not rising then negative divergence occurs which means that only few stocks are participating in the move and traders should be cautious when trading in the index.
2. McClellan Oscillator:
McClellan Oscillator is the difference between two exponential moving averages of advance and declines. The two averages are 19 days EMA and 30 days EMA.
The positive and negative values of this indicator indicate whether more stocks are advancing or declining. The indicator is positive when the 19-day EMA is above the 39-day EMA, and negative when the 19-day EMA is below the 39-day EMA.
This indicator usually oscillates between the range of +100/+150 or -100/-150.
This oscillator can also be used to spot negative and positive divergences.
3. McClellan Ratio-Adjusted Oscillator:
As Mcclellan found out that the advance and decline alone can be influenced by the total number of issues traded, he developed the Mcclellan Ratio-Adjusted Oscillator.
Mcclellan Ratio-Adjusted Oscillator is the ratio of net of advances minus decline divided by total number of issues traded.
The ratio is multiplied by 100 to make it easier to read.
4. McClellan Summation Index:
This summation index is the area under the Mcclellan Ratio-Adjusted Oscillator.
The McClellan summation has multiple interpretations and it is considered neutral at a reading of +1,000. During the 1960s, the McClellan Summation Index generally stayed within the bounds of 0 and +2,000.
The interpretation of this indicator is almost the same as the Mcclellan Ratio-Adjusted Oscillator.
5. Breadth Thrust:
Thrust is when the deviation from the norm is sufficiently large to be identified and when that deviation signals either the end of an old trend or beginning of the new trend.
One of the breadth indicators to analyze breadth thrust was developed by Mark Zweig which calculates a 10 day Simple Moving Average of Advances divided by the sum of Advances and Declines.
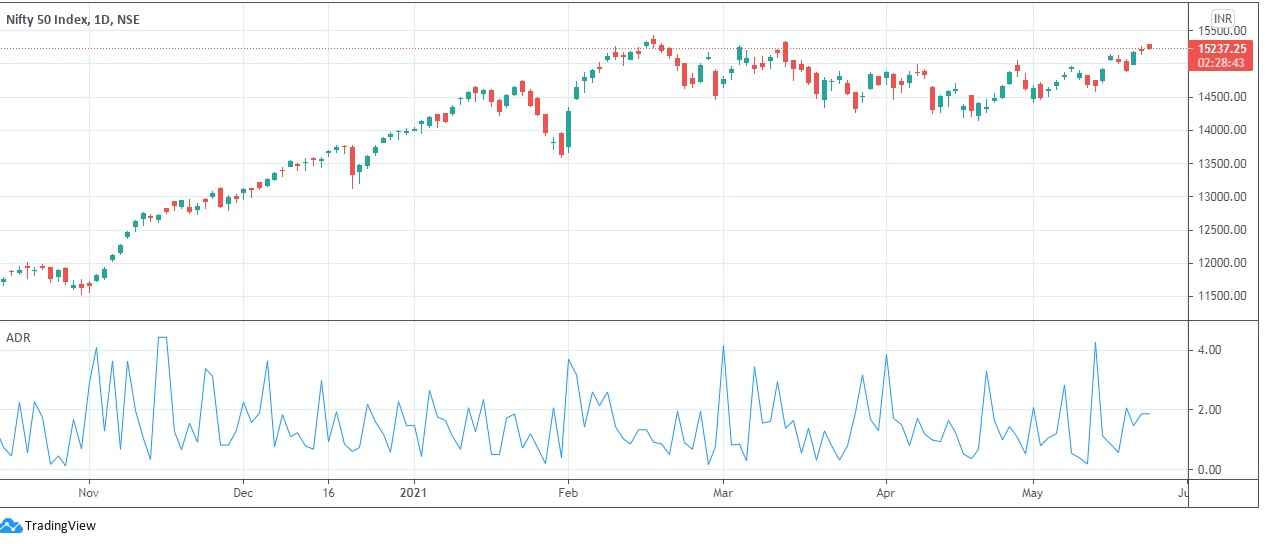
6. Advance- Decline ratio:
The advance-decline ratio refers to the number of advancing shares divided by the number of declining shares.
The advance-decline ratio can be used for various timeframes, such as one day, one week or one month.
On a standalone basis, this indicator indicates whether the market is overbought or oversold.

7. ARMS Index:
ARMS Index also known as TRIN and MKDS is one of the popular up and low volume indicators.
Up Volume is the volume traded in all advancing stocks and down volume is the volume traded in all declining stocks which is another way of gauging market strength.
When a large amount of down volume occurs when the market is at or close to the bottom and when a large amount of up volume occurs when the market is at or close to the top.
This indicator is calculated as Advance/Decline divided by Up Volume/Down Volume and it has an inverse relationship with the market prices.
8. Net New High and Net New Lows:
Net New 52-Week Highs is a simple breadth indicator which is calculated by subtracting new lows from new highs.
“New lows” is the number of stocks recording new 52-week lows and “New highs” is the number of stocks making new 52-week highs.
This indicator provides help in gauging the internal strength or weakness in the market.
It indicates that there are more new highs when the indicator is positive. On the other hand there are more new lows when the indicator is negative.
9. New High Versus New Lows:
This is the simplest indicator which suggests buying when the number of new highs exceeds the number of new lows on a daily basis.
On the other hand, one should sell when the number of new lows exceeds the number of new highs on a daily basis.
Read our latest article on 20 technical indicators you can trust while stock trading in 2021
10. Plurality Index :
Plurality Index is calculated as the 25 day sum of the absolute difference between the advances and declines and it is always a positive number.
High numbers in the plurality index suggest impending bottom and lower High numbers in the plurality index suggest impending top.
11. 90% Downside Days:
This indicator is a reliable measure for identifying stock market bottoms which uses daily upside and downside volume and also daily points gained and lost.
A 90% downside day occurs when on a particular day the percentage of the downside volume exceeds the total of upside and downside volume by 90% and percentage of downside points exceeds the total of gained points and lost points by 90%.
12. Absolute Breadth Index:
This is a breadth indicator which is calculated by taking the absolute difference between the advances and declining stocks.
Usually, large numbers suggest volatility is increasing, which indicates significant changes in stock prices in the coming weeks.
13. High-Low Logic Index:
The high-low index compares stocks that are reaching their 52-week highs with stocks that are hitting their 52-week lows.
The high-low index is mainly used by investors and traders for confirming the prevailing market trend of a broad market index.
14. Ticks Index:
This index is calculated by taking all the stocks in the market that have had an uptick minus all the stocks that had a down tick and then the result is displayed on a chart based on a particular time frame.
It is an intraday indicator as it is using data on a tick basis but is useful for finding inefficiencies in the market.
Bottomline:
One should note that the breadth indicators can only be calculated on indexes and not on a particular stock.
Depending on the data available these indicators can be calculated to analyze the market strength of the stock market.
Traders should use market breadth indicators with other forms of technical analysis tools, such as chart patterns and technical indicators, to maximize the odds of success.
Happy Investing!
For more stock related queries visit web.stockedge.com


thanks for sharing