Elearnmarkets - Financial Market Learning
  • Courses
  • Webinars
  • Stories
  • Language
    • English
    • Hindi
    • Bengali
No Result
View All Result
Get Free Course
  • Basic Finance
  • Derivatives
    • Futures
    • Options
  • Financial Planning
  • Fundamental Analysis
  • Technical Analysis
  • Mutual Funds
  • Marketshala
  • Miscellaneous
Elearnmarkets - Learn Stock Market, trading, investing for Free
  • Courses
  • Webinars
  • Stories
  • Language
    • English
    • Hindi
    • Bengali
No Result
View All Result
Get Free Course
Elearnmarkets - Learn Stock Market, trading, investing for Free
No Result
View All Result
Home Technical Analysis
How to Analyze Bullish and Bearish Stock Trends 1

How to Analyze Bullish and Bearish Stock Trends

Elearnmarkets by Elearnmarkets
August 29, 2022
in Technical Analysis, Charts, Patterns & Indicators
Reading Time: 8 mins read
4
13.7k
VIEWS
Share on FacebookShare on XShare on WhatsApp

Stock Trends information is part of the base information we review before making a trade.

“The trend is your friend, until the end when it bends.” –  Martin Zweig

Stock Trends Analysis is an important part of technical analysis. Without understanding how to do trend analysis traders cannot do technical analysis.

Stock Trends show the traders a general direction in which the stock is currently moving.

Depending on whether it is a bull or bear market, the trends move upwards, downwards, or sideways.

The Stock Trends can be both short-term and long-term however, the longer the trend moves the more worthy the trend becomes.

In this blog, we will be discussing the basics of Stock Trends analysis and also how to do trend analysis

Table Of Contents
  1. What are Stock Trends?
  2. Types of Stock Trends:
  3. Uptrend:
  4. Downtrend:
  5. Sideways:
  6. Types of bullish candlesticks:
  7. Types of bearish candlesticks:

What are Stock Trends?

Stock Trends tell us the overall direction of the stock’s prices or the market as a whole.

In technical analysis, trends can be analyzed by using trendlines or price action which tells us when the price is making higher highs for an uptrend, or lower lows for a downtrend.

Many traders try to trade in the same direction as the ongoing trend, whereas some contrarians trade against the trend.

The trends can be categorized into uptrends, downtrends, and sideways which occur in all types of markets such as stocks, bonds, and futures.

Types of Stock Trends:

Stock Trends can be divided into:

Uptrend:

When the prices are making higher highs and higher lows then the trend can be termed as an Uptrend.

Generally, when the psychological and fundamental factors improve, the prices start moving up and forms an Upward Trend.

When the stock or market is on an uptrend then it is termed as “Bull market”. Traders should buy dips during this ongoing Uptrend.

Downtrend:

When the prices are making lower lows and lower highs then the trend can be termed as the Downtrend.

Generally, when the psychological and fundamental factors degrade, the prices start moving down and form the Downtrend.

When the stock market is on the downtrend then it is termed as “Bear market”. Traders should sell dips during this ongoing Downtrend.

Sideways:

The horizontal price movement happens when the supply and demand are almost equal then the trend is termed as “Sideways trend”.

Sideways trend happes when neither psychological factors nor fundamental factors tend to

This trend may last for few weeks or a few years.

How to analyze stock trends with candlesticks?

Candlestick chart patterns help us in understanding whether the ongoing trend is an uptrend, downtrend, or sideways.

With the help of candlesticks patterns, traders can:

  • See the completion of the particular number of trades during a specific period.
  • It shows that if there was more selling or buying pressure during that particular period.

Candlesticks can be categorized into bullish or bearish candlesticks:

Types of bullish candlesticks:

Bullish Reversal Candlestick Patterns indicate that the ongoing downtrend is going to end and it may reverse to an uptrend.

One should note that:

  • Bullish reversal patterns should form at the end of a downtrend
  • One should confirm the reversal signals given by bullish reversal patterns with other indicators such as high trading volume.

Below is a list of 5 Powerful Bullish Candlestick Patterns which can help the traders to analyze if the ongoing trend will continue or reverse:

  • Hammer
  • Piercing Pattern
  • Bullish Engulfing
  • The Morning Star
  • The three white soldiers

Types of bearish candlesticks:

Bearish Reversal Candlestick Patterns indicate that the ongoing uptrend is going to end and it may reverse to the downtrend.

One should note that:

  • Bearish reversal patterns should form at the end of an uptrend
  • One should confirm the reversal signals gives by bearish reversal patterns with other indicators such as high trading volume.

Below is a list of 5 Powerful Bearish Candlestick Patterns which can help the traders to analyze if the ongoing trend will continue or reverse:

  • Hanging Man
  • Dark Cloud Cover
  • Bearish Engulfing
  • The Evening Star
  • The Three Black Crows

What is a Bearish trend?

A bearish Trend in the financial markets can be defined as a downward trend if there is a fall in the industry’s stocks or there is an overall fall in the market indices.

The bearish trend is characterized by heavy selling pressure exerted by the bears.

When there is a fall in the prices of about 20% then it is identified as a bearish trend.

What is a Bullish Trend?

A bullish Trend in the financial markets can be defined as an uptrend if there is a rise in the industry’s stocks or there is an overall rise in the market indices.

The bullish trend is characterized by heavy buying pressure exerted by the bulls.

When there is a rise in the prices of about 20% then it is identified as a bullish trend.

Using Technical Indicators for Trend Analysis:

Technical indicators are technical tools that help in analyzing the ongoing trend and whether the current trend is going to reverse or not.

Technical indicators can be momentum indicators, volatility indicators, volume indicators, and so on.

Traders can buy the stock it is trending up or down with strong momentum and sell it when the stock loses momentum.

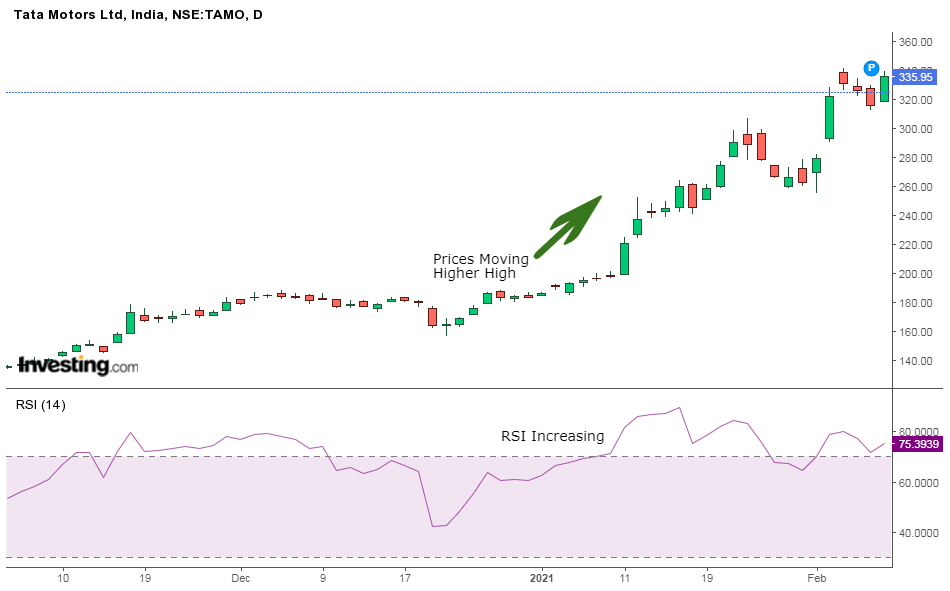
Traders can take the help of the Relative Strength Index (RSI) indicator that can be used in trend analysis strategies.

Below we can see how the stock is trending higher as momentum is rising:

Stock Trends

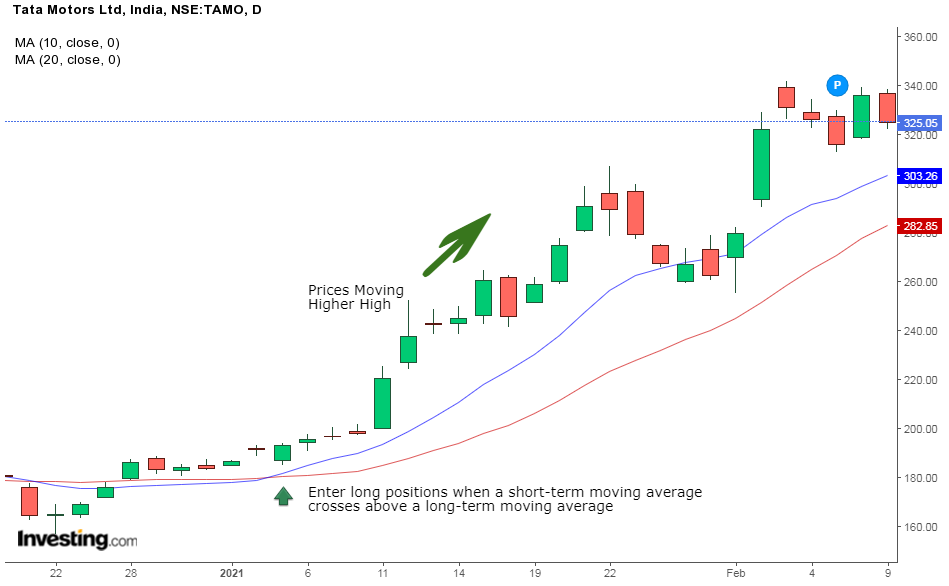
Traders can use Moving Average when analyzing the trends of the stock.

Traders can buy the stock when a short-term moving average crosses above a long-term moving average and sell it  when a short-term moving average crosses below a long-term moving average as shown in the below example:

Stock Trends

Indicators help in providing us with trend trade or reversal signals.

These technical indicators can be used on all time frames such as hourly, weekly, daily, monthly, etc.

Traders should use a combination of technical indicators to confirm the signals given by these technical indicators.

Using financial statements for predicting stock trends:

Traders can also use a set of financial ratios for predicting stock price trend,

The decisions of such investors will rely on the financial ratios by analyzing the financial statements when making financial decisions.

You can also watch the video below on how to use charts in identifying the stock market trends:

Key Takeaways:

  • A trend tells us the overall direction of the stock’s prices or the market as a whole.
  • The trends can be categorized into uptrends, downtrends, and sideways which occur in all types of markets such as stocks, bonds, and futures.
  • Candlestick chart patterns help us in understanding whether the ongoing trend is an uptrend, downtrend, or sideways.
  • Candlesticks can be categorized into bullish or bearish candlesticks:
  • Bearish Trend in the financial markets can be defined as a downward trend if there is fall in the industry’s stocks or there is overall fall in the market indices.
  • Bullish Trend in the financial markets can be defined as an uptrend if there is rise in the industry’s stocks or there is overall rise in the market indices.
  • Technical indicators are technical tools that help in analyzing the ongoing trend and whether the current trend is going to reverse or not.
  • Indicators help in providing us with trend trade or reversal signals.
  • Traders should use a combination of technical indicators to confirm the signals given by these technical indicators.
  • Traders should use a combination of technical indicators to confirm the signals given by these technical indicators.

Check out more articles on StocKEdge blog.

Tags: basiccandlestick patternindicators of technical analysistechnical basicstrend analysis
ShareTweetSend
Get Kotak Offer Get Kotak Offer Get Kotak Offer
Previous Post

Guide: How to Start Investing in the Stock Market- from Beginner to Pro (2021)

Next Post

What is Stock Rating and How to use it for investment decisions?

Elearnmarkets

Elearnmarkets

Elearnmarkets (ELM) is a complete financial market portal where the market experts have taken the onus to spread financial education. ELM constantly experiments with new education methodologies and technologies to make financial education effective, affordable and accessible to all. You can connect with us on Twitter @elearnmarkets.

Related Posts

Understand Slippage in Trading
Technical Analysis

What is Slippage in Trading? Meaning & Examples

March 28, 2025
284
Breakout trading strategies
Technical Analysis

Top 5 Breakout Trading Strategies

March 12, 2025
1k
5 stocks for today
Technical Analysis

5 Stocks to Buy Today That Could Beat the NIFTY in 2025!

May 5, 2025
390
Image describing What is marginal trading facility
Technical Analysis

 What is a Margin Trading Facility? Advantages & Risks

April 4, 2025
657

Comments 4

  1. JIGAR JANI says:
    4 years ago

    Superb explanation
    Thanks 🙏😊
    Improving my knowledge

    Reply
    • Sakshi Agarwal says:
      4 years ago

      Hi,

      We really appreciated that you liked our blog.

      Keep Reading!

      Reply
  2. Tongs Timothy Ibrahim says:
    3 years ago

    This explanation is very insightful and brief.
    Thank you.

    Reply
    • Sakshi Agarwal says:
      3 years ago

      Hi,

      We really appreciated that you liked our blog!

      Thank you for Reading!

      Keep Reading!

      Reply

Leave a Reply Cancel reply

Your email address will not be published. Required fields are marked *

Disclaimer

Elearnmarkets (Kredent InfoEdge Pvt. Ltd.) is a SEBI-registered Research Analyst (RA) entity (SEBI Registration No.: INH300007493). The information provided in this article is for educational and informational purposes only and should not be considered as an offer to buy or sell any securities or investment products.

The stocks, securities, and investment instruments mentioned herein are not recommendations under SEBI (Research Analysts) Regulations, 2014. Readers are advised to conduct their own due diligence and seek independent financial advice before making any investment decisions.

Investments in securities markets are subject to market risks. Please read all related documents carefully before investing. Investing in Equity Shares,
Derivatives, Mutual Funds, or other instruments carry inherent risks, including potential loss of capital. Elearnmarkets (Kredent InfoEdge Pvt. Ltd.) does not provide any guarantee or assurance of returns on any investments. Past performance is not indicative of future performance.

Elearnmarkets Logo

Follow Us

Facebook-f X-twitter Instagram Linkedin-in Youtube Telegram

Register on Elearnmarkets

Continue your financial learning by creating your own account on Elearnmarkets.com

Register Free Account

Download App

Playstore logo
Download on app store

Categories

  • Basic Finance
  • Derivatives
  • Financial Planning
  • Fundamental Analysis
  • Technical Analysis
  • Mutual Funds
  • Miscellaneous

Popular On Elearnmarkets

  • Market Superheroes:
  • Vivek Bajaj
  • Chetan Panchamia
  • Ashish Kyal
  • Premal Parekh
  • Abhijit Paul
  • Jegan
  • Sivakumar Jayachadran
  • Jyoti Budhia
  • Vivek Gadodia
  • Vishal Mehta
  • Piyush Chaudhry
  • Santosh Pasi
  • Gomathi Shankar
  • Market Superheroes:
  • Vivek Bajaj
  • Chetan Panchamia
  • Ashish Kyal
  • Premal Parekh
  • Abhijit Paul
  • Jegan
  • Sivakumar Jayachadran
  • Jyoti Budhia
  • Vivek Gadodia
  • Vishal Mehta
  • Piyush Chaudhry
  • Santosh Pasi
  • Gomathi Shankar
  • Courses:​
  • Options Trading
  • Dow Theory
  • Momentum Trading
  • Stock Investing
  • Harmonic Chart Patterns
  • Algo Trading
  • Elliot Wave Theory
  • Advanced Excel
  • Cryptocurrency
  • NSE Certification Course
  • Courses:​
  • Options Trading
  • Dow Theory
  • Momentum Trading
  • Stock Investing
  • Harmonic Chart Patterns
  • Algo Trading
  • Elliot Wave Theory
  • Advanced Excel
  • Cryptocurrency
  • NSE Certification Course
  • Webinars:
  • Bank Nifty Scalping
  • Intraday Trading Strategies
  • Options Trading Strategies
  • Options selling
  • Price Action
  • Relative Strength
  • Tax Planning
  • Options Buying
  • Growth Stocks
  • Portfolio Management
  • Risk Management
  • Renko Charts
  • Crude Oil
  • Traders Psychology
  • Moving Average
  • Multibagger Stocks
  • Free Learning Modules:
  • Intraday Trading
  • Options Scalping
  • Swing Trading
  • Financial Modelling
  • RSI Indicator
  • Bollinger Bands
  • Pricing of Futures
  • Personal Finance
  • Initial Public Offerings (IPO)
  • Value Investing
  • Technical Indicators
  • Candlesticks
  • Chart Patterns
  • Option Greeks
  • ELSS Funds
  • Banking and Insurance
  • Real Estate
  • Gold
  • Book Summaries:
  • Rich Dad Poor Dad
  • Psychology of Money
  • The Intelligent Investor
  • The Richest Man in Babylon
  • Think and Trade Like a Champion
  • Value Investing and Behavioural Finance
  • Trading in the Zone
  • Learn to Earn
  • Book Summaries:
  • Rich Dad Poor Dad
  • Psychology of Money
  • The Intelligent Investor
  • The Richest Man in Babylon
  • Think and Trade Like a Champion
  • Value Investing and Behavioural Finance
  • Trading in the Zone
  • Learn to Earn
  • Tools:
  • CAGR Calculator
  • SIP Calculator
  • eLearnOptions
  • Future Value Calculator
  • Present Value Calculator
  • Atal Pension Yojana
  • Cost of Delay Calculator
  • Become a Crorepati
  • Tools:
  • CAGR Calculator
  • SIP Calculator
  • eLearnOptions
  • Future Value Calculator
  • Present Value Calculator
  • Atal Pension Yojana
  • Cost of Delay Calculator
  • Become a Crorepati

© 2025 Elearnmarkets. All Rights Reserved

  • Visit Elearnmarkets
  • Courses
  • Webinars
  • Financial Guides
  • Get Free Counselling
  • Visit Elearnmarkets
  • Courses
  • Webinars
  • Financial Guides
  • Get Free Counselling

Download Our App

No Result
View All Result
  • Article Categories
    • Basic Finance
    • Derivatives
    • Financial Planning
    • Fundamental Analysis
    • Technical Analysis
    • ETFs & Mutual Funds
    • Marketshala
    • Miscellaneous
  • Language
    • Hindi
    • Bengali
    • English
  • Courses
  • Webinars
  • Stories
Get Free Course

© 2024 Elearnmarkets All Rights Reserved

A Handbook of Technical Analysis
To start your trading journey as a seasoned technical analyst
Download Guide For FREE
Guidebook On Chart Patterns
Take Your Trading To The Next Level With Strategies Shared In This Ebook
Download Guide For FREE
Trading Day 2025