Elearnmarkets - Financial Market Learning
  • Courses
  • Webinars
  • Stories
  • Language
    • English
    • Hindi
    • Bengali
No Result
View All Result
Get Free Course
  • Basic Finance
  • Derivatives
    • Futures
    • Options
  • Financial Planning
  • Fundamental Analysis
  • Technical Analysis
  • Mutual Funds
  • Marketshala
  • Miscellaneous
Elearnmarkets - Learn Stock Market, trading, investing for Free
  • Courses
  • Webinars
  • Stories
  • Language
    • English
    • Hindi
    • Bengali
No Result
View All Result
Get Free Course
Elearnmarkets - Learn Stock Market, trading, investing for Free
No Result
View All Result
Home Basic Finance
What is Stock Rating and How to use it for investment decisions? 1

What is Stock Rating and How to use it for investment decisions?

Elearnmarkets by Elearnmarkets
September 6, 2023
in Basic Finance, Capital Markets
Reading Time: 5 mins read
4
9.8k
VIEWS
Share on FacebookShare on XShare on WhatsApp

Traders often come across the word “stock ratings” when they see business channels or read financial newspapers.

We often get messages or stock recommendations on whether to buy, sell or hold the stocks.

These are termed as the stock ratings which are given by the research analysts.

In this blog, we will explain what buy, hold, sell, outperform, and underperform stock ratings are and how the knowledge of these stock ratings can help stock traders to make the right trading decisions.

What are Stock Ratings?

A stock rating is a measure of the performance of a stock in a given specific time period.

Analysts and brokerage firms use these ratings when they issue stock recommendations to stock traders and retail traders.

Analysts research financial statements of various companies, talk to management and customers or listen to the conference calls of those companies to arrive

These ratings are usually issued quarterly i.e at intervals of three months.

Stock ratings include a target price which helps traders to understand a stock’s intrinsic value when compared to its market value.

What does the stock rating mean?

Research Analysts give their recommendations on the stock by analyzing financial statements, listening to the company’s conference calls quarterly, and reviewing the company’s management on their future prospects.

These analysts can even contact directly the management and its customers to have a clear idea on how the company is performing as compared to its past performance and to its peers.

Research Analysts also conduct surveys and various researches to know the future prospects of the company.

After the analysis detailed research reports are issued by these investment banks and analysts on the stock.

Types of stock ratings

Stock Ratings can be categorized into buy, sell, hold, underperform and outperform ratings:
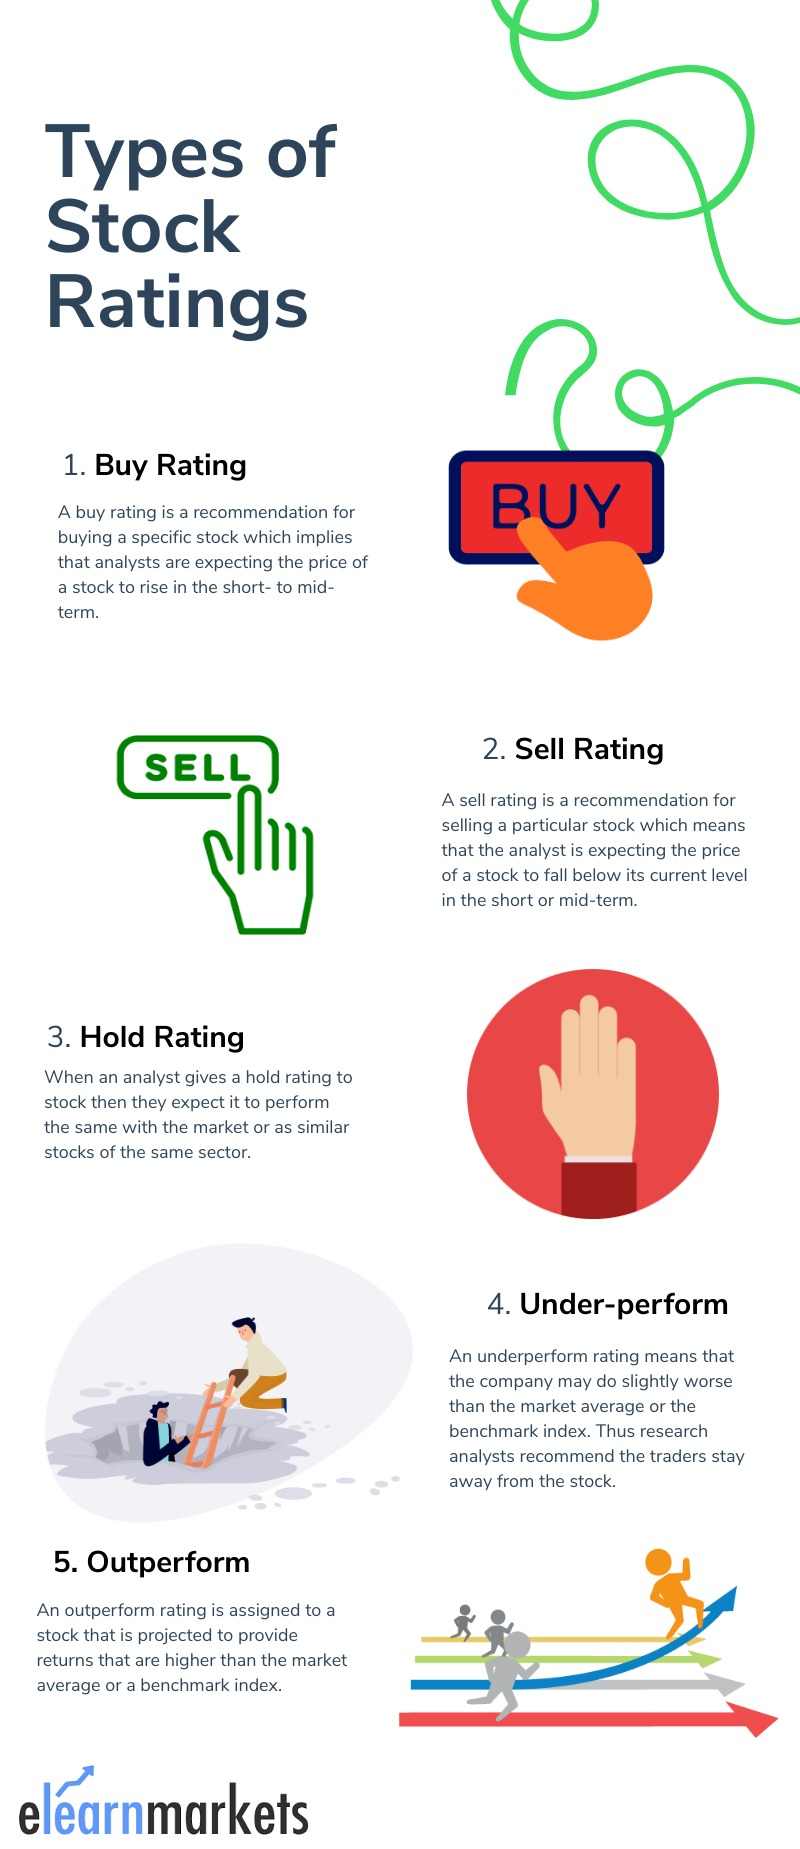
Types of stock Rating

1. Buy Rating

A buy rating is a recommendation for buying a specific stock which implies that analysts are expecting the price of a stock to rise in the short- to mid-term.

The analysts are usually of the opinion that the stock can surpass the return of similar stocks in the same sector because of reasons such as the launch of a new product or service.

2. Sell Rating

A sell rating is a recommendation for selling a particular stock which means that the analyst is expecting the price of a stock to fall below its current level in tcrehe short or mid-term.

A strong sell rating means that analysts are expecting the price of the specific stock to fall significantly below its current level in the near term.

If any analysts recommend a strong sell rating on any stock, then a particular company may end up losing its vital business from the company.

3. Hold

When an analyst gives a hold rating to stock then they expect it to perform the same with the market or as similar stocks of the same sector.

This rating tells the stockbrokers not to buy or sell the stock but to hold.

A hold rating is assigned to a stock when there is uncertainty in a company for example regarding new products/services.

4. Underperform

An underperform rating means that the company may do slightly worse than the market average or the benchmark index. Thus research analysts recommend the traders stay away from the stock.

For example, if a stock’s total return is 3% and the Nifty’s total return is 6%, then it underperformed the index by 3%.

5.Outperform

An outperform rating is assigned to a stock that is projected to provide returns that are higher than the market average or a benchmark index.

For example, if a stock’s total return is 10% and the Dow Jones Industrial Average’s total return is 6%, it has outperformed the index by 4%.

6. Overweight

An overweight rating on a stock usually means that it deserves a higher weighting than the benchmark’s current weighting for that stock. An overweight rating on a stock means that an equity analyst believes the company’s stock price should perform better in the future.

7. Underweight

Underweight is a sell or don’t buy recommendation that analysts give to specific stocks. It means that they think the stock will perform poorly over the next 12 months. This can mean either losing value or growing slowly, depending on market conditions, but it always means that the analyst believes the stock will underperform its market.

Analyze Stock Rating for investment in the stock market


Though these stock ratings may have an effect on the individual stock that may lead to a sharp move in the stock price on either side, investors may have their own opinions on both stock rating and also the price target.

Key Takeaways

  • A stock rating is a measure of the performance of a stock in a given specific time period.
  • Analysts research financial statements of various companies, talk to management and customers or listen to the conference calls of those companies to arrive at suitable stock ratings.
  • Stock Ratings can be categorized into buy, sell, hold, underperform and outperform stock ratings

Disclaimer: We should not only rely on the stock ratings but also do our own analysis before investing. Do stock analysis on StockEdge for free!

Tags: basicstock market
ShareTweetSend
Get Kotak Offer Get Kotak Offer Get Kotak Offer
Previous Post

How to Analyze Bullish and Bearish Stock Trends

Next Post

7 Easy Ways You Can Plan Your Financial Future

Elearnmarkets

Elearnmarkets

Elearnmarkets (ELM) is a complete financial market portal where the market experts have taken the onus to spread financial education. ELM constantly experiments with new education methodologies and technologies to make financial education effective, affordable and accessible to all. You can connect with us on Twitter @elearnmarkets.

Related Posts

How is standard deviation used in mutual fund
ETFs & Mutual Funds

How is Standard Deviation Used in Mutual Fund

April 22, 2025
304
Ways to Make Trading More Transparent
Cryptocurrency

Under the Crypto Hood: 5 Ways to Make Trading More Transparent

May 5, 2025
75
options trading books
Basic Finance

Top 5 Options Trading Books for Beginners

March 19, 2025
768
The Rise of Meme Coins Like Trump Coin and Why They May Be a Good Investment 2
Cryptocurrency

The Rise of Meme Coins Like Trump Coin and Why They May Be a Good Investment

February 26, 2025
161

Comments 4

  1. Robert Miller says:
    4 years ago

    This article is very interesting and has very useful information. Thank you and great work!

    Reply
    • Sakshi Agarwal says:
      4 years ago

      Hi,

      We are glad that you liked our post.

      Thank you for Reading!

      Reply
  2. Akshay Gaikwad says:
    4 years ago

    Very good knowledgeable article, thank u

    Reply
    • Sakshi Agarwal says:
      4 years ago

      Hi,

      We are glad that you liked our post.

      Thank you for Reading!

      Reply

Leave a Reply Cancel reply

Your email address will not be published. Required fields are marked *

Disclaimer

Elearnmarkets (Kredent InfoEdge Pvt. Ltd.) is a SEBI-registered Research Analyst (RA) entity (SEBI Registration No.: INH300007493). The information provided in this article is for educational and informational purposes only and should not be considered as an offer to buy or sell any securities or investment products.

The stocks, securities, and investment instruments mentioned herein are not recommendations under SEBI (Research Analysts) Regulations, 2014. Readers are advised to conduct their own due diligence and seek independent financial advice before making any investment decisions.

Investments in securities markets are subject to market risks. Please read all related documents carefully before investing. Investing in Equity Shares,
Derivatives, Mutual Funds, or other instruments carry inherent risks, including potential loss of capital. Elearnmarkets (Kredent InfoEdge Pvt. Ltd.) does not provide any guarantee or assurance of returns on any investments. Past performance is not indicative of future performance.

Elearnmarkets Logo

Follow Us

Facebook-f X-twitter Instagram Linkedin-in Youtube Telegram

Register on Elearnmarkets

Continue your financial learning by creating your own account on Elearnmarkets.com

Register Free Account

Download App

Playstore logo
Download on app store

Categories

  • Basic Finance
  • Derivatives
  • Financial Planning
  • Fundamental Analysis
  • Technical Analysis
  • Mutual Funds
  • Miscellaneous

Popular On Elearnmarkets

  • Market Superheroes:
  • Vivek Bajaj
  • Chetan Panchamia
  • Ashish Kyal
  • Premal Parekh
  • Abhijit Paul
  • Jegan
  • Sivakumar Jayachadran
  • Jyoti Budhia
  • Vivek Gadodia
  • Vishal Mehta
  • Piyush Chaudhry
  • Santosh Pasi
  • Gomathi Shankar
  • Market Superheroes:
  • Vivek Bajaj
  • Chetan Panchamia
  • Ashish Kyal
  • Premal Parekh
  • Abhijit Paul
  • Jegan
  • Sivakumar Jayachadran
  • Jyoti Budhia
  • Vivek Gadodia
  • Vishal Mehta
  • Piyush Chaudhry
  • Santosh Pasi
  • Gomathi Shankar
  • Courses:​
  • Options Trading
  • Dow Theory
  • Momentum Trading
  • Stock Investing
  • Harmonic Chart Patterns
  • Algo Trading
  • Elliot Wave Theory
  • Advanced Excel
  • Cryptocurrency
  • NSE Certification Course
  • Courses:​
  • Options Trading
  • Dow Theory
  • Momentum Trading
  • Stock Investing
  • Harmonic Chart Patterns
  • Algo Trading
  • Elliot Wave Theory
  • Advanced Excel
  • Cryptocurrency
  • NSE Certification Course
  • Webinars:
  • Bank Nifty Scalping
  • Intraday Trading Strategies
  • Options Trading Strategies
  • Options selling
  • Price Action
  • Relative Strength
  • Tax Planning
  • Options Buying
  • Growth Stocks
  • Portfolio Management
  • Risk Management
  • Renko Charts
  • Crude Oil
  • Traders Psychology
  • Moving Average
  • Multibagger Stocks
  • Free Learning Modules:
  • Intraday Trading
  • Options Scalping
  • Swing Trading
  • Financial Modelling
  • RSI Indicator
  • Bollinger Bands
  • Pricing of Futures
  • Personal Finance
  • Initial Public Offerings (IPO)
  • Value Investing
  • Technical Indicators
  • Candlesticks
  • Chart Patterns
  • Option Greeks
  • ELSS Funds
  • Banking and Insurance
  • Real Estate
  • Gold
  • Book Summaries:
  • Rich Dad Poor Dad
  • Psychology of Money
  • The Intelligent Investor
  • The Richest Man in Babylon
  • Think and Trade Like a Champion
  • Value Investing and Behavioural Finance
  • Trading in the Zone
  • Learn to Earn
  • Book Summaries:
  • Rich Dad Poor Dad
  • Psychology of Money
  • The Intelligent Investor
  • The Richest Man in Babylon
  • Think and Trade Like a Champion
  • Value Investing and Behavioural Finance
  • Trading in the Zone
  • Learn to Earn
  • Tools:
  • CAGR Calculator
  • SIP Calculator
  • eLearnOptions
  • Future Value Calculator
  • Present Value Calculator
  • Atal Pension Yojana
  • Cost of Delay Calculator
  • Become a Crorepati
  • Tools:
  • CAGR Calculator
  • SIP Calculator
  • eLearnOptions
  • Future Value Calculator
  • Present Value Calculator
  • Atal Pension Yojana
  • Cost of Delay Calculator
  • Become a Crorepati

© 2025 Elearnmarkets. All Rights Reserved

  • Visit Elearnmarkets
  • Courses
  • Webinars
  • Financial Guides
  • Get Free Counselling
  • Visit Elearnmarkets
  • Courses
  • Webinars
  • Financial Guides
  • Get Free Counselling

Download Our App

No Result
View All Result
  • Article Categories
    • Basic Finance
    • Derivatives
    • Financial Planning
    • Fundamental Analysis
    • Technical Analysis
    • ETFs & Mutual Funds
    • Marketshala
    • Miscellaneous
  • Language
    • Hindi
    • Bengali
    • English
  • Courses
  • Webinars
  • Stories
Get Free Course

© 2024 Elearnmarkets All Rights Reserved

Guide to Basics of Stock Investing
Learn to interpret the financial performance and health of a company.
Download Guide For FREE
Guide Book on Investing with ₹ 5000
Learn about the Basics of Investments and Finance in this Ebook.
Download Guide For FREE
Trading Day 2025