Elearnmarkets - Financial Market Learning
  • Courses
  • Webinars
  • Stories
  • Language
    • English
    • Hindi
    • Bengali
No Result
View All Result
Get Free Course
  • Basic Finance
  • Derivatives
    • Futures
    • Options
  • Financial Planning
  • Fundamental Analysis
  • Technical Analysis
  • Mutual Funds
  • Marketshala
  • Miscellaneous
Elearnmarkets - Learn Stock Market, trading, investing for Free
  • Courses
  • Webinars
  • Stories
  • Language
    • English
    • Hindi
    • Bengali
No Result
View All Result
Get Free Course
Elearnmarkets - Learn Stock Market, trading, investing for Free
No Result
View All Result
Home Technical Analysis
Japanese Candlesticks

Understanding Japanese Candlestick Charts

Elearnmarkets by Elearnmarkets
November 18, 2025
in Technical Analysis, Charts, Patterns & Indicators
Reading Time: 7 mins read
3
4.1k
VIEWS
Share on FacebookShare on XShare on WhatsApp

Key Takeaways

  • Basics of Japanese Candlesticks: Understand how open, high, low, and close prices form each candle for any timeframe.
  • History & Origin: Learn how Munehisa Homma developed candlestick charting in 1700s Japan to predict prices.
  • Types & Structure: Know what real bodies, shadows, shaven heads, and shaven bottoms indicate about price action.
  • Bullish vs Bearish Signals: Identify how candle colours and shapes reflect market sentiment and trend direction.
  • Practical Use in Trading: See how traders use Japanese candlestick patterns for short-term analysis and spotting trend reversals.

Table Of Contents
  1. Key Takeaways
  2. Historical Background
  3. Anatomy of a Candlestick
  4. Timeframe Flexibility
  5. Interpreting Market Sentiment
  6. Practical Application
  7. Bottomline:
  8. Frequently Asked Questions (FAQs)

Japanese candlesticks represent one of the most enduring charting methods in technical analysis, with origins stretching back nearly three centuries.

These visual tools transform raw price data into easily interpretable patterns that help traders understand market psychology and predict potential price movements.

Historical Background

The candlestick methodology emerged in 18th-century Japan, specifically around 1750, when a prosperous rice merchant named Munehisa Homma began applying his analytical techniques at the Sakata Rice Exchange.

His success was remarkable. Historical accounts suggest he achieved over 100 consecutive profitable trades, building substantial wealth through his innovative approach to market analysis.

The terminology used in candlestick patterns reflects Japan’s military culture during that era. Pattern names such as “Three advancing white soldiers” and “counterattack lines” demonstrate this martial influence, adding a distinctive character to the analytical framework.

Anatomy of a Candlestick

Every candlestick visualizes four critical price points for a specific timeframe:

Japanese Candlestick infographics

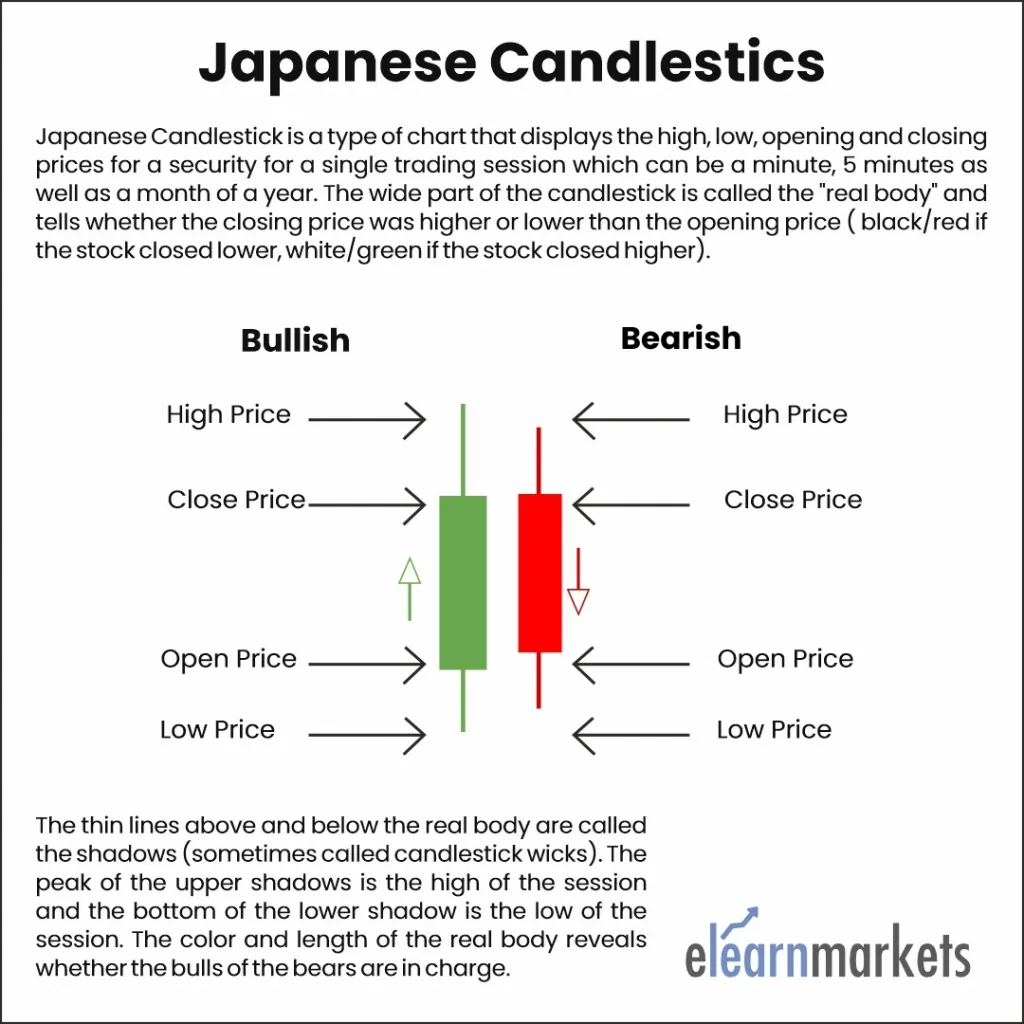
The Real Body: This rectangular section shows the relationship between opening and closing prices. The body’s position reveals which price was higher, opening or closing, providing immediate insight into directional movement during the period.

Color Coding: The body’s color conveys vital information about price direction. Green or white bodies indicate upward movement (closing price exceeded opening price), reflecting bullish activity. Conversely, red or black bodies show downward movement (closing price fell below opening price), signaling bearish pressure.

Shadows (Wicks): Thin lines extending from the body represent price extremes. The upper shadow marks the period’s highest price, while the lower shadow indicates the lowest price reached. These elements reveal volatility and rejected price levels.

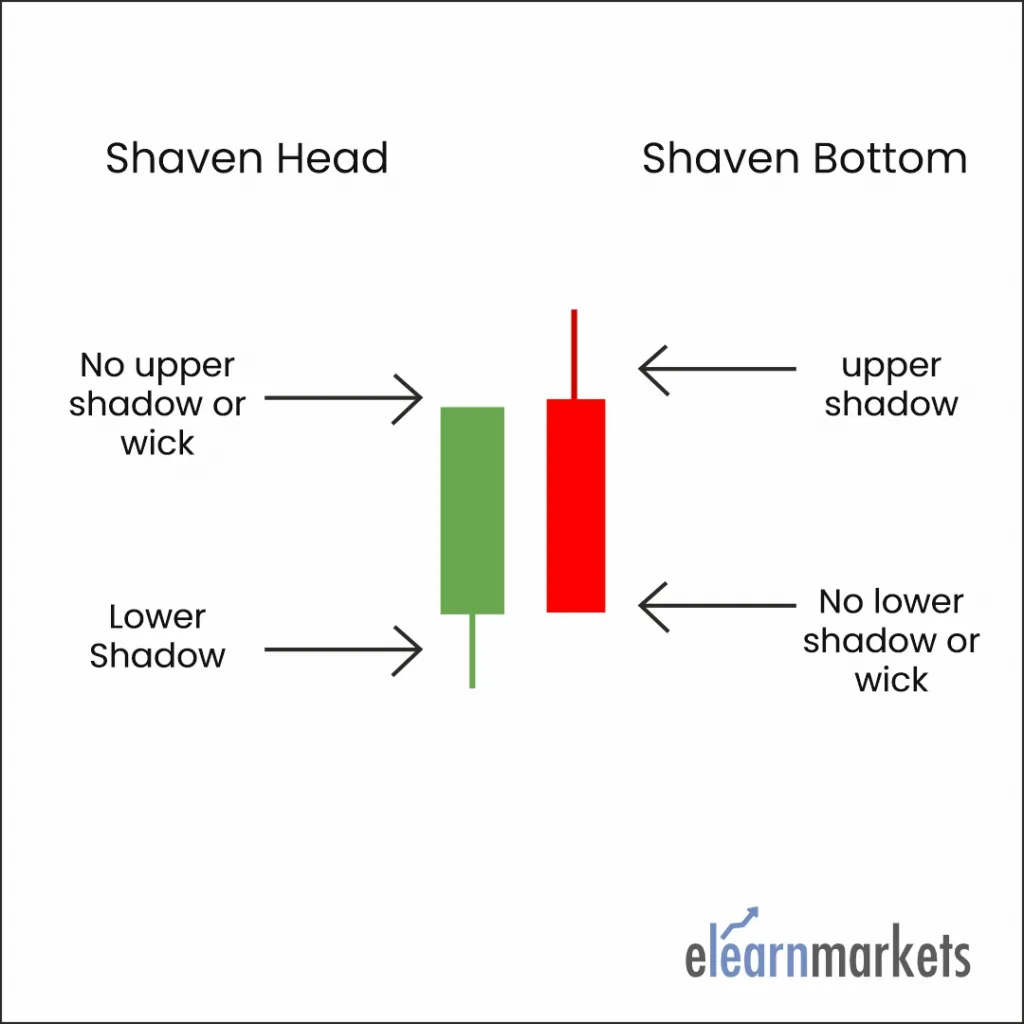
Special Formations: Candlesticks without upper shadows are termed “shaven heads,” while those lacking lower shadows are called “shaven bottoms.” These formations provide additional context about price behavior and momentum.

You can read about different candlestick patterns in our free e-book.

Timeframe Flexibility

Candlestick charts adapt to various trading styles and strategies. A single candlestick can represent price action across timeframes ranging from one minute to one month. This versatility has facilitated the growth of short-term trading approaches, enabling intraday and swing traders to analyze market movements with precision.

Interpreting Market Sentiment

Bullish Signals: When closing prices exceed opening prices, the resulting green or white candles suggest buyer dominance and positive momentum. These formations often appear during uptrends or at potential reversal points from declining markets.

Bearish Signals: Red or black candles, where closing prices fall below opening prices, indicate seller control and negative pressure. Such patterns frequently emerge during downtrends or when upward movements lose strength.

Shadow Analysis: Extended shadows reveal significant intraday volatility with ultimate rejection of extreme prices. Long upper shadows suggest selling pressure at higher levels, while long lower shadows indicate buying support at lower prices. Conversely, minimal or absent shadows demonstrate sustained directional conviction throughout the period. The line above the real body is the upper shadow, and the one that appears below is called the lower shadow. A candle having no upper shadow is said to have a shaven head, whereas one with no lower shadow is called a shaven bottom.

Shaven Head and Shaven Bottom candlestick patterns

Although the Japanese view the real body as the decisive price movement, shadows are mostly thought of as superfluous price fluctuations.

Also Read: Japanese Candlestick Pattern – MARUBOZU

Practical Application

While Japanese candlesticks display identical information to traditional bar charts, their visual presentation makes pattern recognition more intuitive. The graphical nature of candlesticks allows traders to quickly identify formation sequences associated with trend changes and continuation patterns.

The Japanese trading philosophy emphasizes the real body as the primary price movement, viewing shadows as secondary fluctuations. This perspective helps traders focus on the most significant price action when making decisions.

Candlestick analysis excels in short-term timeframe evaluation, making it particularly valuable for identifying immediate opportunities and potential trend reversals. Modern traders combine candlestick patterns with other technical tools to build comprehensive trading strategies that leverage both historical price structure and current market dynamics.

You can watch the video below to know more about Japanese Candlestick by watching the video below:

You can learn the patterns in detail with our Candlestick Course Online.

Bottomline:

You can also explore candlestick scans on the StockEdge app, where traders track real-time patterns to support intraday and swing decisions.

We hope that the above write-up has helped you to gain an understanding of  Japanese Candlestick.

Feel free to give your feedback by using the comment box below.

Learn more about Japanese Candlesticks in NSE Academy Certified Technical Analysis course on Elearnmarkets.

Happy Learning!!

Frequently Asked Questions (FAQs)

1. What do the colours of a candlestick represent?

Candlestick colours simply show whether the price moved up or down during that period. A green or white candle means the price closed higher than it opened, showing buying strength. A red or black candle means the price closed lower than it opened, showing selling pressure. Colours help traders quickly understand market sentiment.

2. What are bullish and bearish candlesticks?

A bullish candlestick forms when the price closes higher than it opened, showing that buyers were in control. A bearish candlestick forms when the price closes lower than it opened, showing selling pressure. Traders use these candles to understand whether the market is leaning towards buying or selling during that time.

3. What do long shadows or no shadows indicate in a candlestick chart?

Long shadows show that the price moved a lot within the period but couldn’t hold those levels, meaning there was rejection or volatility. A candle with no upper shadow suggests strong buying till the close, while no lower shadow shows steady selling. These signals help traders understand market strength or weakness more clearly.

ShareTweetSend
Previous Post

Spinning Tops and Doji, The Candles of Indecision

Next Post

Saas Bahu Angle In Investing

Elearnmarkets

Elearnmarkets

Elearnmarkets (ELM) is a complete financial market portal where the market experts have taken the onus to spread financial education. ELM constantly experiments with new education methodologies and technologies to make financial education effective, affordable and accessible to all. You can connect with us on Twitter @elearnmarkets.

Related Posts

Downside Tasuki Gap Candlestick pattern
Charts, Patterns & Indicators

Downside Tasuki Gap: Meaning, Formation & Guide

October 10, 2025
407
Greed and Fear Index
Trading Terms, Rules & Strategies

Greed and Fear Index: Definition, Function, and Benefits

September 11, 2025
729
Trump's Tariff Threat
Market Updates

Trump’s Tariffs: India’s Economic Resilience and Impact

August 8, 2025
505
Dabba Trading
Trading Terms, Rules & Strategies

Reality About Dabba Trading: Risks and Insights

August 8, 2025
653

Comments 3

  1. itclear says:
    6 years ago

    Good work!

    Reply
    • Sakshi Agarwal says:
      6 years ago

      Hi,

      Thank you for Reading!

      Keep reading!

      Reply
  2. frolep rotrem says:
    6 years ago

    I think you have observed some very interesting points, thanks for the post.

    Reply

Leave a Reply Cancel reply

Your email address will not be published. Required fields are marked *

Disclaimer

Elearnmarkets (Kredent InfoEdge Pvt. Ltd.) is a SEBI-registered Research Analyst (RA) entity (SEBI Registration No.: INH300007493). The information provided in this article is for educational and informational purposes only and should not be considered as an offer to buy or sell any securities or investment products.

The stocks, securities, and investment instruments mentioned herein are not recommendations under SEBI (Research Analysts) Regulations, 2014. Readers are advised to conduct their own due diligence and seek independent financial advice before making any investment decisions.

Investments in securities markets are subject to market risks. Please read all related documents carefully before investing. Investing in Equity Shares,
Derivatives, Mutual Funds, or other instruments carry inherent risks, including potential loss of capital. Elearnmarkets (Kredent InfoEdge Pvt. Ltd.) does not provide any guarantee or assurance of returns on any investments. Past performance is not indicative of future performance.

Elearnmarkets Logo

Follow Us

Facebook-f X-twitter Instagram Linkedin-in Youtube Telegram

Register on Elearnmarkets

Continue your financial learning by creating your own account on Elearnmarkets.com

Register Free Account

Download App

Playstore logo
Download on app store

Categories

  • Basic Finance
  • Derivatives
  • Financial Planning
  • Fundamental Analysis
  • Technical Analysis
  • Mutual Funds
  • Miscellaneous

Popular On Elearnmarkets

  • Market Superheroes:
  • Vivek Bajaj
  • Chetan Panchamia
  • Ashish Kyal
  • Premal Parekh
  • Abhijit Paul
  • Jegan
  • Sivakumar Jayachadran
  • Jyoti Budhia
  • Vivek Gadodia
  • Vishal Mehta
  • Piyush Chaudhry
  • Santosh Pasi
  • Gomathi Shankar
  • Market Superheroes:
  • Vivek Bajaj
  • Chetan Panchamia
  • Ashish Kyal
  • Premal Parekh
  • Abhijit Paul
  • Jegan
  • Sivakumar Jayachadran
  • Jyoti Budhia
  • Vivek Gadodia
  • Vishal Mehta
  • Piyush Chaudhry
  • Santosh Pasi
  • Gomathi Shankar
  • Courses:​
  • Options Trading
  • Dow Theory
  • Momentum Trading
  • Stock Investing
  • Harmonic Chart Patterns
  • Algo Trading
  • Elliot Wave Theory
  • Advanced Excel
  • Cryptocurrency
  • NSE Certification Course
  • Courses:​
  • Options Trading
  • Dow Theory
  • Momentum Trading
  • Stock Investing
  • Harmonic Chart Patterns
  • Algo Trading
  • Elliot Wave Theory
  • Advanced Excel
  • Cryptocurrency
  • NSE Certification Course
  • Webinars:
  • Bank Nifty Scalping
  • Intraday Trading Strategies
  • Options Trading Strategies
  • Options selling
  • Price Action
  • Relative Strength
  • Tax Planning
  • Options Buying
  • Growth Stocks
  • Portfolio Management
  • Risk Management
  • Renko Charts
  • Crude Oil
  • Traders Psychology
  • Moving Average
  • Multibagger Stocks
  • Free Learning Modules:
  • Intraday Trading
  • Options Scalping
  • Swing Trading
  • Financial Modelling
  • RSI Indicator
  • Bollinger Bands
  • Pricing of Futures
  • Personal Finance
  • Initial Public Offerings (IPO)
  • Value Investing
  • Technical Indicators
  • Candlesticks
  • Chart Patterns
  • Option Greeks
  • ELSS Funds
  • Banking and Insurance
  • Real Estate
  • Gold
  • Book Summaries:
  • Rich Dad Poor Dad
  • Psychology of Money
  • The Intelligent Investor
  • The Richest Man in Babylon
  • Think and Trade Like a Champion
  • Value Investing and Behavioural Finance
  • Trading in the Zone
  • Learn to Earn
  • Book Summaries:
  • Rich Dad Poor Dad
  • Psychology of Money
  • The Intelligent Investor
  • The Richest Man in Babylon
  • Think and Trade Like a Champion
  • Value Investing and Behavioural Finance
  • Trading in the Zone
  • Learn to Earn
  • Tools:
  • CAGR Calculator
  • SIP Calculator
  • eLearnOptions
  • Future Value Calculator
  • Present Value Calculator
  • Atal Pension Yojana
  • Cost of Delay Calculator
  • Become a Crorepati
  • Tools:
  • CAGR Calculator
  • SIP Calculator
  • eLearnOptions
  • Future Value Calculator
  • Present Value Calculator
  • Atal Pension Yojana
  • Cost of Delay Calculator
  • Become a Crorepati

© 2025 Elearnmarkets. All Rights Reserved

  • Visit Elearnmarkets
  • Courses
  • Webinars
  • Financial Guides
  • Get Free Counselling
  • Visit Elearnmarkets
  • Courses
  • Webinars
  • Financial Guides
  • Get Free Counselling

Download Our App

Deliver breaking news, insightful commentary, and exclusive reports. Targeting readers who rely on our platform to stay ahead.

Contact Benzinga
No Result
View All Result
  • Article Categories
    • Basic Finance
    • Derivatives
    • Financial Planning
    • Fundamental Analysis
    • Technical Analysis
    • ETFs & Mutual Funds
    • Marketshala
    • Miscellaneous
  • Language
    • Hindi
    • Bengali
    • English
  • Courses
  • Webinars
  • Stories
Get Free Course

© 2024 Elearnmarkets All Rights Reserved

A Handbook of Technical Analysis
To start your trading journey as a seasoned technical analyst
Download Guide For FREE
Guidebook On Chart Patterns
Take Your Trading To The Next Level With Strategies Shared In This Ebook
Download Guide For FREE