

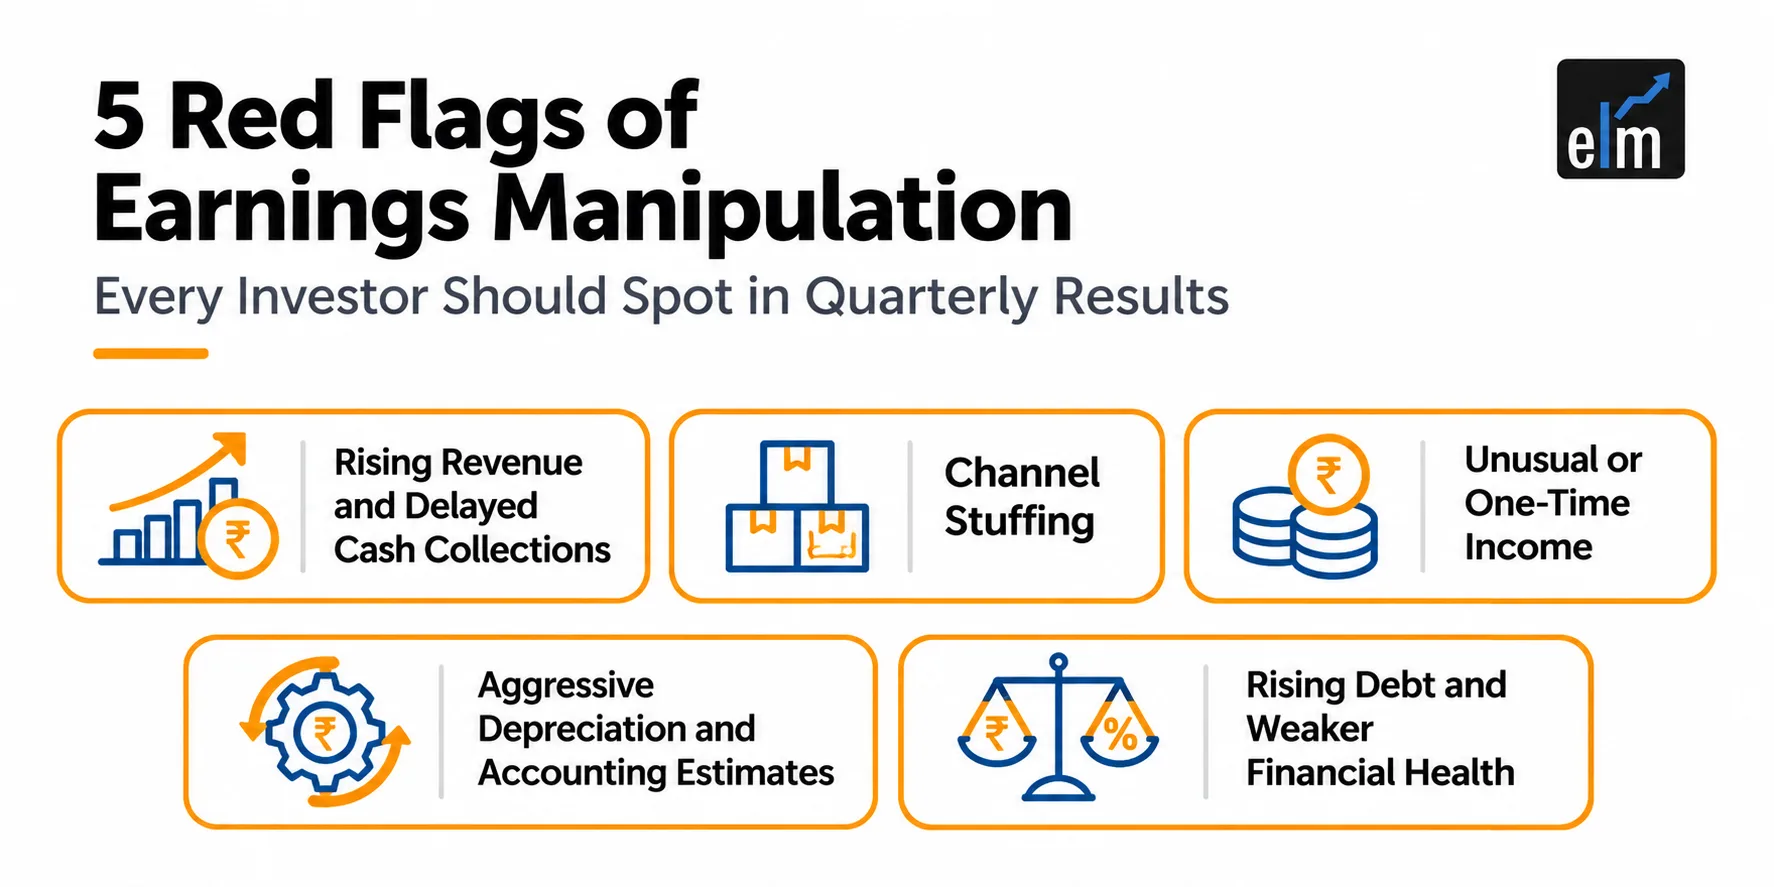

- The Earnings Season Trap, Why a Big Profit Number Doesn't Always Mean Good News
- Understanding Earnings Manipulation: How Companies Make Results Look Better
- Red Flag 1: Rising Revenue and Delayed Cash Collections
- Red Flag 2: Channel Stuffing
- Red Flag 3: Capitalising Expenses to Make Profits Look Bigger
- Red Flag 4: Related-Party Transactions and Diversion of Company Funds
- Red Flag 5: Notional Gains and Incorrect Accounting of Financial Instruments
- How to Detect Earnings Manipulation: An Investor's Checklist
- What Investors Should Read Beyond the Headline Results
- Conclusion
The Earnings Season Trap, Why a Big Profit Number Doesn’t Always Mean Good News
In March 2025, IndusInd Bank revealed a major problem in the way it had calculated profits from some of its derivative trades. An independent investigation found that the bank had recorded profits that it had not actually earned. The estimated impact of this error on the bank’s Profit & Loss Account was ₹1,959.98 crore as of March 31, 2025. This raised an important question: can investors always trust the profit figures reported by a company?
The truth is, a big profit number does not always mean a company is performing well. A business may report higher revenue and profits, but behind those numbers, customers may be delaying payments, inventory may be piling up, debt may be increasing or profits may be coming from unusual income rather than regular business activities. This is where earnings manipulation, whether deliberate or the result of faulty accounting, can hide behind an attractive headline.
This is why looking at revenue, net profit and Earnings Per Share (EPS) alone is not enough. Investors need to dig a little deeper into the financial statements to understand where the profits are coming from, whether the business is generating enough cash and whether its financial position is actually improving.
After all, a company can report an impressive quarter while hiding problems that may affect its future performance, and earnings manipulation of this kind is often noticed only later.
So, before celebrating the next big earnings announcement, let’s look beyond the headline numbers and understand five red flags of earnings manipulation that every investor should watch for while analysing quarterly results.
Understanding Earnings Manipulation: How Companies Make Results Look Better
Not every unusual accounting decision means a company is doing something wrong. Businesses have some flexibility in how they report their income, expenses and assets. The problem begins when this flexibility is used to make profits look higher, losses look smaller or the company’s financial position appears stronger than it really is. That is the point where earnings manipulation begins.
To understand earnings manipulation, it helps to know the difference between three types of accounting practices:
- Legitimate Accounting Choices: Companies can choose between different methods permitted by accounting rules. These choices are acceptable as long as they are applied correctly and clearly disclosed.
- Aggressive Accounting: Some companies use accounting choices in a way that makes their financial performance look better than it really is. Even when a method is technically allowed, the way it is used can give investors a misleading picture.
- Fraudulent Financial Reporting: This involves deliberately providing false or misleading financial information. Examples include recording sales that never happened, hiding expenses or overstating the value of assets.
What Do We Mean by Red Flags?
In simple terms, red flags of earnings manipulation are warning signs that something may not be right with a company’s financial performance. During earnings season, these signs may appear when reported profits, revenue or growth figures don’t match the actual picture of the business.
For example, a company may report higher profits, but its cash flow may be falling. Or its sales may be rising while customers are taking longer to make payments. Such gaps don’t automatically mean there is fraud or earnings manipulation, but they are reasons for investors to pause, ask questions and investigate further.
Now let’s look at five such earnings manipulation red flags that investors should watch for while analysing quarterly results, along with real-life company examples to understand how these warning signs can appear in financial statements.
Red Flag 1: Rising Revenue and Delayed Cash Collections
A company may report impressive sales growth, but there is a catch: has it actually collected the money from its customers? When sales are made on credit, the amount yet to be received is recorded as trade receivables. If these dues keep increasing or remain unpaid for too long, rising revenue may not translate into healthy cash flow. Inflated or uncollected sales are a common route for earnings manipulation, so receivables are one of the first places to look.
Case Study: Rajesh Exports, When Receivables Raise Questions
In June 2026, SEBI issued an interim order concerning Rajesh Exports following a complaint that raised questions about large outstanding trade receivables and the company’s financial reporting.
The order highlighted that trade receivables stood at approximately ₹4,894 crore in March 2022 before declining to around ₹2,501 crore by March 2024.
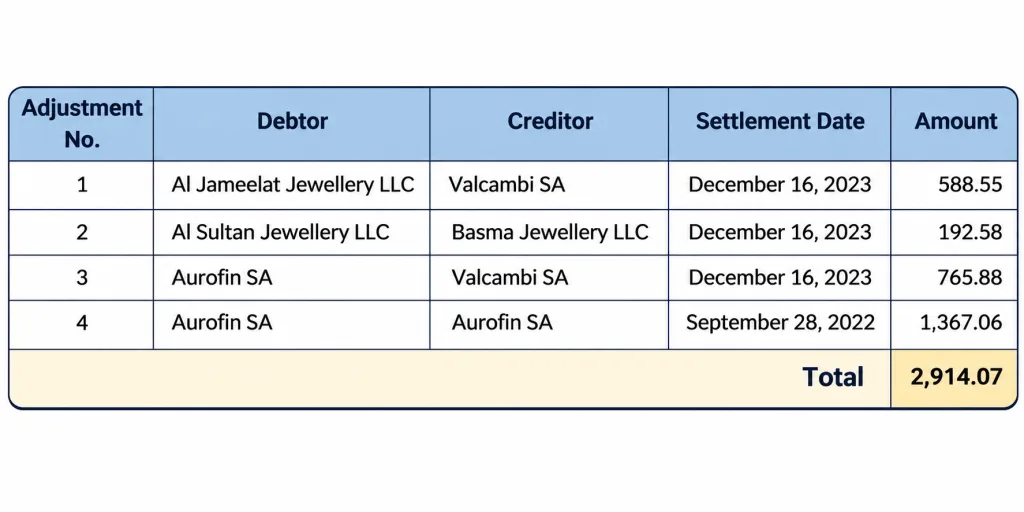
However, the investigation raised questions about how certain outstanding balances were settled. SEBI identified adjustments worth approximately ₹2,914.07 crore between trade receivables and trade payables rather than ordinary cash collections.
The order also discussed settlements involving different counterparties, old invoices without contemporaneous formal agreements and concerns regarding supporting documentation for certain sales and overseas subsidiary transactions. These were regulatory observations and allegations requiring appropriate consideration, rather than proof that every reported sale was fictitious. Even so, the case shows why unusual receivable settlements deserve scrutiny when checking for earnings manipulation.
Red Flag 2: Channel Stuffing
A company may report higher sales simply by pushing more products to distributors, even when actual customer demand has not increased. This practice, known as channel stuffing, is another form of earnings manipulation that investors should watch for.
In simple terms, products are sent to distributors in large quantities to record higher sales, but much of that stock may remain unsold. Eventually, distributors may struggle to clear the inventory, leading to returns, discounts and losses.
Case Study: Mamaearth (Honasa Consumer), The Excess Inventory Concern
In July 2024, distributors associated with Mamaearth raised concerns about excess inventory, alleging that they were holding 60–90 days of stock worth approximately ₹50–100 crore.
The products may have been supplied to distributors in quantities higher than actual market demand, possibly to boost reported sales. As a result, distributors were left holding more stock than they could sell within a normal period.
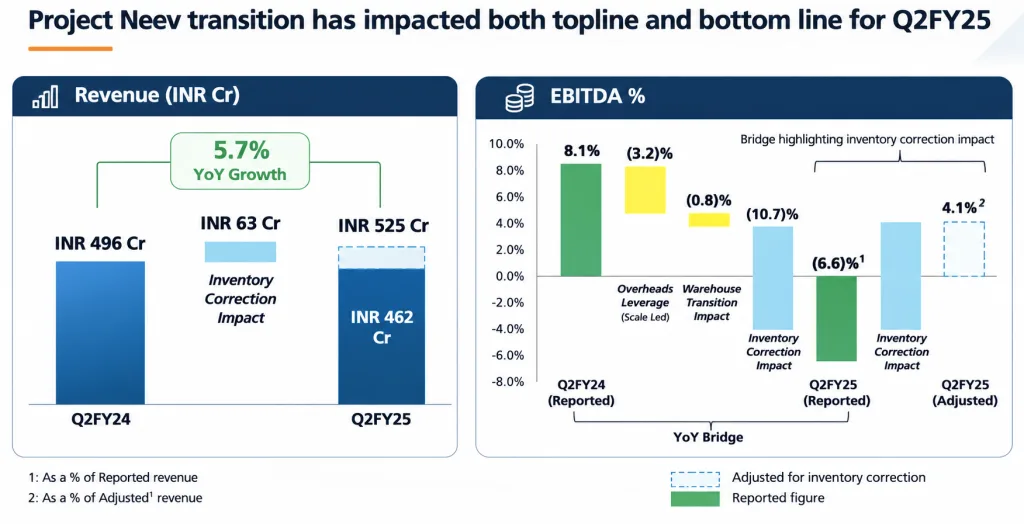
The issue raised questions about whether products were being pushed into the distribution network faster than they could be sold. Honasa disputed the allegations. Later, in Q2 FY25, the company undertook an inventory correction and wrote down approximately ₹62–65 crore of inventory. The adjustment contributed to a weaker reported performance, with revenue declining 7% year-on-year to approximately ₹460 crore and the company reporting a net loss of ₹18.5 crore. Inventory build-up is another area where earnings manipulation concerns can surface.
However, it is important to remember that excess inventory or concerns about channel stuffing do not automatically mean that a company has manipulated its sales. Investors need to look at other factors as well, such as the company’s revenue growth, distributor inventory levels, product returns, discounts and actual sales to customers. These indicators, when examined together over multiple quarters, can help investors understand whether the company is facing a temporary inventory issue or whether its reported sales are not reflecting actual market demand.
Red Flag 3: Capitalising Expenses to Make Profits Look Bigger
A company’s expenses directly affect its profitability. But what happens when an expense that should be recorded in the Profit & Loss Statement is instead treated as an asset?
This accounting practice is known as capitalisation, and it is a common area to check for earnings manipulation.
Capitalisation is a legitimate accounting practice when expenditure meets the recognition criteria for an asset under applicable accounting standards. For example, expenditure on eligible machinery or qualifying development activities may be capitalised and recognised as an asset.
However, the problem arises when expenses that should be recognised immediately are incorrectly recorded as assets. This is a classic technique of earnings manipulation.
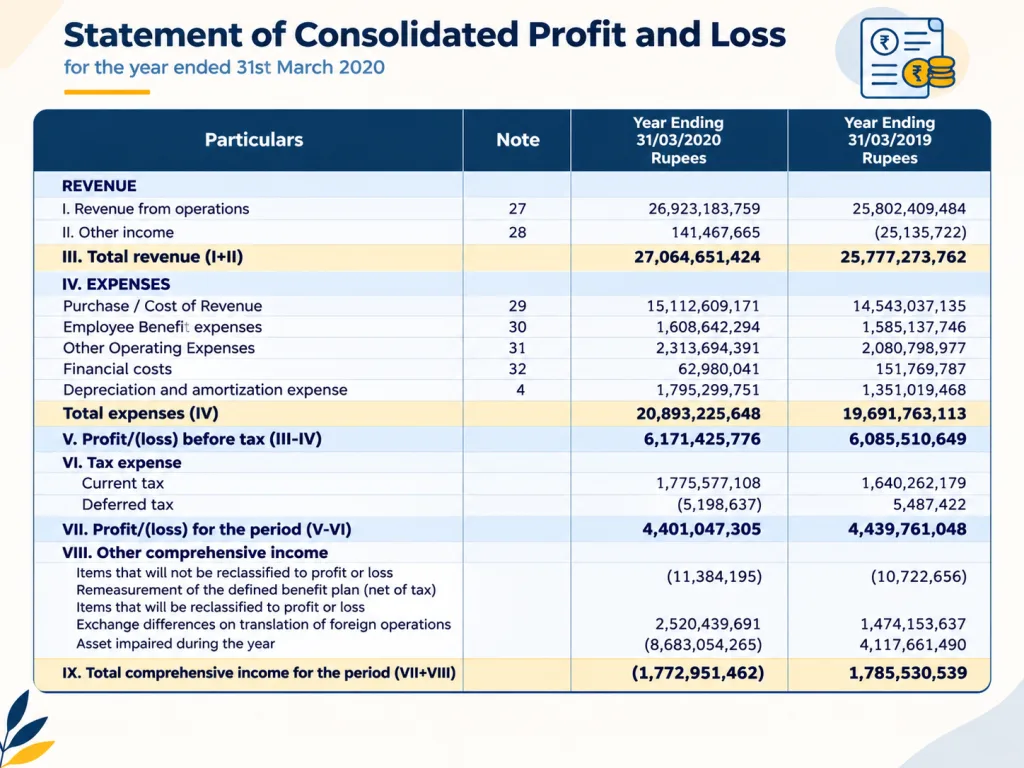
Case Study: Brightcom Group, When R&D Expenses Became Assets
A February 2025 SEBI final order concerning Brightcom Group highlighted the improper capitalisation of research and development (R&D) expenses.
SEBI found that the company had capitalised ₹504.49 crore of R&D expenditure that should have been recognised as expenses. These included costs relating to salaries, software, tools and hardware incurred during the research phase. By shifting these expenses from the Profit & Loss Statement to the balance sheet, the company reduced its reported expenses and artificially inflated its profits. The case shows how expense capitalisation can become a tool of earnings manipulation when applied incorrectly.

Red Flag 4: Related-Party Transactions and Diversion of Company Funds
A company may report strong financial results and raise a lot of money for expansion. But how is that money actually being used?
Investors should pay attention to related-party transactions, which are dealings between a company and its related parties, such as its subsidiaries, promoters or businesses connected to them. If these transactions are not clearly explained or the money is used for purposes other than those stated, it can put shareholders’ money at risk, and weak oversight of such dealings can make earnings manipulation harder to spot.
Case Study: Gensol Engineering, When Company Funds Raise Questions
SEBI’s July 2025 confirmatory order highlighted how funds raised for business purposes allegedly moved through connected entities.
Gensol had availed ₹977.75 crore in term loans from IREDA and PFC, of which ₹663.89 crore was intended for procuring 6,400 electric vehicles. However, the company had procured only 4,704 vehicles, costing ₹567.73 crore. SEBI identified ₹262.13 crore as unaccounted for against the expected deployment of funds.
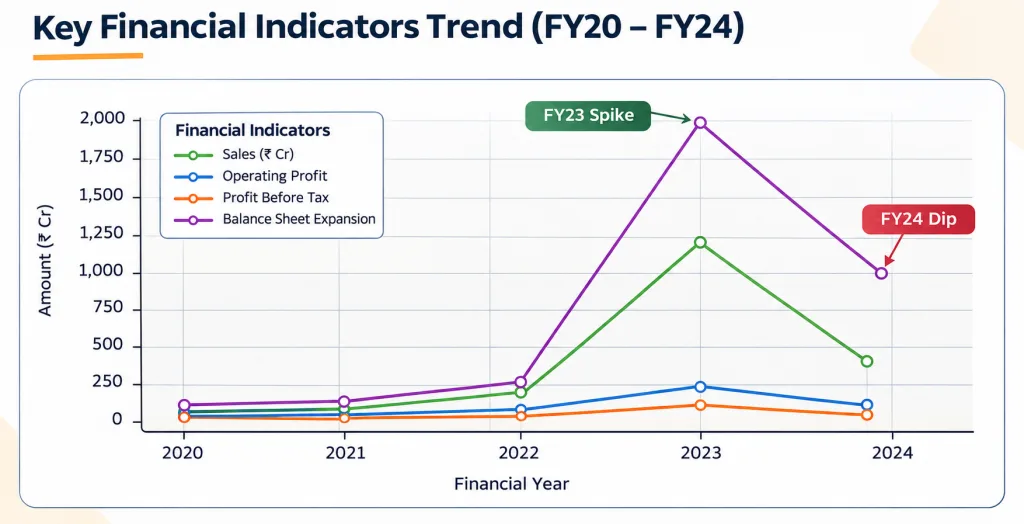
Apparently, sales, profits and balance sheet have been witnessing tremendous expansion which is briefly depicted as below:
The investigation also revealed that Gensol transferred ₹424.14 crore to Wellray Solar during FY23 and FY24, of which ₹382.84 crore was subsequently transferred by Wellray to other entities. This included ₹246.07 crore to related or linked parties of Gensol. SEBI also identified transfers of ₹25.76 crore and ₹13.55 crore to the company’s two promoters, respectively. Tracing where money finally lands is therefore a key step in any earnings manipulation check.
Red Flag 5: Notional Gains and Incorrect Accounting of Financial Instruments
Not every profit reported in a company’s financial statements represents money actually earned or received. Accounting for financial instruments, particularly derivative contracts, requires careful assessment. Incorrectly recording unrealised or notional gains as profits can overstate a company’s earnings and create a misleading picture of its financial performance, which is another face of earnings manipulation.
Case Study: IndusInd Bank, Incorrect Accounting of Internal Derivative Trades
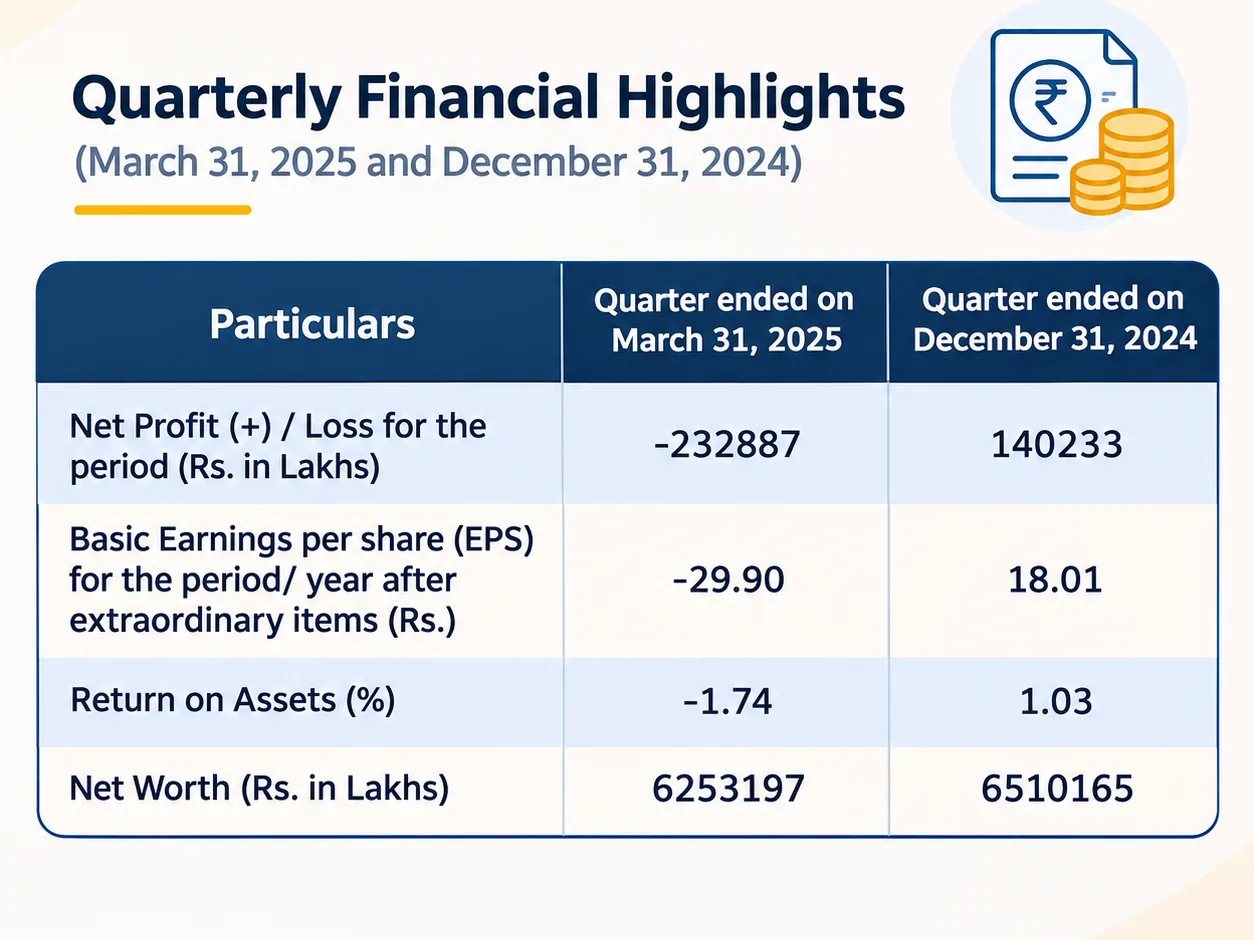
In April 2025, IndusInd Bank disclosed the findings of an independent investigation into accounting discrepancies involving its internal derivative trades. The investigation identified incorrect accounting of internal derivative trades, particularly in cases of early termination, as the principal cause of the discrepancy. This resulted in the recording of notional profits.
The investigation determined a cumulative adverse accounting impact on the bank’s profit and loss account of ₹1,959.98 crore as of March 31, 2025. The bank stated that it would reflect the resulting impact in its FY2024–25 financial statements and strengthen its internal controls. It had also discontinued internal derivative trades from April 1, 2024. The episode shows how weak accounting of financial instruments can distort the quality of earnings.
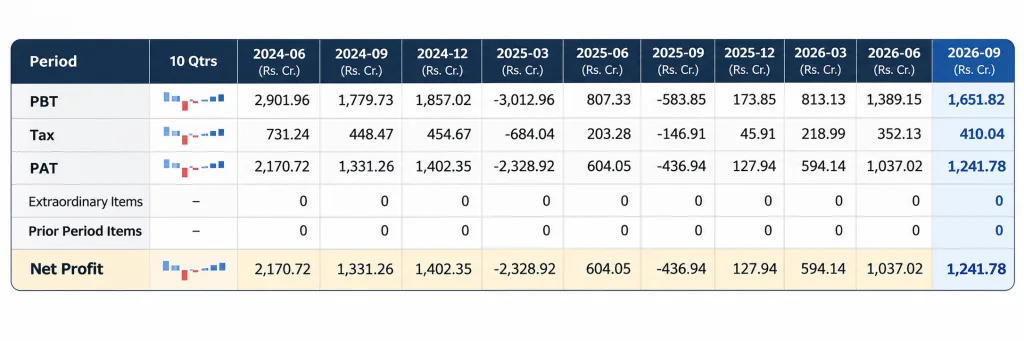
Impact on key profitability ratios of IIB: The net profit swung by negative 266.13%, reflecting a shift from a profit of ₹140,233 to a loss of ₹232,887 in one quarter. The basic EPS declined from 18.01 to a negative 29.90, Return on Assets decreased from 1.03 to negative 1.74 over a quarter. The net worth eroded by 3.947 percent
How to Detect Earnings Manipulation: An Investor’s Checklist
Before trusting a company’s quarterly results, take a closer look at these things to catch earnings manipulation early:
- Check whether receivables are rising much faster than sales, as this could mean customers are taking longer to pay.
- See whether the company is generating enough cash from its business to support its reported profits.
- Watch for rising inventory and longer payment periods, as these may point to trouble.
- Check whether profits are coming from regular business activities or one-time gains.
- Look for any concerns raised by auditors about the company’s financial statements.
- Review related-party transactions with promoters and related companies for unusual dealings.
- Compare quarterly results with previous years to see whether growth is consistent.
- Read management commentary and check whether it matches the actual financial performance.
What Investors Should Read Beyond the Headline Results
During earnings season, investors should look beyond headline revenue and profit figures. The documents below provide a clearer picture of a company’s financial health and business performance and help in spotting earnings manipulation early.
- The Profit & Loss Statement helps investors understand how much the company earns, spends and retains as profit.
- The Balance Sheet gives an overview of the company’s assets, liabilities and debt position.
- The Cash Flow Statement reveals whether reported profits are supported by actual cash generated from business operations.
- The Notes to Accounts provide additional details on accounting policies, unusual transactions and contingent liabilities.
- The Auditor’s Report and Limited Review Report highlight qualifications, financial reporting concerns and other observations made by auditors.
- Related-Party Transaction Disclosures reveal dealings with promoters, directors, subsidiaries and other connected entities.
- The Management Discussion and Analysis explains the company’s performance, business outlook, opportunities and key risks.
- The Quarterly Concall Transcript offers insights into management’s explanations, future plans, challenges and responses to analyst questions.
Conclusion
A company’s quarterly results tell more than just how much profit it has earned. Behind strong revenue and profit growth, there could be rising costs, lower provisions, one-time gains or accounting discrepancies.
As the case studies of earnings manipulation discussed in this article show, even reported profits deserve closer examination. Investors should look at the quality of earnings, cash flow generation, debt levels and accounting practices before drawing conclusions about a company’s financial health.
Ultimately, it is not just about how much a company earns, but how it earns it. Spotting earnings manipulation and understanding the numbers behind the headline results can help investors make more informed decisions.
FAQs
1. What is earnings manipulation?
Using accounting flexibility to make profits look higher, losses look smaller or the financial position look stronger than it really is.
2. What is financial results analysis?
Evaluating a company’s financial performance through revenue, profit, expenses and cash flows.
3. What is credit cost in a lender’s results?
The cost of covering potential loan losses due to defaults.
4. What does quality of earnings mean?
It measures how much profit comes from regular business operations rather than one-time gains.
5. Why can a stock fall after a profit jump?
Because of weak guidance, missed expectations, declining margins or one-time gains.