Elearnmarkets - Financial Market Learning
  • Courses
  • Webinars
  • Stories
  • Language
    • English
    • Hindi
    • Bengali
No Result
View All Result
Get Free Course
  • Basic Finance
  • Derivatives
    • Futures
    • Options
  • Financial Planning
  • Fundamental Analysis
  • Technical Analysis
  • Mutual Funds
  • Marketshala
  • Miscellaneous
Elearnmarkets - Learn Stock Market, trading, investing for Free
  • Courses
  • Webinars
  • Stories
  • Language
    • English
    • Hindi
    • Bengali
No Result
View All Result
Get Free Course
Elearnmarkets - Learn Stock Market, trading, investing for Free
No Result
View All Result
Home Technical Analysis
5 Momentum Trading Strategies

5 Momentum Trading Strategies to Ride the Market Waves Right

Vivek Bajaj by Vivek Bajaj
September 27, 2024
in Technical Analysis
Reading Time: 8 mins read
1
8.1k
VIEWS
Share on FacebookShare on XShare on WhatsApp

When it comes to trading in the trending market, the best way to gain from the momentum is to implement momentum trading strategies.

Momentum trading strategies help in identifying stocks that exhibit further momentum and ride the trend.

Momentum trading refers to entering a stock position as the price starts moving in either direction. It also helps in exiting the stock as soon as it starts declining.

In this blog, we will discuss five momentum trading strategies for gaining from the ongoing momentum in stocks or indices.

Table of Contents

  • 5 Momentum Trading Strategies
    • 1. Relative Strength Momentum
    • 2. Absolute Momentum
    • 3. Cross Asset Momentum
    • 4. Sector Momentum Strategy
    • 5. Price Momentum Trading Strategies- Breakout Strategy
  • Frequently Asked Questions (FAQs)
    • What is the best momentum strategy?
    • What is high momentum stocks?
    • Is momentum trading a profitable strategy?
  • Conclusion
    • Read More: All 35 Candlestick Chart Patterns in the Stock Market-Explained

5 Momentum Trading Strategies

Here are the 5 Momentum Trading Strategies-

1. Relative Strength Momentum

Relative Strength Momentum is one of the momentum trading strategies that helps identify stocks that have been outperforming the market or benchmark.

The RS Indicator helps to identify the strongest and weakest securities or asset classes within the financial market. Stocks that display strong or weak RS over a given period tend to continue. RS analysis can be applied to domestic or international stocks, stock indexes, fixed-income indexes, currencies, commodities, and other asset classes.

Relative Strength Momentum

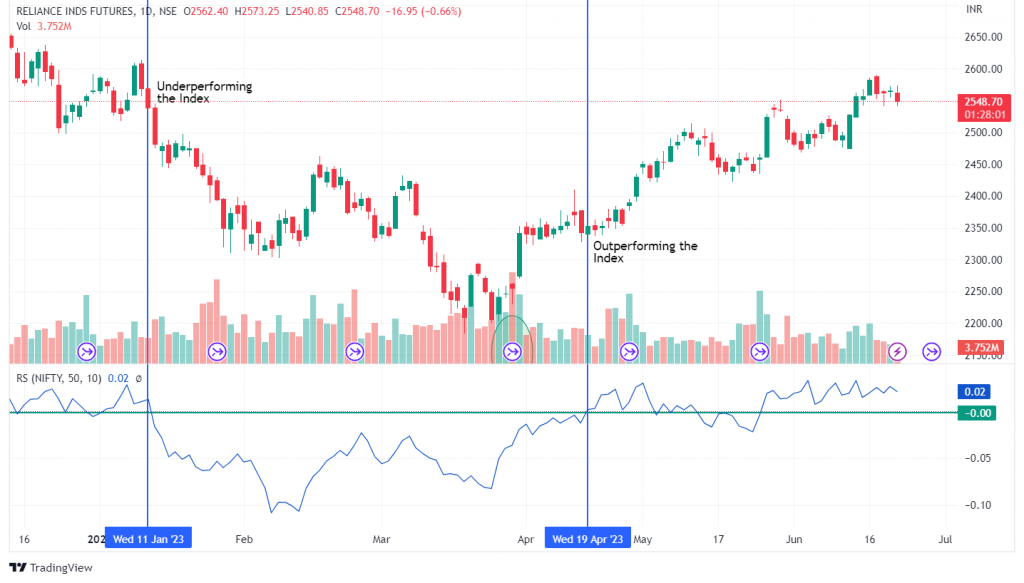
In the above daily chart of Reliance India Ltd, we have plotted the RS line (blue line) compared to the Nifty 50 for the last 50 periods.

When the RS line crosses above 0, the stock outperforms the Index, and when it crosses below 0, the stock is underperforming the Index. So, from the above chart, we can see that on 11th March, the RS line crossed the 0 line when the bearish phase of the stock started. This shows that the stock is getting weak and underperforming the Index as prices decrease.

Traders can short, ride the downtrend and gain profits until the RS line exceeds the 0 lines.

2. Absolute Momentum

A strategy known as absolute momentum assesses a security’s price in relation to its past performance. Trading using this strategy means that a trader should sell when the momentum is negative and purchase when it is positive.

A momentum trader might buy more shares of a stock, for instance, if its 12-month momentum is noticeably positive. In contrast, if the 12-month momentum was negative, a trader would short-sell shares.

3. Cross Asset Momentum

Additionally, traders can create cross-asset momentum trading strategies with passive exposures to the bond and equity markets and produce sizable, positive monthly alphas.

A diversified cross-asset momentum portfolio produces a Sharpe ratio that is about 70% higher than that of a similarly diversified buy-and-hold portfolio and 45% higher than that of an equally diversified time series momentum portfolio.

This is a momentum trading strategy in which the traders Identify the period to evaluate momentum (e.g., 3 months, 6 months, 12 months). Calculate the total return of each asset over the lookback period and Rank the assets based on their momentum, typically focusing on those with the highest positive momentum.

4. Sector Momentum Strategy

Finding and investing in market segments that are performing well at the time with the hope that this momentum will continue is known as a sector momentum strategy. This is one of the momentum trading strategies that takes advantage of the successful sectors’ propensity to continue outperforming throughout the short to medium term.

Traders can make a list of the sectors to watch. Technology, healthcare, finance, energy, consumer discretionary, and the industrial sector are among the frequently cited examples.

Sector Momentum Strategy

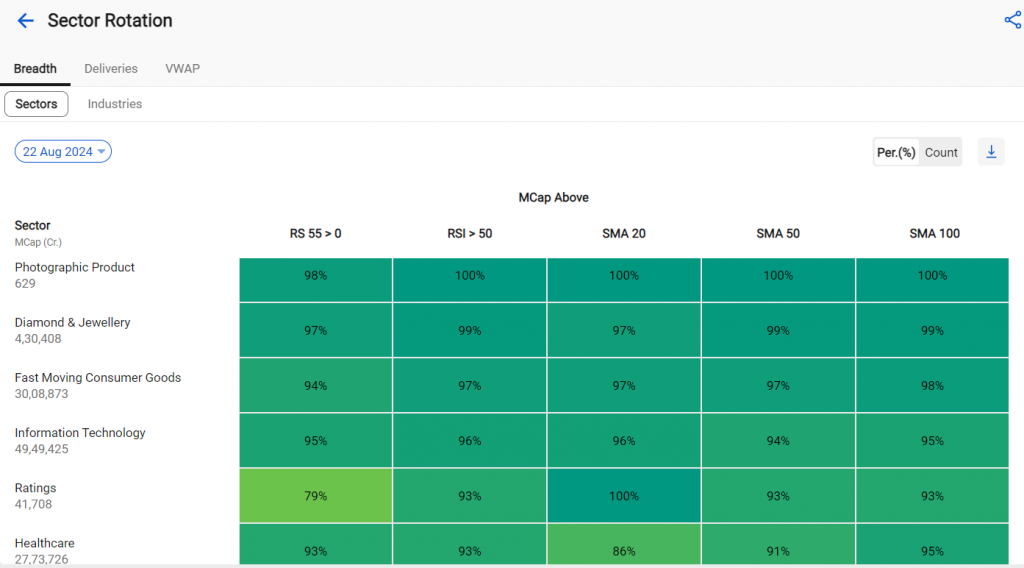
Sector rotation is a top-down investing strategy involving moving money from one industry sector to another in anticipation of different business cycle stages to beat the market.

It is just like the tactical asset allocation strategy, but instead of shifting asset classes and liquidity, money moves according to the expected performance of sectors. The prediction of Sector rotation is plausible because the market moves in reasonably predictable cycles, and a specific set of industries dominates a given market cycle.

5. Price Momentum Trading Strategies– Breakout Strategy

Breakout stocks are those shares that move beyond their support or resistance level. A key concept in technical analysis, i.e., breakouts, can indicate that a stock is about to make a major move.

So, if a stock moves above its resistance level, it will generally continue to make a sustained upward move. If it goes past its support level, it may continue on a bear run.

Support and resistance levels are often considered ‘stronger’ if a stock hits them multiple times. In turn, stocks that break through these ‘stronger’ levels usually show significant moves.

Stocks are not the only assets that break beyond support and resistance levels. Any financial asset, be it commodities, forex, or cryptocurrencies, can have breakouts from necessary support and resistance levels.

Frequently Asked Questions (FAQs)

What is the best momentum strategy?

Momentum trading is the practice of buying a stock as soon as its price starts to rise and selling it as soon as it starts to fall. This approach is predicated on the observation that stock prices frequently move in a single direction for extended periods of time and do not accurately reflect their underlying value.

What is high momentum stocks?

A stock with strong and consistent price movement in one direction over a brief period of time is considered to have high momentum.

Is momentum trading a profitable strategy?

Trading momentum can be beneficial, particularly for traders who are able to see trends quickly and take appropriate action. However, because market conditions can change quickly, it necessitates thorough analysis, prompt decision-making, and risk management.

Conclusion

It’s critical to realize that there is a significant amount of risk involved in momentum trading. Essentially, you are choosing to invest in a company or ETF based on what other market players have just purchased. There’s no assurance that the price will rise in response to continued buying demand. For instance, a development in the news could affect how investors see the market and trigger widespread selling. Alternatively, given that a large number of investors already have long positions in the stock or ETF, it’s probable that profit-taking on current holdings will overwhelm the entry of new buyers and drive prices lower.

Read More: All 35 Candlestick Chart Patterns in the Stock Market-Explained

Tags: basicenglishtechnical analysis
ShareTweetSend
Get Kotak Offer Get Kotak Offer Get Kotak Offer
Previous Post

Top 5 Scalping Trading Indicators

Next Post

How to Pick Stocks for Beginners

Vivek Bajaj

Vivek Bajaj

Mr. Vivek Bajaj has over 18 years of trading experience in equities, options, currencies, and commodity markets. He is the co-founder of Stockedge and Elearnmarkets and is passionate about data, analytics, and technology. He serves on various exchange committees and has played a significant role in the evolution of India's derivative market. He has been a speaker at various colleges and higher institutions, including IIT and IIMs.

Related Posts

Understand Slippage in Trading
Technical Analysis

What is Slippage in Trading? Meaning & Examples

March 28, 2025
305
Breakout trading strategies
Technical Analysis

Top 5 Breakout Trading Strategies

March 12, 2025
1.1k
5 stocks for today
Technical Analysis

5 Stocks to Buy Today That Could Beat the NIFTY in 2025!

May 5, 2025
401
Image describing What is marginal trading facility
Technical Analysis

 What is a Margin Trading Facility? Advantages & Risks

April 4, 2025
663

Comments 1

  1. Freeman Moyo says:
    9 months ago

    helpful

    Reply

Leave a Reply Cancel reply

Your email address will not be published. Required fields are marked *

Disclaimer

Elearnmarkets (Kredent InfoEdge Pvt. Ltd.) is a SEBI-registered Research Analyst (RA) entity (SEBI Registration No.: INH300007493). The information provided in this article is for educational and informational purposes only and should not be considered as an offer to buy or sell any securities or investment products.

The stocks, securities, and investment instruments mentioned herein are not recommendations under SEBI (Research Analysts) Regulations, 2014. Readers are advised to conduct their own due diligence and seek independent financial advice before making any investment decisions.

Investments in securities markets are subject to market risks. Please read all related documents carefully before investing. Investing in Equity Shares,
Derivatives, Mutual Funds, or other instruments carry inherent risks, including potential loss of capital. Elearnmarkets (Kredent InfoEdge Pvt. Ltd.) does not provide any guarantee or assurance of returns on any investments. Past performance is not indicative of future performance.

Elearnmarkets Logo

Follow Us

Facebook-f X-twitter Instagram Linkedin-in Youtube Telegram

Register on Elearnmarkets

Continue your financial learning by creating your own account on Elearnmarkets.com

Register Free Account

Download App

Playstore logo
Download on app store

Categories

  • Basic Finance
  • Derivatives
  • Financial Planning
  • Fundamental Analysis
  • Technical Analysis
  • Mutual Funds
  • Miscellaneous

Popular On Elearnmarkets

  • Market Superheroes:
  • Vivek Bajaj
  • Chetan Panchamia
  • Ashish Kyal
  • Premal Parekh
  • Abhijit Paul
  • Jegan
  • Sivakumar Jayachadran
  • Jyoti Budhia
  • Vivek Gadodia
  • Vishal Mehta
  • Piyush Chaudhry
  • Santosh Pasi
  • Gomathi Shankar
  • Market Superheroes:
  • Vivek Bajaj
  • Chetan Panchamia
  • Ashish Kyal
  • Premal Parekh
  • Abhijit Paul
  • Jegan
  • Sivakumar Jayachadran
  • Jyoti Budhia
  • Vivek Gadodia
  • Vishal Mehta
  • Piyush Chaudhry
  • Santosh Pasi
  • Gomathi Shankar
  • Courses:​
  • Options Trading
  • Dow Theory
  • Momentum Trading
  • Stock Investing
  • Harmonic Chart Patterns
  • Algo Trading
  • Elliot Wave Theory
  • Advanced Excel
  • Cryptocurrency
  • NSE Certification Course
  • Courses:​
  • Options Trading
  • Dow Theory
  • Momentum Trading
  • Stock Investing
  • Harmonic Chart Patterns
  • Algo Trading
  • Elliot Wave Theory
  • Advanced Excel
  • Cryptocurrency
  • NSE Certification Course
  • Webinars:
  • Bank Nifty Scalping
  • Intraday Trading Strategies
  • Options Trading Strategies
  • Options selling
  • Price Action
  • Relative Strength
  • Tax Planning
  • Options Buying
  • Growth Stocks
  • Portfolio Management
  • Risk Management
  • Renko Charts
  • Crude Oil
  • Traders Psychology
  • Moving Average
  • Multibagger Stocks
  • Free Learning Modules:
  • Intraday Trading
  • Options Scalping
  • Swing Trading
  • Financial Modelling
  • RSI Indicator
  • Bollinger Bands
  • Pricing of Futures
  • Personal Finance
  • Initial Public Offerings (IPO)
  • Value Investing
  • Technical Indicators
  • Candlesticks
  • Chart Patterns
  • Option Greeks
  • ELSS Funds
  • Banking and Insurance
  • Real Estate
  • Gold
  • Book Summaries:
  • Rich Dad Poor Dad
  • Psychology of Money
  • The Intelligent Investor
  • The Richest Man in Babylon
  • Think and Trade Like a Champion
  • Value Investing and Behavioural Finance
  • Trading in the Zone
  • Learn to Earn
  • Book Summaries:
  • Rich Dad Poor Dad
  • Psychology of Money
  • The Intelligent Investor
  • The Richest Man in Babylon
  • Think and Trade Like a Champion
  • Value Investing and Behavioural Finance
  • Trading in the Zone
  • Learn to Earn
  • Tools:
  • CAGR Calculator
  • SIP Calculator
  • eLearnOptions
  • Future Value Calculator
  • Present Value Calculator
  • Atal Pension Yojana
  • Cost of Delay Calculator
  • Become a Crorepati
  • Tools:
  • CAGR Calculator
  • SIP Calculator
  • eLearnOptions
  • Future Value Calculator
  • Present Value Calculator
  • Atal Pension Yojana
  • Cost of Delay Calculator
  • Become a Crorepati

© 2025 Elearnmarkets. All Rights Reserved

  • Visit Elearnmarkets
  • Courses
  • Webinars
  • Financial Guides
  • Get Free Counselling
  • Visit Elearnmarkets
  • Courses
  • Webinars
  • Financial Guides
  • Get Free Counselling

Download Our App

No Result
View All Result
  • Article Categories
    • Basic Finance
    • Derivatives
    • Financial Planning
    • Fundamental Analysis
    • Technical Analysis
    • ETFs & Mutual Funds
    • Marketshala
    • Miscellaneous
  • Language
    • Hindi
    • Bengali
    • English
  • Courses
  • Webinars
  • Stories
Get Free Course

© 2024 Elearnmarkets All Rights Reserved

A Handbook of Technical Analysis
To start your trading journey as a seasoned technical analyst
Download Guide For FREE
Trading Mentorship Program