Elearnmarkets - Financial Market Learning
  • Courses
  • Webinars
  • Stories
  • Language
    • English
    • Hindi
    • Bengali
No Result
View All Result
Get Free Course
  • Basic Finance
  • Derivatives
    • Futures
    • Options
  • Financial Planning
  • Fundamental Analysis
  • Technical Analysis
  • Mutual Funds
  • Marketshala
  • Miscellaneous
Elearnmarkets - Learn Stock Market, trading, investing for Free
  • Courses
  • Webinars
  • Stories
  • Language
    • English
    • Hindi
    • Bengali
No Result
View All Result
Get Free Course
Elearnmarkets - Learn Stock Market, trading, investing for Free
No Result
View All Result
Home Technical Analysis
Alligator Indicator

How to get spot trending moves using Alligator indicator?

Elearnmarkets by Elearnmarkets
August 23, 2023
in Technical Analysis, Charts, Patterns & Indicators
Reading Time: 5 mins read
5
17.3k
VIEWS
Share on FacebookShare on XShare on WhatsApp

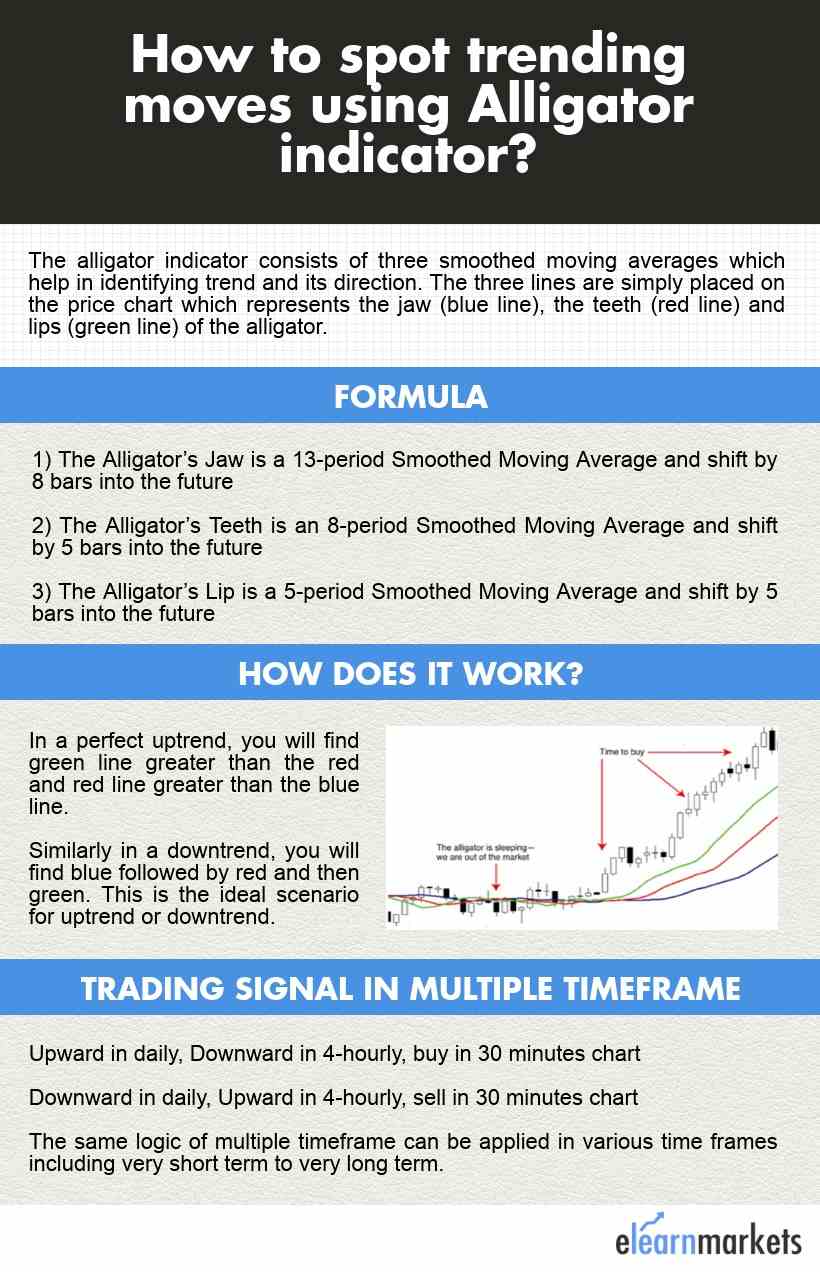
The alligator indicator developed by Bill Williams consists of three smoothed moving averages which help in identifying a trend and its direction.

The three lines are simply placed on the price chart which represents the jaw (blue line), the teeth (red line) and lips (green line) of the alligator.

When three lines are twisted together, it is implied that the beast is sleeping and its mouth is closed.

However, when it enters into a trend, it wakes up and starts eating and again it goes back to sleep mode. This is how the process continues.

Table of Contents
Alligator Indicator Formula
Trading signal in Multiple Time frame
Bottomline

In a perfect uptrend, you will find green greater than the red and redline greater than the blue line.

Similarly, in a downtrend, you will find blue followed by red and then green.

This is the ideal scenario for uptrend or downtrend.

You should always enter the trade when it is entering into a particular trend and avoid when these lines are twisted together.

Alligator Indicator Formula

The Alligator indicator is easily available on various charting platforms and it is done using the following steps-

1)    The Alligator’s Jaw (Blue line) is a 13-period Smoothed Moving Average and shift by 8 bars into the future

Know More: How to trade using moving average on different timeframes?

2)    The Alligator’s Teeth (Red” line) is an 8-period Smoothed Moving Average and shift by 5 bars into the future

3)    The Alligator’s Lips (Green line), is a 5-period Smoothed Moving Average and shift by 5 bars into the future

How to spot tradning moves using alligator indicator

Trading signal in multiple time frame

Look for proper trading setup in the daily time frame whether on the upside or downside.

Say you identified the buy or sell setup in daily time frame but due to lag you may miss the initial move.

Also read: 5 important uses of RSI

Aligator daily signal


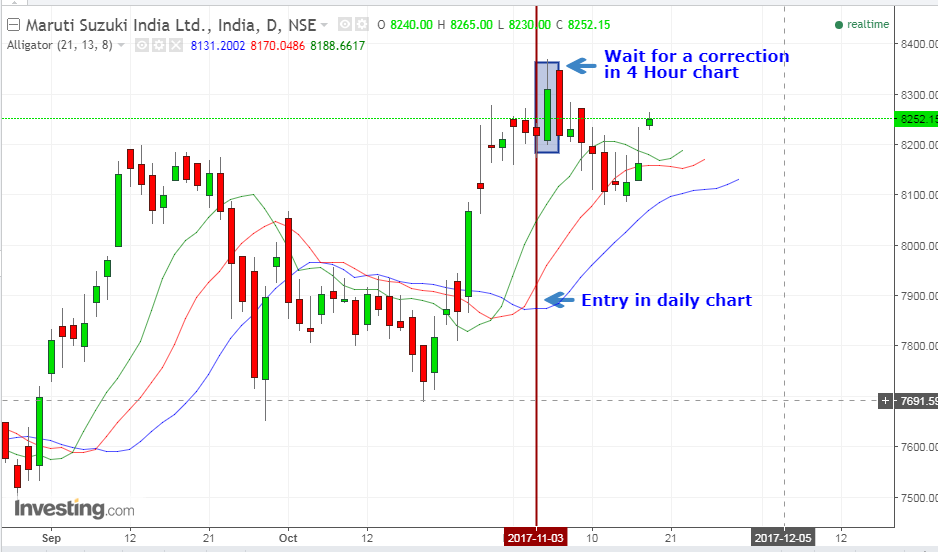
But as you know that price does not move in a straight line but moves in a series of peaks and troughs.

So you may aim to enter a wave in a smaller time frame say 4 hours in a different direction to find a good entry point.

Here you will wait for the alligator to move against the daily signal.

In simple words, you are looking for a wave inside the flow to identify the move in a different direction so as to identify a proper entry point.

Aligator 4 hour chart signal

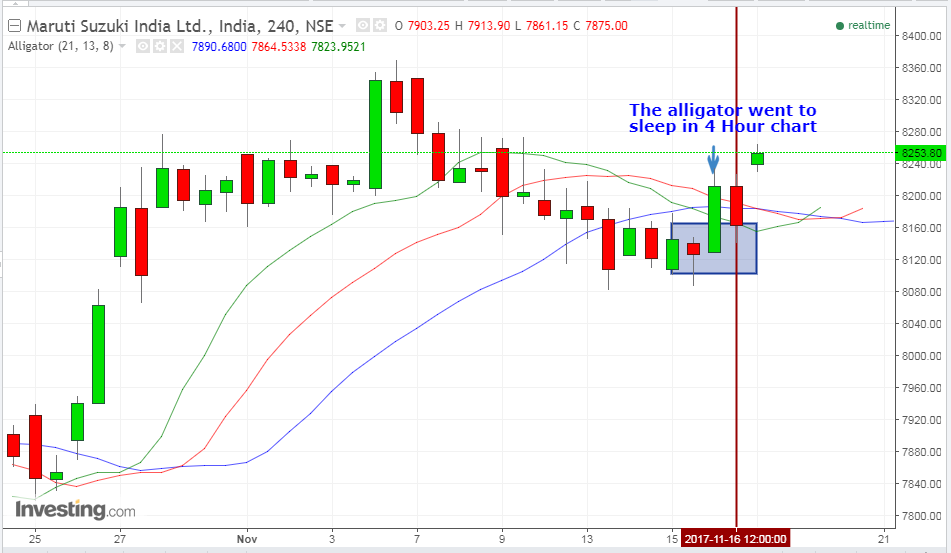
You found the uptrend in the daily timeframe so you will wait for the downtrend in 4 Hour chart.

Similarly, once you identified downtrend in daily, you will look for the uptrend in 4 Hour chart.

This is simply to look for proper entry along the trend.

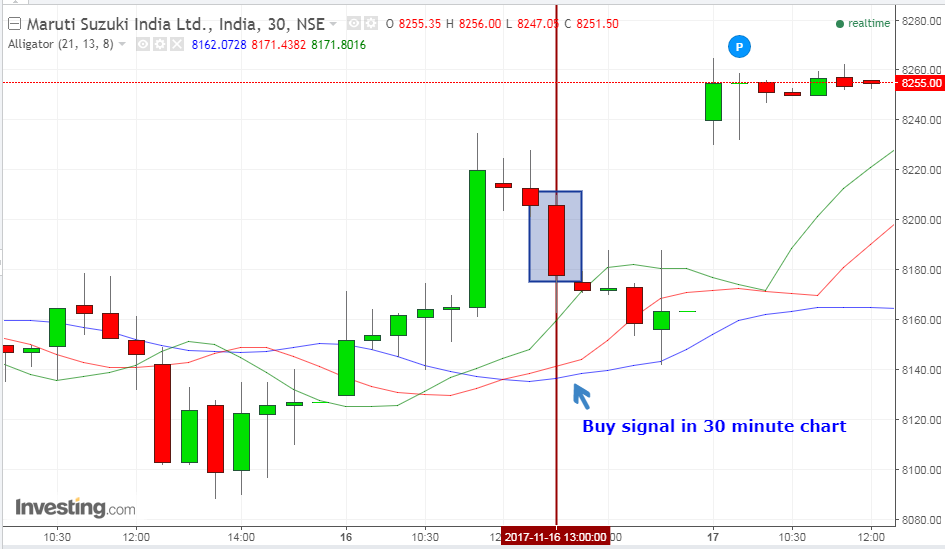
But as it bounced back in 4-hour chart, you will make your entry in the 30-minute chart when the alligator gives a positive or negative crossover as the case may be.

Alligator 30 minute chart

To simplify:

Upward in daily, Downward in 4-hourly, buy in 30 minutes chart

Downward in daily, Upward in 4-hourly, sell in 30 minutes chart

The same logic of multiple timeframes can be applied in various time frames including a very short- term to very long term.

Bottomline

You may combine Alligator indicator with a momentum-based indicator like CCI to enhance your trading experience and to get better trading signals.

Say when the alligator awakes and you found that CCI has already entered the overbought area (i.e. above +100) so its an early indication that the uptrend is likely to continue and with speed.

Like all the moving averages, the alligator is a lagging indicator.

Such a lag in getting a trade signal leads to a partial loss of profit.

Further, this lag functions as a filter and helps eliminate insignificant and false signals.

Tags: alligator indicatorenglishtechnical analysis
ShareTweetSend
Get Kotak Offer Get Kotak Offer Get Kotak Offer
Previous Post

Bank Nifty Set To Make an Upward Move

Next Post

Nifty opened gap up on account of Moody’s upgradation of sovereign rating

Elearnmarkets

Elearnmarkets

Elearnmarkets (ELM) is a complete financial market portal where the market experts have taken the onus to spread financial education. ELM constantly experiments with new education methodologies and technologies to make financial education effective, affordable and accessible to all. You can connect with us on Twitter @elearnmarkets.

Related Posts

Understand Slippage in Trading
Technical Analysis

What is Slippage in Trading? Meaning & Examples

March 28, 2025
299
Breakout trading strategies
Technical Analysis

Top 5 Breakout Trading Strategies

March 12, 2025
1.1k
5 stocks for today
Technical Analysis

5 Stocks to Buy Today That Could Beat the NIFTY in 2025!

May 5, 2025
400
Image describing What is marginal trading facility
Technical Analysis

 What is a Margin Trading Facility? Advantages & Risks

April 4, 2025
662

Comments 5

  1. abhi says:
    7 years ago

    Good Info..

    Reply
  2. Krishna Kishore Reddy Arumalla says:
    6 years ago

    Hi there!
    “The Alligator’s Jaw (Blue line) is a 13-period Smoothed Moving Average and shift by 8 bars into the future”
    would you please help me out here how to perform shift by 8 bars into future??
    I am really struck on my back testing using data in Excel.

    Thank you.
    Krishna.

    Reply
    • Sakshi Agarwal says:
      6 years ago

      Hi Krishna,

      This strategy is already explained in the blog itself.

      Thank you for Reading!

      Keep Reading!

      Reply
  3. riya says:
    5 years ago

    Nice very helpful blog

    Reply
    • Sakshi Agarwal says:
      5 years ago

      Hi,

      Thank you for reading our blog!!

      Keep Reading!

      Reply

Leave a Reply Cancel reply

Your email address will not be published. Required fields are marked *

Disclaimer

Elearnmarkets (Kredent InfoEdge Pvt. Ltd.) is a SEBI-registered Research Analyst (RA) entity (SEBI Registration No.: INH300007493). The information provided in this article is for educational and informational purposes only and should not be considered as an offer to buy or sell any securities or investment products.

The stocks, securities, and investment instruments mentioned herein are not recommendations under SEBI (Research Analysts) Regulations, 2014. Readers are advised to conduct their own due diligence and seek independent financial advice before making any investment decisions.

Investments in securities markets are subject to market risks. Please read all related documents carefully before investing. Investing in Equity Shares,
Derivatives, Mutual Funds, or other instruments carry inherent risks, including potential loss of capital. Elearnmarkets (Kredent InfoEdge Pvt. Ltd.) does not provide any guarantee or assurance of returns on any investments. Past performance is not indicative of future performance.

Elearnmarkets Logo

Follow Us

Facebook-f X-twitter Instagram Linkedin-in Youtube Telegram

Register on Elearnmarkets

Continue your financial learning by creating your own account on Elearnmarkets.com

Register Free Account

Download App

Playstore logo
Download on app store

Categories

  • Basic Finance
  • Derivatives
  • Financial Planning
  • Fundamental Analysis
  • Technical Analysis
  • Mutual Funds
  • Miscellaneous

Popular On Elearnmarkets

  • Market Superheroes:
  • Vivek Bajaj
  • Chetan Panchamia
  • Ashish Kyal
  • Premal Parekh
  • Abhijit Paul
  • Jegan
  • Sivakumar Jayachadran
  • Jyoti Budhia
  • Vivek Gadodia
  • Vishal Mehta
  • Piyush Chaudhry
  • Santosh Pasi
  • Gomathi Shankar
  • Market Superheroes:
  • Vivek Bajaj
  • Chetan Panchamia
  • Ashish Kyal
  • Premal Parekh
  • Abhijit Paul
  • Jegan
  • Sivakumar Jayachadran
  • Jyoti Budhia
  • Vivek Gadodia
  • Vishal Mehta
  • Piyush Chaudhry
  • Santosh Pasi
  • Gomathi Shankar
  • Courses:​
  • Options Trading
  • Dow Theory
  • Momentum Trading
  • Stock Investing
  • Harmonic Chart Patterns
  • Algo Trading
  • Elliot Wave Theory
  • Advanced Excel
  • Cryptocurrency
  • NSE Certification Course
  • Courses:​
  • Options Trading
  • Dow Theory
  • Momentum Trading
  • Stock Investing
  • Harmonic Chart Patterns
  • Algo Trading
  • Elliot Wave Theory
  • Advanced Excel
  • Cryptocurrency
  • NSE Certification Course
  • Webinars:
  • Bank Nifty Scalping
  • Intraday Trading Strategies
  • Options Trading Strategies
  • Options selling
  • Price Action
  • Relative Strength
  • Tax Planning
  • Options Buying
  • Growth Stocks
  • Portfolio Management
  • Risk Management
  • Renko Charts
  • Crude Oil
  • Traders Psychology
  • Moving Average
  • Multibagger Stocks
  • Free Learning Modules:
  • Intraday Trading
  • Options Scalping
  • Swing Trading
  • Financial Modelling
  • RSI Indicator
  • Bollinger Bands
  • Pricing of Futures
  • Personal Finance
  • Initial Public Offerings (IPO)
  • Value Investing
  • Technical Indicators
  • Candlesticks
  • Chart Patterns
  • Option Greeks
  • ELSS Funds
  • Banking and Insurance
  • Real Estate
  • Gold
  • Book Summaries:
  • Rich Dad Poor Dad
  • Psychology of Money
  • The Intelligent Investor
  • The Richest Man in Babylon
  • Think and Trade Like a Champion
  • Value Investing and Behavioural Finance
  • Trading in the Zone
  • Learn to Earn
  • Book Summaries:
  • Rich Dad Poor Dad
  • Psychology of Money
  • The Intelligent Investor
  • The Richest Man in Babylon
  • Think and Trade Like a Champion
  • Value Investing and Behavioural Finance
  • Trading in the Zone
  • Learn to Earn
  • Tools:
  • CAGR Calculator
  • SIP Calculator
  • eLearnOptions
  • Future Value Calculator
  • Present Value Calculator
  • Atal Pension Yojana
  • Cost of Delay Calculator
  • Become a Crorepati
  • Tools:
  • CAGR Calculator
  • SIP Calculator
  • eLearnOptions
  • Future Value Calculator
  • Present Value Calculator
  • Atal Pension Yojana
  • Cost of Delay Calculator
  • Become a Crorepati

© 2025 Elearnmarkets. All Rights Reserved

  • Visit Elearnmarkets
  • Courses
  • Webinars
  • Financial Guides
  • Get Free Counselling
  • Visit Elearnmarkets
  • Courses
  • Webinars
  • Financial Guides
  • Get Free Counselling

Download Our App

No Result
View All Result
  • Article Categories
    • Basic Finance
    • Derivatives
    • Financial Planning
    • Fundamental Analysis
    • Technical Analysis
    • ETFs & Mutual Funds
    • Marketshala
    • Miscellaneous
  • Language
    • Hindi
    • Bengali
    • English
  • Courses
  • Webinars
  • Stories
Get Free Course

© 2024 Elearnmarkets All Rights Reserved

A Handbook of Technical Analysis
To start your trading journey as a seasoned technical analyst
Download Guide For FREE
Guidebook On Chart Patterns
Take Your Trading To The Next Level With Strategies Shared In This Ebook
Download Guide For FREE
Trading Mentorship Program