The Choppiness index is a volatility indicator which is designed to determine trendiness of market only and not to predict future price direction.
It was developed by Australian commodity trader Bill Dreiss which simply indicates whether the market is trending (not choppy) or ranging (choppy).
The values basically range between 0 and 100, with low value signaling a strong trend (directional trending) and a high value indicating consolidation.
| Table of Contents |
|---|
| Choppiness Index Formula |
| Trading signals |
| Trading strategy using Choppiness Index, RSI, and ADX |
| Conclusion |
Choppiness Index Formula
Choppiness Index= 100 * Log10 {Sum (True Range, n)} / [Maximum (True High, n) – Minimum (True Low, n)]} / Log10 (n)
Trading signals
The default setting used is 14 days.
Traders generally use Fibonacci values as extremes for a choppy and trending market:
1. The value above 61.8 (higher threshold) indicates consolidation.
2. The value below 38.2 (lower threshold) signal a trend.
Though Choppiness index measures the status of the current trend, but it often lags the actual trend.
As long as it stays above mid 50 line, the trend continues to be choppy.
On the other hand, if it stays below the midline, it remains trending.
Let’s understand this with an example.
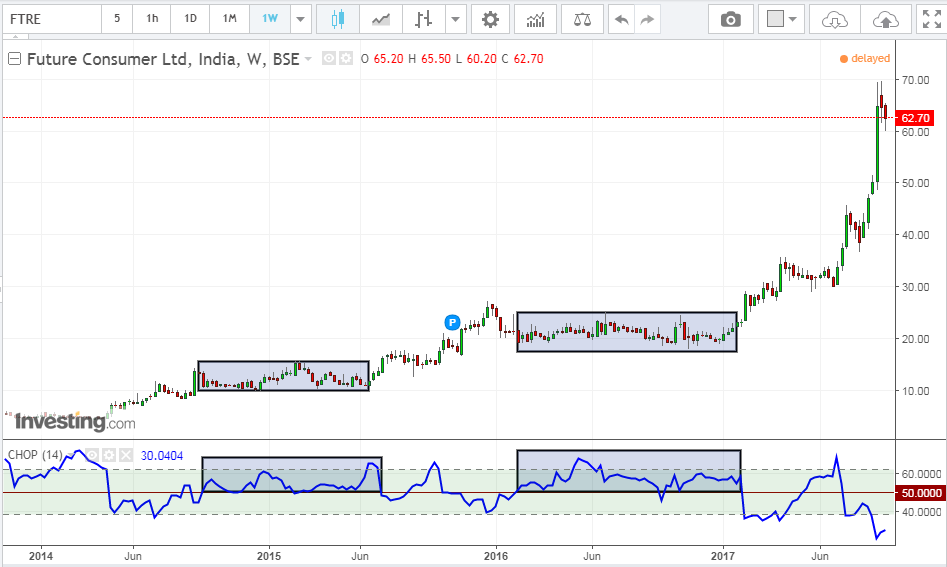
The above is the weekly chart of Future consumer and we can see that whenever the stock was above the mid 50 line, the trend continued to be choppy.
The traders who are unable to devote much time in analyzing charts of various securities may benefit from scan section in StockEdge mobile app.
Watch the video below to know how to use the daily update section of the StockEdge App in a better manner:
Trading strategy using Choppiness Index, RSI, and ADX
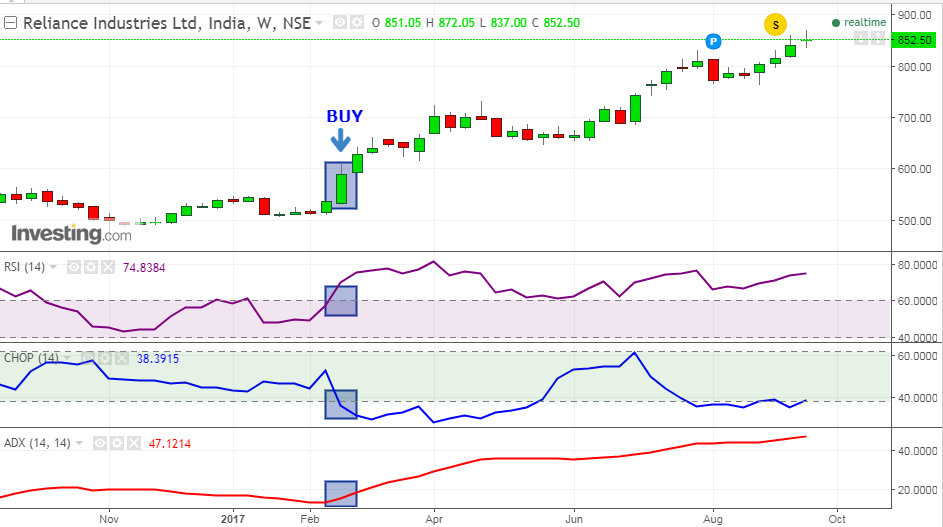
In this strategy, we combine RSI, choppiness index and ADX to generate buy or sell signal. A buy signal is generated when-
1. RSI is above 60
2. Choppiness Index closes below the lower threshold level of 38.2.
3. Simultaneously, ADX cuts 20 level from below
Also Read: Trade RSI using the Andrew Cardwell way
Below is the weekly chart of Reliance Industries, and as we can see that when all the above conditions were satisfied, the stock gave a strong upside rally.
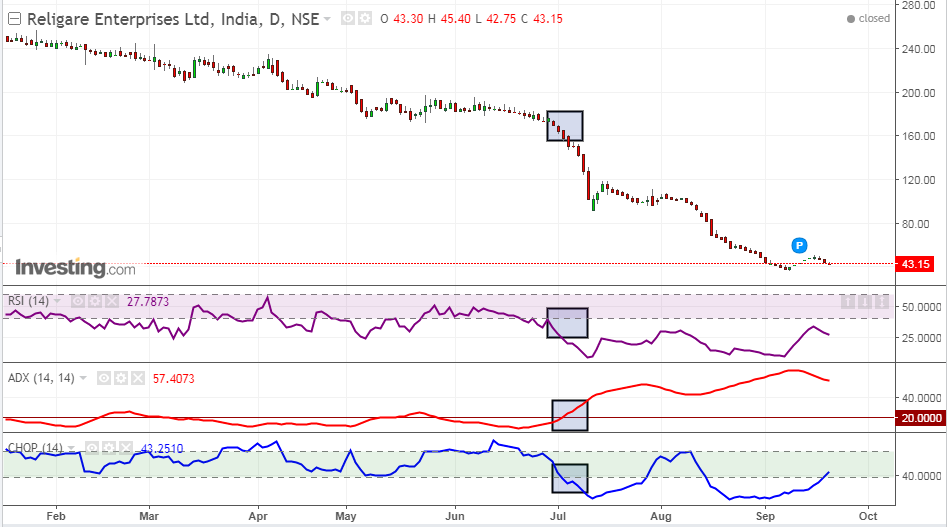
Similarly, sell signal is generated when the following conditions are satisfied-
1. RSI is above 40
2. Choppiness Index closes below the lower threshold level of 38.2.
3. Simultaneously, ADX cuts 20 level from below
The below is the daily chart of Religare Enterprises and as we can see that when all the above condition were met, the stock witnessed strong fall.
Read More: How to trade using Larry Connor’s 2-period RSI?
Conclusion
The Choppiness index is a very interesting tool which helps in identifying trends and ranges.
It is often seen that extended period of consolidation and is often followed by an extended period of trending and vice versa.
However, we should not use Choppiness Index in isolation rather it should be used in conjunction with a traditional pattern or other indicators or oscillators to get confirmed buy or sell signal.




very useful
Hi,
Thank you for reading our blog!!
Keep Reading!