Elearnmarkets - Financial Market Learning
  • Categories
    • Basic Finance
    • Derivatives
    • Financial Planning
    • Fundamental Analysis
    • Technical Analysis
    • Marketshala
    • Miscellaneous
  • Language
    • English
    • Hindi
    • Bengali
No Result
View All Result
  • Courses
  • Webinars
  • Learn On Elearnmarkets
Elearnmarkets - Learn Stock Market, trading, investing for Free
No Result
View All Result
Home Technical Analysis
Momentum based strategy using Choppiness Index

How to Understand Trending or Consolidation Phase Using Choppiness Index?

Elearnmarkets by Elearnmarkets
October 25, 2021
in Technical Analysis
Reading Time: 3 mins read
2
19.6k
VIEWS
Share on FacebookShare on TwitterShare on WhatsApp

The Choppiness index is a volatility indicator which is designed to determine trendiness of market only and not to predict future price direction.

It was developed by Australian commodity trader Bill Dreiss which simply indicates whether the market is trending (not choppy) or ranging (choppy).

The values basically range between 0 and 100, with low value signaling a strong trend (directional trending) and a high value indicating consolidation.

Table of Contents
Choppiness Index Formula
Trading signals
Trading strategy using Choppiness Index, RSI, and ADX
Conclusion

Choppiness Index Formula

Choppiness Index= 100 * Log10 {Sum (True Range, n)} / [Maximum (True High, n) – Minimum (True Low, n)]} / Log10 (n)

Trading signals

The default setting used is 14 days.

Traders generally use Fibonacci values as extremes for a choppy and trending market:

1. The value above 61.8 (higher threshold) indicates consolidation.

Know More:  Fibonacci and Stock Market Analysis

2. The value below 38.2 (lower threshold) signal a trend.

Though Choppiness index measures the status of the current trend, but it often lags the actual trend.

As long as it stays above mid 50 line, the trend continues to be choppy.

On the other hand, if it stays below the midline, it remains trending.

Let’s understand this with an example.

Chopiness above mid line f consumer

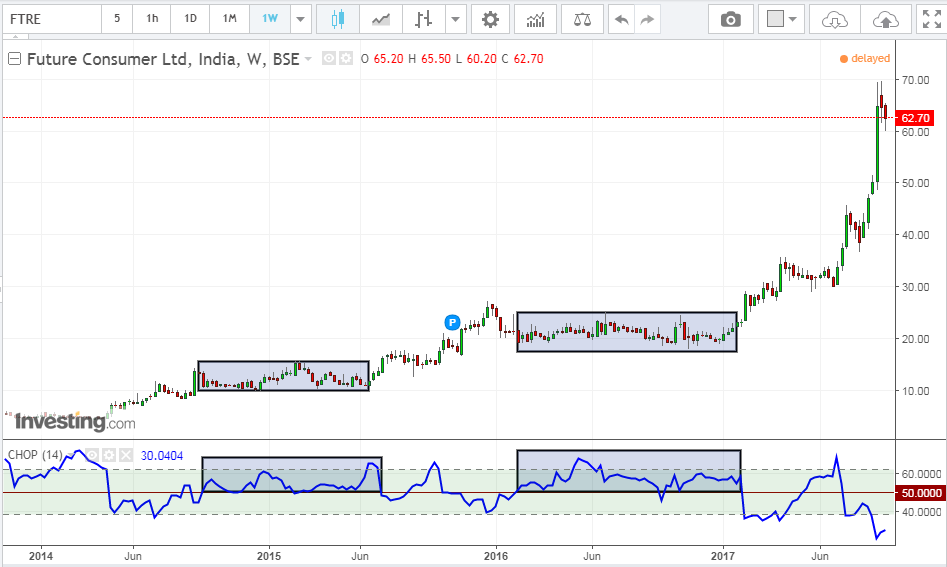
The above is the weekly chart of Future consumer and we can see that whenever the stock was above the mid 50 line, the trend continued to be choppy.

The traders who are unable to devote much time in analyzing charts of various securities may benefit from scan section in  StockEdge mobile app.

Watch the video below to know how to use the daily update section of the StockEdge App in a better manner:

Trading strategy using Choppiness Index, RSI, and ADX

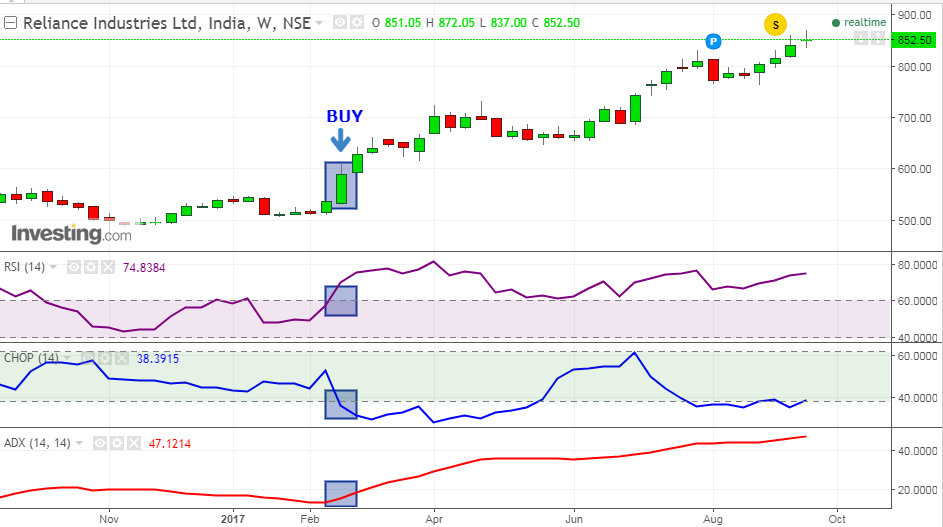
In this strategy, we combine RSI, choppiness index and ADX to generate buy or sell signal. A buy signal is generated when-

1. RSI is above 60

2. Choppiness Index closes below the lower threshold level of 38.2.

3. Simultaneously, ADX cuts 20 level from below

Also Read: Trade RSI using the Andrew Cardwell way

Below is the weekly chart of Reliance Industries, and as we can see that when all the above conditions were satisfied, the stock gave a strong upside rally.

Trading strategy using Chopiness index

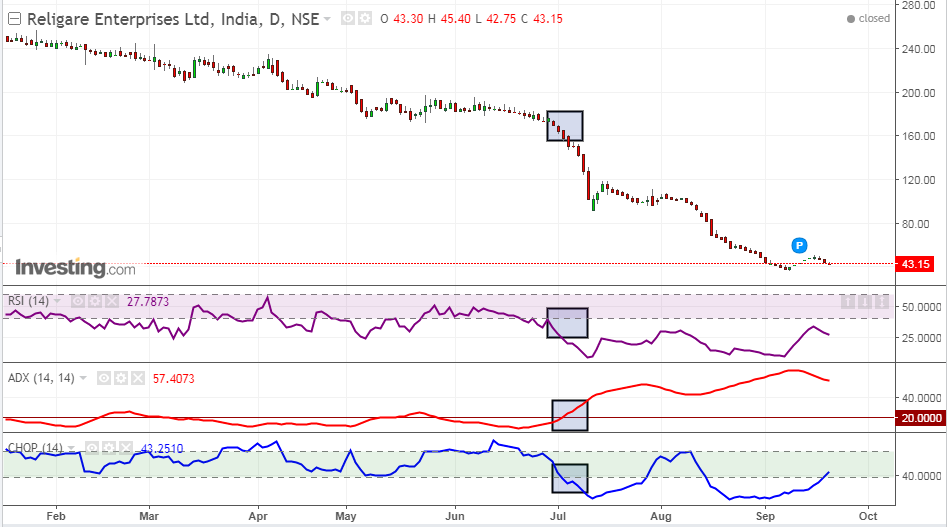
Similarly, sell signal is generated when the following conditions are satisfied-

1. RSI is above 40

2. Choppiness Index closes below the lower threshold level of 38.2.

3. Simultaneously, ADX cuts 20 level from below

The below is the daily chart of Religare Enterprises and as we can see that when all the above condition were met, the stock witnessed strong fall.

Chopiness trading strategy 2

Read More: How to trade using Larry Connor’s 2-period RSI?

Conclusion

The Choppiness index is a very interesting tool which helps in identifying trends and ranges.

It is often seen that extended period of consolidation and is often followed by an extended period of trending and vice versa.

However, we should not use Choppiness Index in isolation rather it should be used in conjunction with a traditional pattern or other indicators or oscillators to get confirmed buy or sell signal.

Tags: ADXChoppiness indexconsolidationenglishrsi
ShareTweetSend
Previous Post

Is This the Lul before the Bank Nifty Storm

Next Post

Bank Nifty Slips Post Fed’s Hawkish Stance

Elearnmarkets

Elearnmarkets

Elearnmarkets (ELM) is a complete financial market portal where the market experts have taken the onus to spread financial education. ELM constantly experiments with new education methodologies and technologies to make financial education effective, affordable and accessible to all. You can connect with us on Twitter @elearnmarkets.

Related Posts

How to trade with Renko Charts Efficiently? 1
Technical Analysis

How to trade with Renko Charts Efficiently?

June 6, 2023
2.7k
Technical Analysis in Stock Trading 2
Technical Analysis

Technical Analysis in Stock Trading

June 8, 2023
7.4k
The Ultimate guide to Trading Divergences 3
Technical Analysis

The Ultimate guide to Trading Divergences

May 26, 2023
1.2k
Trading Psychology: Guide to Master Your Mind in 5 Steps 4
Technical Analysis

Trading Psychology: Guide to Master Your Mind in 5 Steps

May 24, 2023
3.3k

Comments 2

  1. dr. sampada joshi says:
    2 years ago

    very useful

    Reply
    • Sakshi Agarwal says:
      2 years ago

      Hi,

      Thank you for reading our blog!!

      Keep Reading!

      Reply

Leave a Reply Cancel reply

Your email address will not be published. Required fields are marked *

Follow Us

Facebook-f Twitter Instagram Linkedin-in Youtube Telegram

Register on Elearnmarkets

Continue your financial learning by creating your own account on Elearnmarkets.com

Register Free Account

Download App

Categories

  • Basic Finance
  • Derivatives
  • Financial Planning
  • Fundamental Analysis
  • Technical Analysis
  • Marketshala
  • Miscellaneous

Popular On Elearnmarkets

  • Market Superheroes:
  • Vivek Bajaj
  • Chetan Panchamia
  • Ashish Kyal
  • Premal Parekh
  • Abhijit Paul
  • Jegan
  • Sivakumar Jayachadran
  • Vishal Malkan
  • Jyoti Budhia
  • Vivek Gadodia
  • Vishal Mehta
  • Piyush Chaudhry
  • Santosh Pasi
  • Gomathi Shankar
  • Market Superheroes:
  • Vivek Bajaj
  • Chetan Panchamia
  • Ashish Kyal
  • Premal Parekh
  • Abhijit Paul
  • Jegan
  • Sivakumar Jayachadran
  • Vishal Malkan
  • Jyoti Budhia
  • Vivek Gadodia
  • Vishal Mehta
  • Piyush Chaudhry
  • Santosh Pasi
  • Gomathi Shankar
  • Courses:​
  • Options Trading
  • Dow Theory
  • Momentum Trading
  • Stock Investing
  • Stock Market for Beginners
  • Harmonic Chart Patterns
  • Algo Trading
  • Elliot Wave Theory
  • Advanced Excel
  • Cryptocurrency
  • NSE Certification Course
  • Courses:​
  • Options Trading
  • Dow Theory
  • Momentum Trading
  • Stock Investing
  • Stock Market for Beginners
  • Harmonic Chart Patterns
  • Algo Trading
  • Elliot Wave Theory
  • Advanced Excel
  • Cryptocurrency
  • NSE Certification Course
  • Webinars:
  • Bank Nifty Scalping
  • Intraday Trading Strategies
  • Options Trading Strategies
  • Options selling
  • Price Action
  • Relative Strength
  • Tax Planning
  • Options Buying
  • Growth Stocks
  • Portfolio Management
  • Relative Strength Index
  • Risk Management
  • Renko Charts
  • Crude Oil
  • Traders Psychology
  • Moving Average
  • Multibagger Stocks
  • Free Learning Modules:
  • Intraday Trading
  • Options Scalping
  • Swing Trading
  • Financial Modelling
  • RSI Indicator
  • Bollinger Bands
  • Pricing of Futures
  • Personal Finance
  • Initial Public Offerings (IPO)
  • Value Investing
  • Technical Indicators
  • Candlesticks
  • Chart Patterns
  • Option Greeks
  • ELSS Funds
  • Banking and Insurance
  • Real Estate
  • Gold
  • Book Summaries:
  • Rich Dad Poor Dad
  • Psychology of Money
  • The Intelligent Investor
  • The Richest Man in Babylon
  • Think and Trade Like a Champion
  • Value Investing and Behavioural Finance
  • Trading in the Zone
  • Learn to Earn
  • Book Summaries:
  • Rich Dad Poor Dad
  • Psychology of Money
  • The Intelligent Investor
  • The Richest Man in Babylon
  • Think and Trade Like a Champion
  • Value Investing and Behavioural Finance
  • Trading in the Zone
  • Learn to Earn
  • Tools:
  • CAGR Calculator
  • SIP Calculator
  • eLearnOptions
  • Future Value Calculator
  • Present Value Calculator
  • Atal Pension Yojana
  • Cost of Delay Calculator
  • Become a Crorepati
  • Tools:
  • CAGR Calculator
  • SIP Calculator
  • eLearnOptions
  • Future Value Calculator
  • Present Value Calculator
  • Atal Pension Yojana
  • Cost of Delay Calculator
  • Become a Crorepati

© 2023 Elearnmarkets. All Rights Reserved

  • Visit Elearnmarkets
  • Courses
  • Webinars
  • Financial Guides
  • Get Free Counselling
  • Visit Elearnmarkets
  • Courses
  • Webinars
  • Financial Guides
  • Get Free Counselling

Get Elearnmarkets App

No Result
View All Result
  • Article Categories
    • Basic Finance
    • Derivatives
    • Financial Planning
    • Fundamental Analysis
    • Technical Analysis
    • Marketshala
    • Miscellaneous
  • Language
    • Hindi
    • Bengali
    • English
  • Courses
  • Webinars

© 2020 Elearnmarkets All Rights Reserved