Elearnmarkets - Financial Market Learning
  • Courses
  • Webinars
  • Stories
  • Language
    • English
    • Hindi
    • Bengali
No Result
View All Result
Get Free Course
  • Basic Finance
  • Derivatives
    • Futures
    • Options
  • Financial Planning
  • Fundamental Analysis
  • Technical Analysis
  • Mutual Funds
  • Marketshala
  • Miscellaneous
Elearnmarkets - Learn Stock Market, trading, investing for Free
  • Courses
  • Webinars
  • Stories
  • Language
    • English
    • Hindi
    • Bengali
No Result
View All Result
Get Free Course
Elearnmarkets - Learn Stock Market, trading, investing for Free
No Result
View All Result
Home Basic Finance
Stock Life Cycle - Different Phases & Identifying Position 1

Stock Life Cycle – Different Phases & Identifying Position

Elearnmarkets by Elearnmarkets
August 9, 2023
in Basic Finance, Capital Markets
Reading Time: 6 mins read
3
7.9k
VIEWS
Share on FacebookShare on XShare on WhatsApp

Understanding the stock life cycle is an important element in interpreting the performance of a fund. Everything in nature goes through a cycle whether it is a living organism or weather. Like living organism passes through different phases of birth, growth, maturity, decline and lastly death or rebirth.

Weather also follows a cycle and there cannot be one season throughout. Summer season is an unavoidable part of the weather cycle and it’s going to stay with you for some time say around 4-4.5 months, whether you like it or not. Then it is followed by the monsoon.

In the same way, the stock market also follows a cycle. After a bear phase, there will be a bullish phase but however, no one knows how much time it’s going to take. If someone wants to enjoy the fruits when the situations are conducive, it’s important to adapt to the harsh phase by being adaptive to the environment. The key here is patience.

Table of Contents
Different phases of the Stock Life Cycle
Where are we in the stock market cycle analysis?
Is the life cycle of business similar to the 4 stages of the stock market?
Bottomline

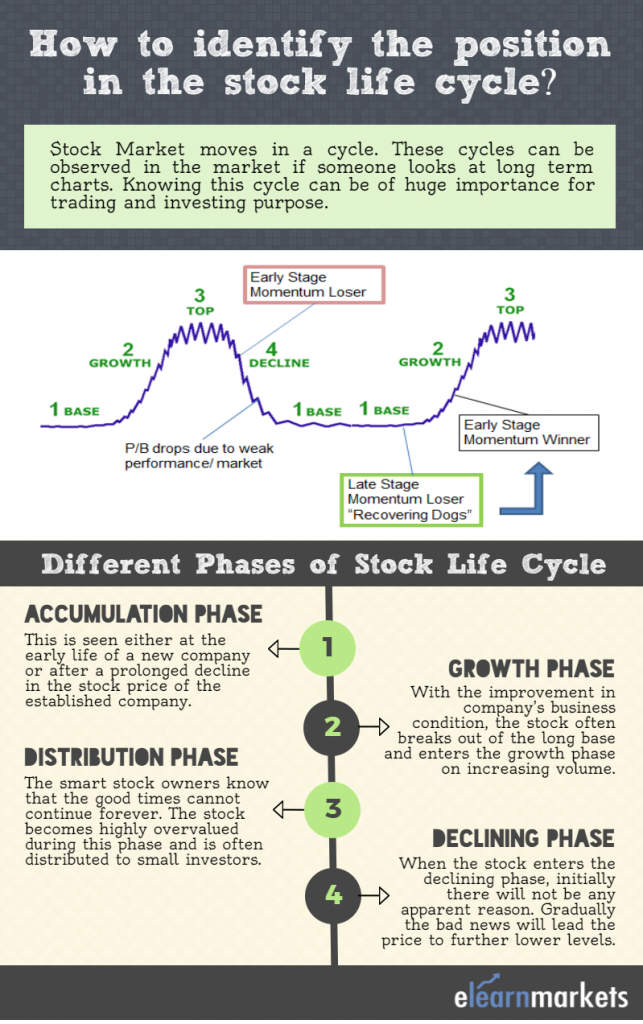
These cycles can be clearly observed in the market if someone looks at the long-term charts. Knowing this cycle can be of huge importance for trading and investing purpose. It may help you in identifying that where a stock is in its lifecycle. However, in real life, it’s very difficult to identify the actual position in its lifecycle.

stock life cycle phases

Different phases of the Stock Life Cycle

Phase 1: Accumulation Phase

This phase is generally seen either in the early life of a new company or after a prolonged decline in the stock price of the established company. After a period of an adverse business condition, the company tries to reorganize during this period. This period may last from few months to many years. The stock here is largely held by the owners who don’t have any intention of selling until they realize a substantial profit.

Learn from Experts :  Stock Market Course for Beginners

The stock may move in a range during this period and a strong resistance develops at the top of the base area. Any breakout from the base area signals the stock has entered the second phase.

Phase 2: Growth Phase

With the improvement in the business condition of the company, the stock often breaks out of the long base and enters the growth phase on increasing volume. The steady improvement in the business conditions and the entry of new investors who bid up the price to obtain stock reinforces the uptrend. The stock price remains above its 200 DMA in this phase and it’s better to remain invested in the stock until it holds its 200 DMA.

Also Read:  How to trade using moving average on different timeframes?

Phase 3: Distribution Phase

The smart stock owners know that the good times cannot continue forever and the stock becomes highly overvalued during this phase. In the background of rosy earnings and good economic news, the stock is often distributed to small investors. The top may range from several months to few years and the price may move sideways during this period. An early warning sign can be in the form of price breaking below its 200 days moving average.

Also Read: Why Moving Average is important for your technical toolbox?

Phase 4: Declining Phase

When the stock enters the declining phase, initially there will not be any apparent reason for the same. Gradually the bad news and evidence of determination will lead the price to further lower levels. In between the fall, there may be some short-term false up-move and the investors may believe that the price has bottomed out. One should be careful during this period and rather as the stock price approaches to its 200 DMA, it may provide good shorting opportunity.

Where are we in the stock market cycle analysis?

Let’s take a practical example to analyze that what is the position of the stock in terms of stock life cycle.

This is a monthly chart of Reliance Capital. If we look at the monthly chart closely, we can see after a good accumulation in the stock back in the year 2000-2005, the stock entered the growth phase. It topped out in the year 2008 and entered the decline phase. Within 1 year time, it came back to the price where it started.

Where are we in the stock market cycle analysis

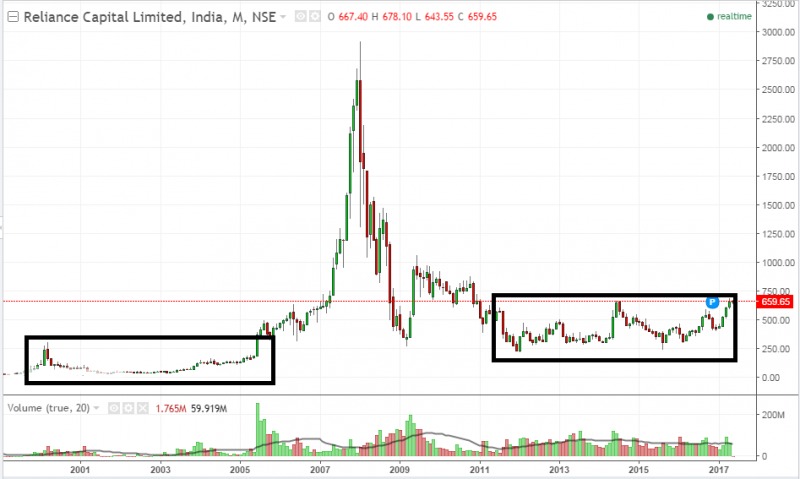
The stock has entered the accumulation phase since the year 2011. Currently, it’s facing resistance at around 680 levels and once it breaches this level with good volume, it will enter the growth phase.

Is the life cycle of business similar to the 4 stages of the stock market?

The life cycle of business has a close connection with the 4 stages of the stock market as the stock market is a representation of the value of businesses.

Lifecycle of business flow chart
Source: www.joshbersin.com

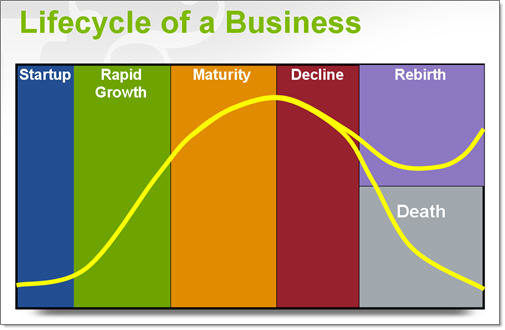
The different phases of the business cycle: Embryonic stage, Growth stage, Shakeout stage, Maturity stage, and Decline stage is somewhat similar to the 4 stages of stock market cycle i.e. Accumulation, Growth, Maturity and Decline phase.

Bottomline

The investors often look at the solid fundamental reason before investing in a company. But one drawback of this approach is that by the time they have supportive evidence, it’s already priced in and accordingly the stock has already moved by 300-400% i.e. the market has already discounted the positive news.

Look to buy a stock when the stock is surrounded by bad news and nobody wants to buy it. The weak hands will try to exit their position on such news. On the other hand, after a good uptrend when the picture looks rosy, the smart investor exits their position and offloads their stake to weak and news-driven investors.

Tags: business cycleenglishinvestment basicslife cyclestockstock market
ShareTweetSend
Get Kotak Offer Get Kotak Offer Get Kotak Offer
Previous Post

5 Finance Lessons from Bahubali Movie

Next Post

स्टॉक लाइफ साइकिल – कैसे पहचाने अपने शेयर की स्तिथि को उसके जीवन चक्र में?

Elearnmarkets

Elearnmarkets

Elearnmarkets (ELM) is a complete financial market portal where the market experts have taken the onus to spread financial education. ELM constantly experiments with new education methodologies and technologies to make financial education effective, affordable and accessible to all. You can connect with us on Twitter @elearnmarkets.

Related Posts

Gold Price in India
Basic Finance

Gold is Outshining: Here’s the Reason Why?

June 20, 2025
14
Concept of Fund of Funds
ETFs & Mutual Funds

Easy Guide to Understanding the Concept of Fund of Funds

June 3, 2025
230
How is standard deviation used in mutual fund
ETFs & Mutual Funds

How is Standard Deviation Used in Mutual Fund

April 22, 2025
544
Ways to Make Trading More Transparent
Cryptocurrency

Under the Crypto Hood: 5 Ways to Make Trading More Transparent

May 5, 2025
96

Comments 3

  1. situs poker online says:
    5 years ago

    Excellent, what a webpage it is! This weblog presents valuable facts to us, keep it up.

    Reply
  2. hemp oil for dogs seizures says:
    5 years ago

    Hi there! This blog post couldn’t be written much better! Looking through
    this article reminds me of my previous roommate! He constantly kept preaching about this.

    I am going to send this article to him. Pretty sure he’ll have a good read.
    Thanks for sharing!

    Reply
  3. maurten gel 100 amazon says:
    5 years ago

    I have been browsing online greater than 3 hours nowadays, but I never
    discovered any interesting article like yours. It is lovely
    worth sufficient for me. In my view, if all webmasters and bloggers made just right content as you did, the internet will probably be much more useful than ever before.

    Reply

Leave a Reply Cancel reply

Your email address will not be published. Required fields are marked *

Disclaimer

Elearnmarkets (Kredent InfoEdge Pvt. Ltd.) is a SEBI-registered Research Analyst (RA) entity (SEBI Registration No.: INH300007493). The information provided in this article is for educational and informational purposes only and should not be considered as an offer to buy or sell any securities or investment products.

The stocks, securities, and investment instruments mentioned herein are not recommendations under SEBI (Research Analysts) Regulations, 2014. Readers are advised to conduct their own due diligence and seek independent financial advice before making any investment decisions.

Investments in securities markets are subject to market risks. Please read all related documents carefully before investing. Investing in Equity Shares,
Derivatives, Mutual Funds, or other instruments carry inherent risks, including potential loss of capital. Elearnmarkets (Kredent InfoEdge Pvt. Ltd.) does not provide any guarantee or assurance of returns on any investments. Past performance is not indicative of future performance.

Elearnmarkets Logo

Follow Us

Facebook-f X-twitter Instagram Linkedin-in Youtube Telegram

Register on Elearnmarkets

Continue your financial learning by creating your own account on Elearnmarkets.com

Register Free Account

Download App

Playstore logo
Download on app store

Categories

  • Basic Finance
  • Derivatives
  • Financial Planning
  • Fundamental Analysis
  • Technical Analysis
  • Mutual Funds
  • Miscellaneous

Popular On Elearnmarkets

  • Market Superheroes:
  • Vivek Bajaj
  • Chetan Panchamia
  • Ashish Kyal
  • Premal Parekh
  • Abhijit Paul
  • Jegan
  • Sivakumar Jayachadran
  • Jyoti Budhia
  • Vivek Gadodia
  • Vishal Mehta
  • Piyush Chaudhry
  • Santosh Pasi
  • Gomathi Shankar
  • Market Superheroes:
  • Vivek Bajaj
  • Chetan Panchamia
  • Ashish Kyal
  • Premal Parekh
  • Abhijit Paul
  • Jegan
  • Sivakumar Jayachadran
  • Jyoti Budhia
  • Vivek Gadodia
  • Vishal Mehta
  • Piyush Chaudhry
  • Santosh Pasi
  • Gomathi Shankar
  • Courses:​
  • Options Trading
  • Dow Theory
  • Momentum Trading
  • Stock Investing
  • Harmonic Chart Patterns
  • Algo Trading
  • Elliot Wave Theory
  • Advanced Excel
  • Cryptocurrency
  • NSE Certification Course
  • Courses:​
  • Options Trading
  • Dow Theory
  • Momentum Trading
  • Stock Investing
  • Harmonic Chart Patterns
  • Algo Trading
  • Elliot Wave Theory
  • Advanced Excel
  • Cryptocurrency
  • NSE Certification Course
  • Webinars:
  • Bank Nifty Scalping
  • Intraday Trading Strategies
  • Options Trading Strategies
  • Options selling
  • Price Action
  • Relative Strength
  • Tax Planning
  • Options Buying
  • Growth Stocks
  • Portfolio Management
  • Risk Management
  • Renko Charts
  • Crude Oil
  • Traders Psychology
  • Moving Average
  • Multibagger Stocks
  • Free Learning Modules:
  • Intraday Trading
  • Options Scalping
  • Swing Trading
  • Financial Modelling
  • RSI Indicator
  • Bollinger Bands
  • Pricing of Futures
  • Personal Finance
  • Initial Public Offerings (IPO)
  • Value Investing
  • Technical Indicators
  • Candlesticks
  • Chart Patterns
  • Option Greeks
  • ELSS Funds
  • Banking and Insurance
  • Real Estate
  • Gold
  • Book Summaries:
  • Rich Dad Poor Dad
  • Psychology of Money
  • The Intelligent Investor
  • The Richest Man in Babylon
  • Think and Trade Like a Champion
  • Value Investing and Behavioural Finance
  • Trading in the Zone
  • Learn to Earn
  • Book Summaries:
  • Rich Dad Poor Dad
  • Psychology of Money
  • The Intelligent Investor
  • The Richest Man in Babylon
  • Think and Trade Like a Champion
  • Value Investing and Behavioural Finance
  • Trading in the Zone
  • Learn to Earn
  • Tools:
  • CAGR Calculator
  • SIP Calculator
  • eLearnOptions
  • Future Value Calculator
  • Present Value Calculator
  • Atal Pension Yojana
  • Cost of Delay Calculator
  • Become a Crorepati
  • Tools:
  • CAGR Calculator
  • SIP Calculator
  • eLearnOptions
  • Future Value Calculator
  • Present Value Calculator
  • Atal Pension Yojana
  • Cost of Delay Calculator
  • Become a Crorepati

© 2025 Elearnmarkets. All Rights Reserved

  • Visit Elearnmarkets
  • Courses
  • Webinars
  • Financial Guides
  • Get Free Counselling
  • Visit Elearnmarkets
  • Courses
  • Webinars
  • Financial Guides
  • Get Free Counselling

Download Our App

No Result
View All Result
  • Article Categories
    • Basic Finance
    • Derivatives
    • Financial Planning
    • Fundamental Analysis
    • Technical Analysis
    • ETFs & Mutual Funds
    • Marketshala
    • Miscellaneous
  • Language
    • Hindi
    • Bengali
    • English
  • Courses
  • Webinars
  • Stories
Get Free Course

© 2024 Elearnmarkets All Rights Reserved

Guide to Basics of Stock Investing
Learn to interpret the financial performance and health of a company.
Download Guide For FREE
Guide Book on Investing with ₹ 5000
Learn about the Basics of Investments and Finance in this Ebook.
Download Guide For FREE
TMP orientation