Elearnmarkets - Financial Market Learning
  • Courses
  • Webinars
  • Stories
  • Language
    • English
    • Hindi
    • Bengali
No Result
View All Result
Get Free Course
  • Basic Finance
  • Derivatives
    • Futures
    • Options
  • Financial Planning
  • Fundamental Analysis
  • Technical Analysis
  • Mutual Funds
  • Marketshala
  • Miscellaneous
Elearnmarkets - Learn Stock Market, trading, investing for Free
  • Courses
  • Webinars
  • Stories
  • Language
    • English
    • Hindi
    • Bengali
No Result
View All Result
Get Free Course
Elearnmarkets - Learn Stock Market, trading, investing for Free
No Result
View All Result
Home Technical Analysis
Renko Charts-How to trade Efficiently with Renko Charts? 1

Renko Charts-How to trade Efficiently with Renko Charts?

Vivek Bajaj by Vivek Bajaj
February 27, 2025
in Technical Analysis
Reading Time: 7 mins read
2
4.8k
VIEWS
Share on FacebookShare on XShare on WhatsApp

Renko charts are one of the best ways to analyze price movements of the financial assets and also filter out minor price movements.

When these small fluctuations in price movements are removed then the price trends can be easily spotted with a Renko chart.

This is the reason why traders prefer Renko charts as price charts when trading in the stock market.

Renko charts are also easier to read as the bricks, boxes, or blocks are more uniform as compared to candlestick charts.

Table Of Contents
  1. What are Renko Charts?
  2. How to construct Renko Charts?
  3. Types of Renko charts
    • 1. High/Low Renko Chart
    • 2. Open/Close Renko Charts
  4. How to determine the box value?
  5. Trading using Renko Charts
  6. Advantages of using the Renko chart
  7. Limitations of Renko charts
  8. Difference between Renko Charts and Candlestick Charts:
  9. Bottomline
  10. Frequently Asked Questions
    • What is the Purpose of Renko Charts?
    • How are Renko Chart Bricks Calculated?

In this blog, we will discuss the basics of Renko charts and how to trade with the:

What are Renko Charts?

Many people think that the Renko chart’s name comes from the Japanese word for bricks, “Renga,” as it resembles a series of bricks.

In the Renko charts, a new brick is formed when the price of an asset moves a certain price amount.

Traders can also place each block at a 45-degree angle, either up or down to the previous brick.

Usually, the up brick has a white or green colour, whereas the down brick has a black or red colour. A Renko chart mainly shows price movements in financial markets.

Renko charts are made up of blocks that are the same size. The blocks can either be green or red, just like in a candlestick chart.

Renko charts have individual blocks of the same size, as the chart doesn’t consider time.

The Renko chart has a setting parameter for the size of the bricks specified by the traders for each brick.

How to construct Renko Charts?

As we have discussed above, Renko charts are constructed using bricks having a fixed value which filters out smaller price movements

This is the reason why these charts take only one piece of data per day or week. One should note that Renko charts ignore the time aspect and only focus on price changes.

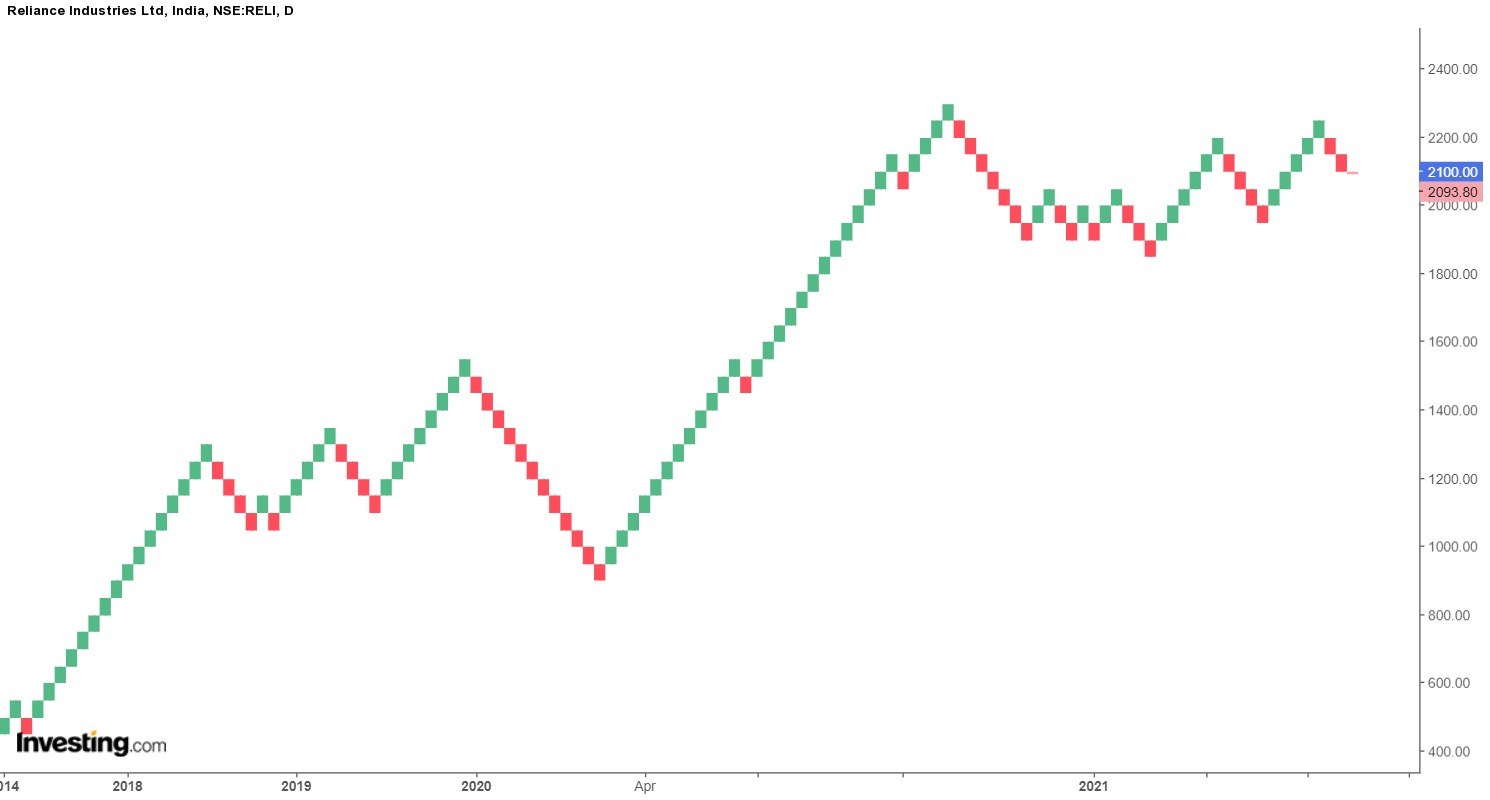
For example, If the brick value is set at 50 points, then a move of 50 points is required to draw another brick as shown in the below chart of Reliance India Ltd.

Price movements less than 50 points would be ignored and another brick will not be formed in the Renko chart.

RENKO CHARTS

Types of Renko charts

There are usually two types of Renko charts that depend on the calculation used. These are high/low charts and open/close charts.

1. High/Low Renko Chart

This type of Renko chart considers the behaviour of each price action. It consists of price actions between the highest and lowest price on the chart.

2. Open/Close Renko Charts

This Renko style takes only those price moves that are found within the Open/Close range of the price action.

How to determine the box value?

Traders can use the “box” settings to set the brick size, which can be a specific value or the Average True Range (ATR).

A specific point value means the brick size will remain constant even when new data is added to the chart.

The above chart of Reliance India Ltd., as shown above, has a fixed value, and each brick represents fifty points.

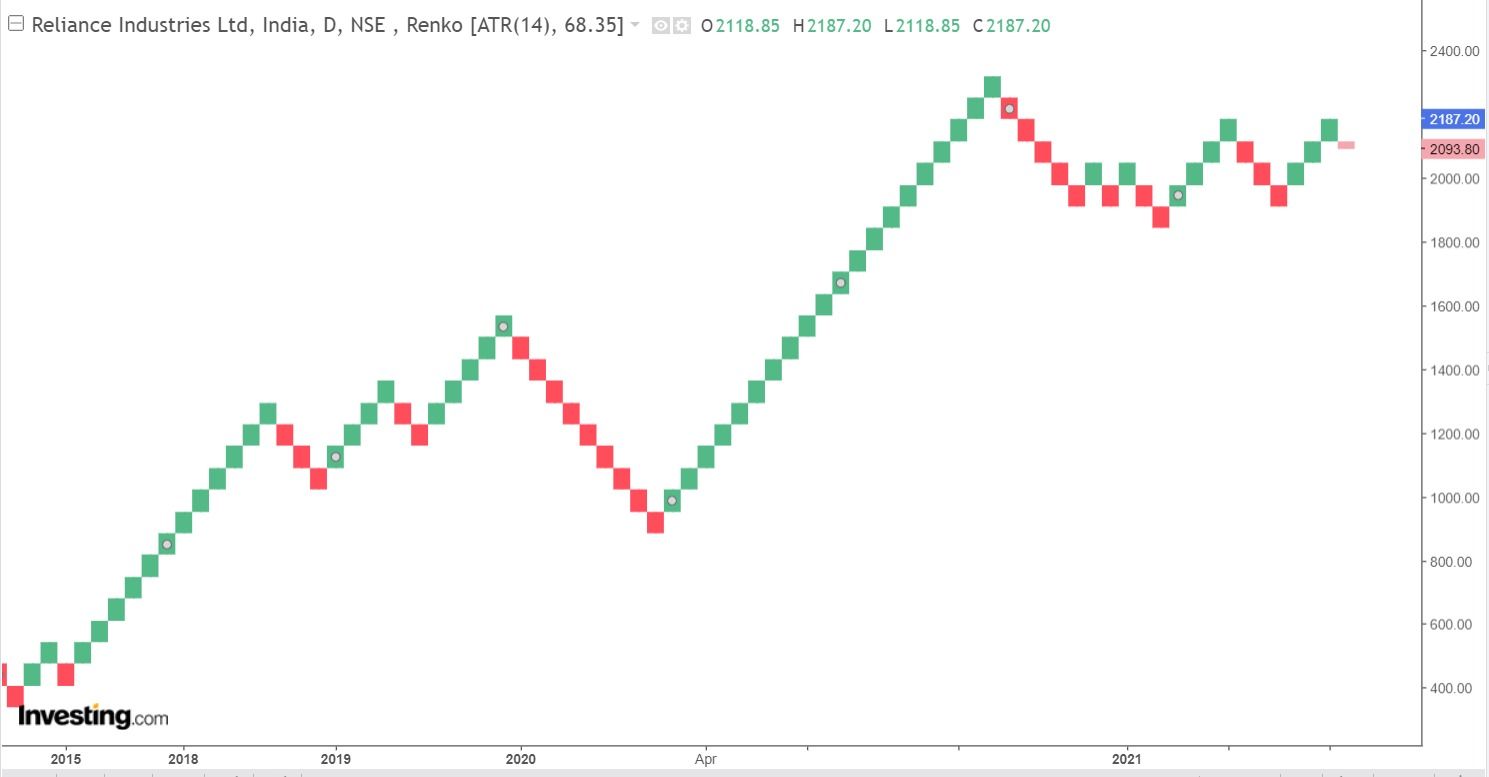
On the other hand, ATR values result in the fluctuating of the brick sizes. The default ATR is of 14 periods and it fluctuates over time as shown below:

How to determine the box value in Renko Charts

Trading using Renko Charts

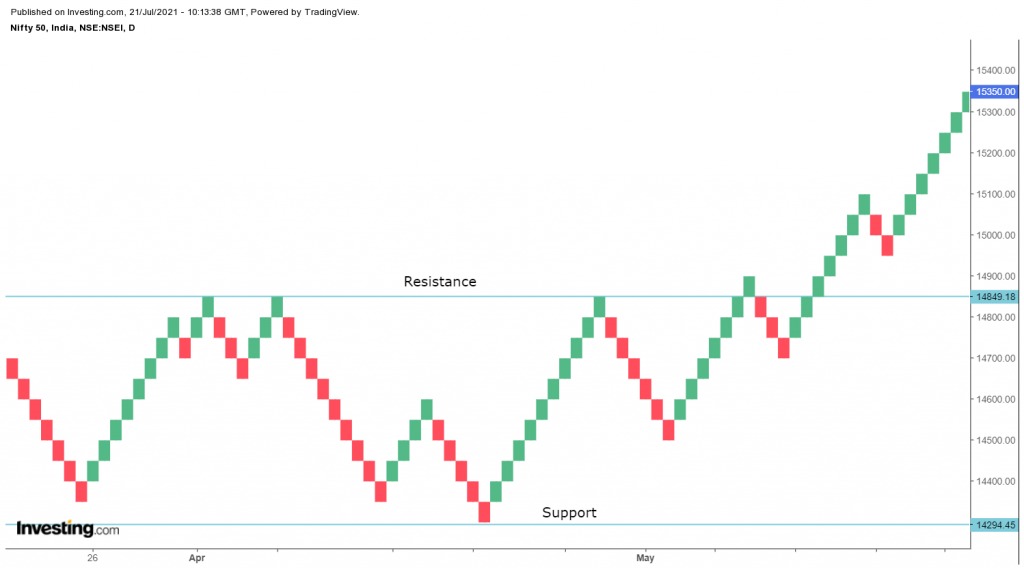
Traders can use troughs to mark support levels and peaks to mark resistance levels. They can also look for a two-brick reversal that signals a trend change.

Renko Charts-How to trade Efficiently with Renko Charts?

Green bricks are formed when prices rise a certain amount and red bricks form when prices decline a certain amount.

The chart below shows a daily Nifty 50 chart and a 10-period simple moving average.

 Renko chart pattern and using Moving Average with Renko chart

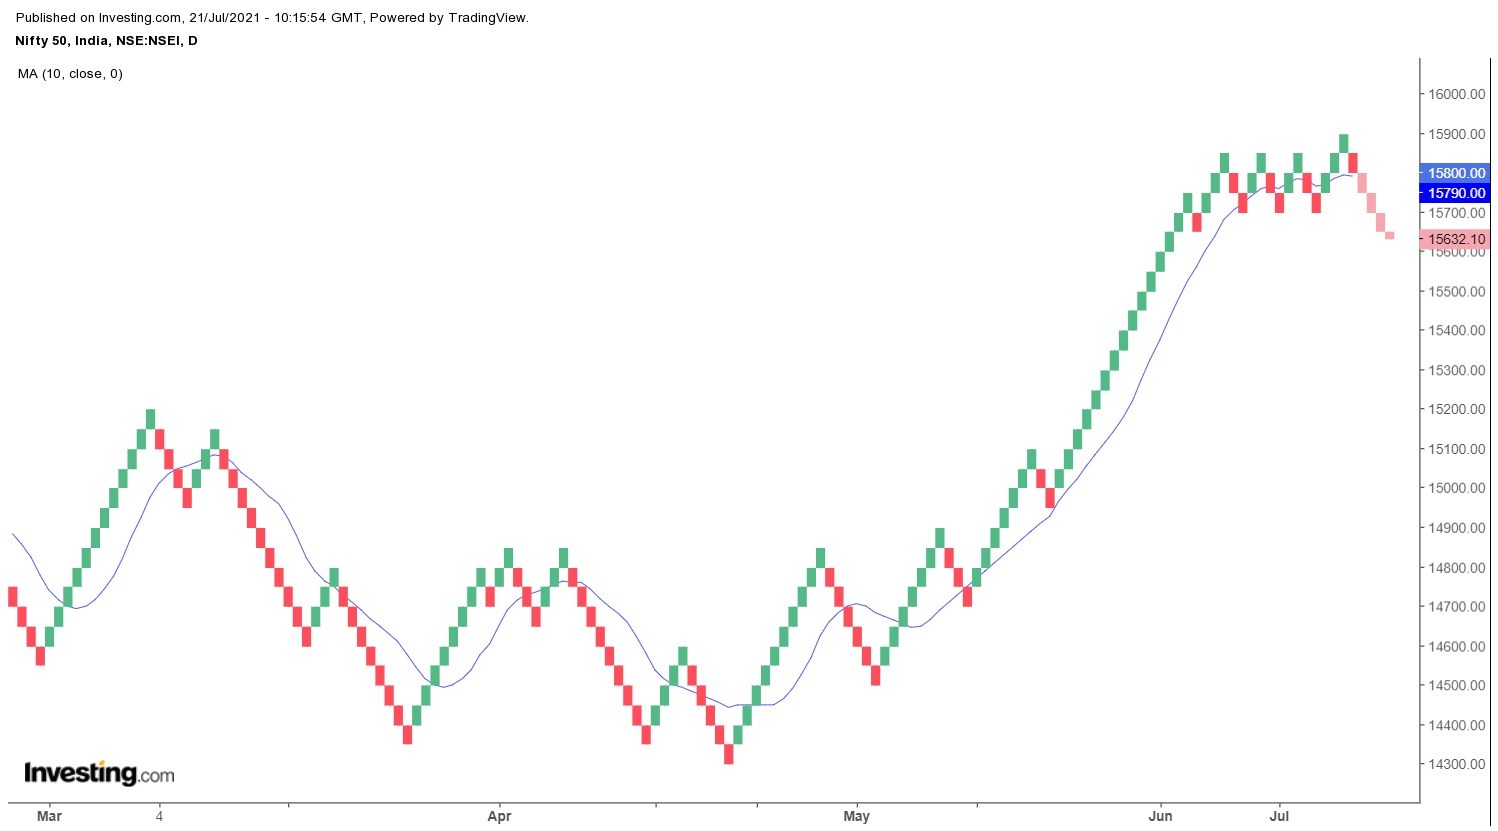
One should remember that an indicator on a Renko chart depends on the Renko values and will differ from the same indicator on a bar chart.

Traders should use shorter moving averages on Renko charts as smaller price movements have already been filtered out.

Advantages of using the Renko chart

Renko charts do not include the time aspect and thus filter out noises and small price movements on the charts.

Decreasing or increasing the size of the box will affect how smooth the chart will be. Lowering the size of the box will make more swings, but will also show possible price reversals quicker. Big box size will lower the number of swings and noise but will be slower to show a reversal price.

Limitations of Renko charts

Renko charts do not show in detail the price movements as bar or candlestick charts because they do not track time

Thus, this fails to tell the traders what has occurred during that period.

You can also do our Masterclass on Renko Chart Patterns

Difference between Renko Charts and Candlestick Charts:

The main difference between the Renko chart and the candlestick chart is that Renko charts are smoother than the candlestick charts. The same also holds for an OHLC (open, high, low, close) bar chart.

This is the reason that when we compare a Renko chart and a candlestick chart, the price movements on the candlestick chart will change directions more often.

Another difference between the two types of charts is that a Renko chart doesn’t always give us the most current information. As the Renko chart updates only when a new brick is formed and the candlestick chart always shows the last price.

Bottomline

Renko charts are mainly used by traders because they filter the noise by focusing on the specific amount of price changes. As with Point and Figure charts, it is easy for spotting highs and lows, and identifying key support and resistance levels, the same goes for Renko charts. Traders can easily identify uptrends or downtrends using these Charts. Like other charting techniques, traders can also use other technical analysis tools for confirming the price movements on Renko charts.

Frequently Asked Questions

What is the Purpose of Renko Charts?

Renko charts are primarily used to highlight trends and filter out market noise. They help traders spot and validate patterns, which makes it easier to make decisions based on price changes rather than time.

How are Renko Chart Bricks Calculated?

Renko bricks are sized according to a predetermined price movement called the “brick size” or “box size.” A new brick is added to the chart if the price moves by more than this predetermined amount.

Traders who are unable to devote much time in analyzing charts of various securities may benefit from scan section in StockEdge mobile app.

Happy Investing!

Tags: basicRenko charttechnical basicstechnical charts
ShareTweetSend
Get Kotak Offer Get Kotak Offer Get Kotak Offer
Next Post

20 Indian Financial Twitter Feeds You Must Follow

Vivek Bajaj

Vivek Bajaj

Mr. Vivek Bajaj has over 18 years of trading experience in equities, options, currencies, and commodity markets. He is the co-founder of Stockedge and Elearnmarkets and is passionate about data, analytics, and technology. He serves on various exchange committees and has played a significant role in the evolution of India's derivative market. He has been a speaker at various colleges and higher institutions, including IIT and IIMs.

Related Posts

Understand Slippage in Trading
Technical Analysis

What is Slippage in Trading? Meaning & Examples

March 28, 2025
305
Breakout trading strategies
Technical Analysis

Top 5 Breakout Trading Strategies

March 12, 2025
1.1k
5 stocks for today
Technical Analysis

5 Stocks to Buy Today That Could Beat the NIFTY in 2025!

May 5, 2025
401
Image describing What is marginal trading facility
Technical Analysis

 What is a Margin Trading Facility? Advantages & Risks

April 4, 2025
663

Comments 2

  1. Bhimochan Bhardwaj says:
    4 years ago

    Excellent

    Reply
    • Sakshi Agarwal says:
      4 years ago

      Hi,

      We really appreciated that you liked our blog.

      Keep Reading!!

      Reply

Leave a Reply Cancel reply

Your email address will not be published. Required fields are marked *

Disclaimer

Elearnmarkets (Kredent InfoEdge Pvt. Ltd.) is a SEBI-registered Research Analyst (RA) entity (SEBI Registration No.: INH300007493). The information provided in this article is for educational and informational purposes only and should not be considered as an offer to buy or sell any securities or investment products.

The stocks, securities, and investment instruments mentioned herein are not recommendations under SEBI (Research Analysts) Regulations, 2014. Readers are advised to conduct their own due diligence and seek independent financial advice before making any investment decisions.

Investments in securities markets are subject to market risks. Please read all related documents carefully before investing. Investing in Equity Shares,
Derivatives, Mutual Funds, or other instruments carry inherent risks, including potential loss of capital. Elearnmarkets (Kredent InfoEdge Pvt. Ltd.) does not provide any guarantee or assurance of returns on any investments. Past performance is not indicative of future performance.

Elearnmarkets Logo

Follow Us

Facebook-f X-twitter Instagram Linkedin-in Youtube Telegram

Register on Elearnmarkets

Continue your financial learning by creating your own account on Elearnmarkets.com

Register Free Account

Download App

Playstore logo
Download on app store

Categories

  • Basic Finance
  • Derivatives
  • Financial Planning
  • Fundamental Analysis
  • Technical Analysis
  • Mutual Funds
  • Miscellaneous

Popular On Elearnmarkets

  • Market Superheroes:
  • Vivek Bajaj
  • Chetan Panchamia
  • Ashish Kyal
  • Premal Parekh
  • Abhijit Paul
  • Jegan
  • Sivakumar Jayachadran
  • Jyoti Budhia
  • Vivek Gadodia
  • Vishal Mehta
  • Piyush Chaudhry
  • Santosh Pasi
  • Gomathi Shankar
  • Market Superheroes:
  • Vivek Bajaj
  • Chetan Panchamia
  • Ashish Kyal
  • Premal Parekh
  • Abhijit Paul
  • Jegan
  • Sivakumar Jayachadran
  • Jyoti Budhia
  • Vivek Gadodia
  • Vishal Mehta
  • Piyush Chaudhry
  • Santosh Pasi
  • Gomathi Shankar
  • Courses:​
  • Options Trading
  • Dow Theory
  • Momentum Trading
  • Stock Investing
  • Harmonic Chart Patterns
  • Algo Trading
  • Elliot Wave Theory
  • Advanced Excel
  • Cryptocurrency
  • NSE Certification Course
  • Courses:​
  • Options Trading
  • Dow Theory
  • Momentum Trading
  • Stock Investing
  • Harmonic Chart Patterns
  • Algo Trading
  • Elliot Wave Theory
  • Advanced Excel
  • Cryptocurrency
  • NSE Certification Course
  • Webinars:
  • Bank Nifty Scalping
  • Intraday Trading Strategies
  • Options Trading Strategies
  • Options selling
  • Price Action
  • Relative Strength
  • Tax Planning
  • Options Buying
  • Growth Stocks
  • Portfolio Management
  • Risk Management
  • Renko Charts
  • Crude Oil
  • Traders Psychology
  • Moving Average
  • Multibagger Stocks
  • Free Learning Modules:
  • Intraday Trading
  • Options Scalping
  • Swing Trading
  • Financial Modelling
  • RSI Indicator
  • Bollinger Bands
  • Pricing of Futures
  • Personal Finance
  • Initial Public Offerings (IPO)
  • Value Investing
  • Technical Indicators
  • Candlesticks
  • Chart Patterns
  • Option Greeks
  • ELSS Funds
  • Banking and Insurance
  • Real Estate
  • Gold
  • Book Summaries:
  • Rich Dad Poor Dad
  • Psychology of Money
  • The Intelligent Investor
  • The Richest Man in Babylon
  • Think and Trade Like a Champion
  • Value Investing and Behavioural Finance
  • Trading in the Zone
  • Learn to Earn
  • Book Summaries:
  • Rich Dad Poor Dad
  • Psychology of Money
  • The Intelligent Investor
  • The Richest Man in Babylon
  • Think and Trade Like a Champion
  • Value Investing and Behavioural Finance
  • Trading in the Zone
  • Learn to Earn
  • Tools:
  • CAGR Calculator
  • SIP Calculator
  • eLearnOptions
  • Future Value Calculator
  • Present Value Calculator
  • Atal Pension Yojana
  • Cost of Delay Calculator
  • Become a Crorepati
  • Tools:
  • CAGR Calculator
  • SIP Calculator
  • eLearnOptions
  • Future Value Calculator
  • Present Value Calculator
  • Atal Pension Yojana
  • Cost of Delay Calculator
  • Become a Crorepati

© 2025 Elearnmarkets. All Rights Reserved

  • Visit Elearnmarkets
  • Courses
  • Webinars
  • Financial Guides
  • Get Free Counselling
  • Visit Elearnmarkets
  • Courses
  • Webinars
  • Financial Guides
  • Get Free Counselling

Download Our App

No Result
View All Result
  • Article Categories
    • Basic Finance
    • Derivatives
    • Financial Planning
    • Fundamental Analysis
    • Technical Analysis
    • ETFs & Mutual Funds
    • Marketshala
    • Miscellaneous
  • Language
    • Hindi
    • Bengali
    • English
  • Courses
  • Webinars
  • Stories
Get Free Course

© 2024 Elearnmarkets All Rights Reserved

A Handbook of Technical Analysis
To start your trading journey as a seasoned technical analyst
Download Guide For FREE
Trading Mentorship Program