Elearnmarkets - Financial Market Learning
  • Courses
  • Webinars
  • Stories
  • Language
    • English
    • Hindi
    • Bengali
No Result
View All Result
Get Free Course
  • Basic Finance
  • Derivatives
    • Futures
    • Options
  • Financial Planning
  • Fundamental Analysis
  • Technical Analysis
  • Mutual Funds
  • Marketshala
  • Miscellaneous
Elearnmarkets - Learn Stock Market, trading, investing for Free
  • Courses
  • Webinars
  • Stories
  • Language
    • English
    • Hindi
    • Bengali
No Result
View All Result
Get Free Course
Elearnmarkets - Learn Stock Market, trading, investing for Free
No Result
View All Result
Home Technical Analysis
Learn Trading with Donchian Channel in 5 mins 1

Learn Trading with Donchian Channel in 5 mins

Elearnmarkets by Elearnmarkets
September 6, 2023
in Technical Analysis, Charts, Patterns & Indicators
Reading Time: 4 mins read
4
12.8k
VIEWS
Share on FacebookShare on XShare on WhatsApp

The Donchian Channel is developed by Richard Donchian.

Donchian Channels are useful in the trending as well as the ranging markets.

This indicator consists of three bands in which the mid-band is an average of the upper and lower channel lines.

The indicator can be used in all time frames, such as intraday or weekly charts and can be applied to forex, stocks, options, or futures markets.

In this blog we will discuss Trading strategies using Donchain Channels:

What is Donchian Channels?

Donchian Channels is a popular indicator that determines volatility in the market prices.

These are created by three lines which are generated by moving average calculations.

This indicator is formed by upper and lower bands around a median band.

The upper band represents the highest price of a security over particular periods say N periods whereas the lower band represents the lowest price of a security over N periods.

The area between the upper and lower bands is the Donchian Channel.

Calculation of Donchian Channel

Donchian Channels is a simple indicator which plots the highest high and lowest low of the last “n” periods.

The “n” periods depend on the trader’s choice, who can select the period according to their trading strategy that ranges from a day, hour and minutes, etc.

The default period is set as 20 days by Richard Donchian which is used by most of the traders.

It does not include the current price bar in its calculation.

For instance, if you want to apply this indicator for over 20 candlesticks, then the bands are calculated based on the 20 prior candlesticks.

Trading with Donchian Channels

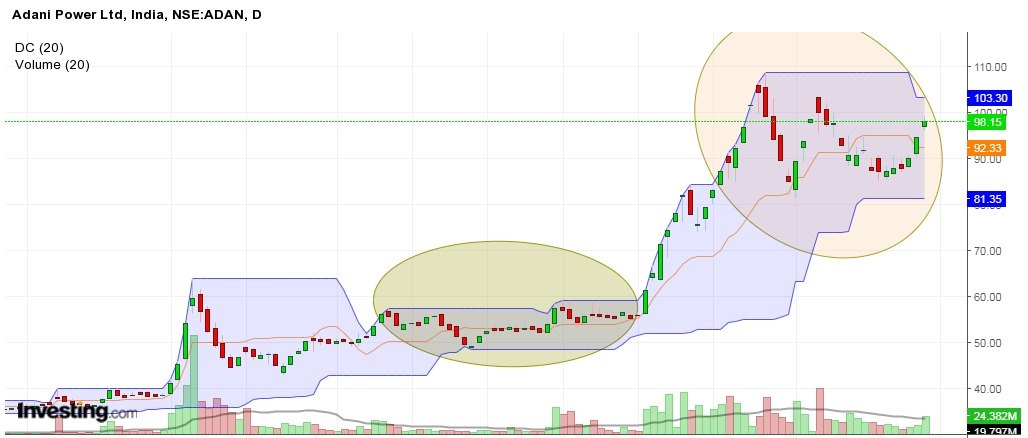
One of the ways of using Donchian Channels is to determine the support and resistance levels.

The channels get wider when there are heavy fluctuations in prices and get narrow when prices are relatively flat.

In the below image, you can see that the wider price range is highlighted in red whereas the narrow price range is in green.

Trading with Donchian Channels

Use of Donchain Channels in Trading

It can be used in the following ways:

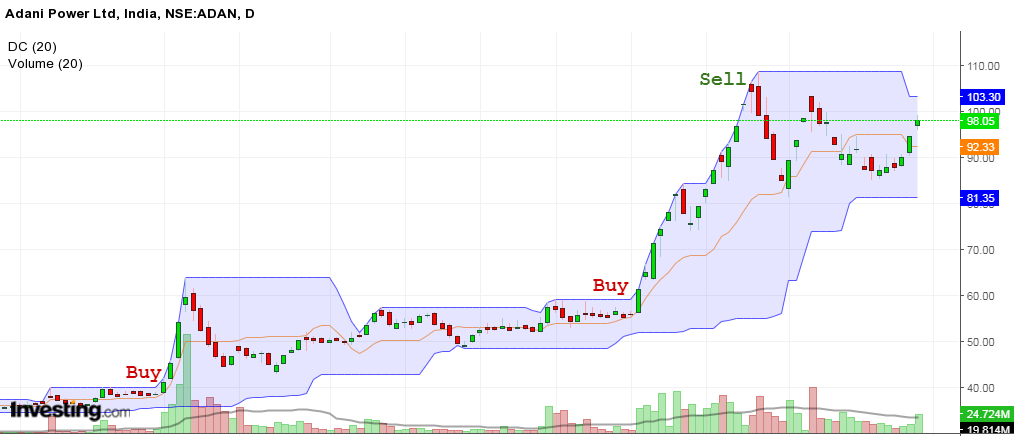
1. Breakout indicator

Donchian channels are used for identifying the breakout of a stock that helps the traders to take either long or short positions.

When the stock is trading higher than the Donchian channels then traders can take a long position, and book their profits or short the stock if it is trading below the channels

In the image below we have highlighted major breakouts in the daily chart of Adani Power Ltd.:

breakout in adani chart

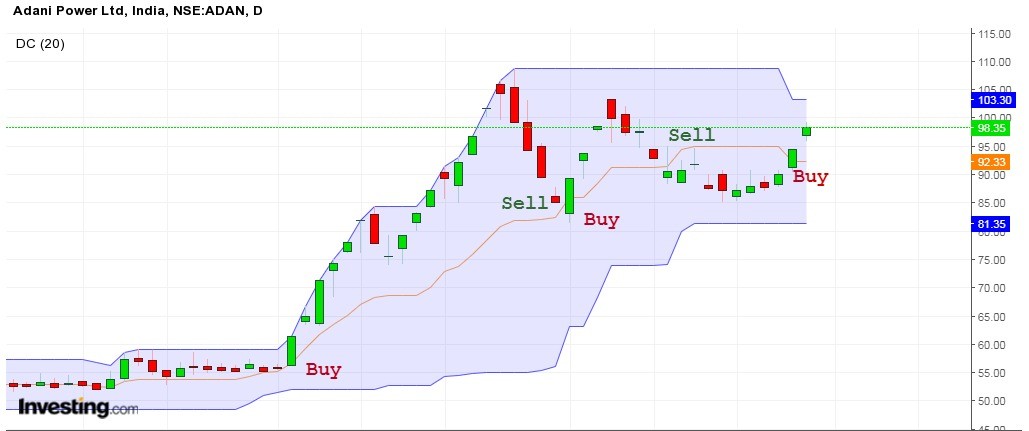
2. Trading with the Middle Band

The middle band is calculated as the average of the upper and lower bands. This band in Donchian channels is also used as a breakout indicator.

Open a long position when the stock rises above the middle band and short when the stock is trading below the middle band of the Donchian channel as shown below on the daily chart of Adani Power Ltd.:

taking long and short trade using donchain channel

Traders can also use other indicators like MACD, Stochastics, Volume Oscillator to develop their own trading strategies using this indicator.

Key Takeaways

  • Donchian Channel is a popular indicator that determines volatility in the market prices.
  • This indicator is formed by upper and lower bands around a median band.
  • It is used for identifying the breakout of a stock that helps the traders to take either long or short positions.
  • The middle band is calculated as the average of the upper and lower bands. This band in Donchian channels is also used as a breakout indicator.
  • Traders can also use other indicators like MACD, Stochastics, Volume Oscillator to develop their own trading strategies using this indicator.

Happy Investing!

Tags: donchian channelsIndicatorintermediate
ShareTweetSend
Get Kotak Offer Get Kotak Offer Get Kotak Offer
Previous Post

What is Futures and Option Trading – A Beginners Guide

Next Post

20 technical indicators you can trust while stock trading in 2021

Elearnmarkets

Elearnmarkets

Elearnmarkets (ELM) is a complete financial market portal where the market experts have taken the onus to spread financial education. ELM constantly experiments with new education methodologies and technologies to make financial education effective, affordable and accessible to all. You can connect with us on Twitter @elearnmarkets.

Related Posts

Understand Slippage in Trading
Technical Analysis

What is Slippage in Trading? Meaning & Examples

March 28, 2025
307
Breakout trading strategies
Technical Analysis

Top 5 Breakout Trading Strategies

March 12, 2025
1.1k
5 stocks for today
Technical Analysis

5 Stocks to Buy Today That Could Beat the NIFTY in 2025!

May 5, 2025
404
Image describing What is marginal trading facility
Technical Analysis

 What is a Margin Trading Facility? Advantages & Risks

April 4, 2025
664

Comments 4

  1. Saleem husain says:
    4 years ago

    Good evening.respected sir/Medam. I wanted learn trading.

    Reply
    • Sakshi Agarwal says:
      4 years ago

      Hi,

      We are glad that you liked our post, please refer to our blog on Basic Toolkit for Stock Market Beginners

      Thank you for Reading!

      Reply
  2. JAIKUMAR MENON says:
    4 years ago

    Very well explaned.

    Reply
    • Sakshi Agarwal says:
      4 years ago

      Hi,

      We are glad that you liked our post.

      Thank you for Reading!

      Reply

Leave a Reply Cancel reply

Your email address will not be published. Required fields are marked *

Disclaimer

Elearnmarkets (Kredent InfoEdge Pvt. Ltd.) is a SEBI-registered Research Analyst (RA) entity (SEBI Registration No.: INH300007493). The information provided in this article is for educational and informational purposes only and should not be considered as an offer to buy or sell any securities or investment products.

The stocks, securities, and investment instruments mentioned herein are not recommendations under SEBI (Research Analysts) Regulations, 2014. Readers are advised to conduct their own due diligence and seek independent financial advice before making any investment decisions.

Investments in securities markets are subject to market risks. Please read all related documents carefully before investing. Investing in Equity Shares,
Derivatives, Mutual Funds, or other instruments carry inherent risks, including potential loss of capital. Elearnmarkets (Kredent InfoEdge Pvt. Ltd.) does not provide any guarantee or assurance of returns on any investments. Past performance is not indicative of future performance.

Elearnmarkets Logo

Follow Us

Facebook-f X-twitter Instagram Linkedin-in Youtube Telegram

Register on Elearnmarkets

Continue your financial learning by creating your own account on Elearnmarkets.com

Register Free Account

Download App

Playstore logo
Download on app store

Categories

  • Basic Finance
  • Derivatives
  • Financial Planning
  • Fundamental Analysis
  • Technical Analysis
  • Mutual Funds
  • Miscellaneous

Popular On Elearnmarkets

  • Market Superheroes:
  • Vivek Bajaj
  • Chetan Panchamia
  • Ashish Kyal
  • Premal Parekh
  • Abhijit Paul
  • Jegan
  • Sivakumar Jayachadran
  • Jyoti Budhia
  • Vivek Gadodia
  • Vishal Mehta
  • Piyush Chaudhry
  • Santosh Pasi
  • Gomathi Shankar
  • Market Superheroes:
  • Vivek Bajaj
  • Chetan Panchamia
  • Ashish Kyal
  • Premal Parekh
  • Abhijit Paul
  • Jegan
  • Sivakumar Jayachadran
  • Jyoti Budhia
  • Vivek Gadodia
  • Vishal Mehta
  • Piyush Chaudhry
  • Santosh Pasi
  • Gomathi Shankar
  • Courses:​
  • Options Trading
  • Dow Theory
  • Momentum Trading
  • Stock Investing
  • Harmonic Chart Patterns
  • Algo Trading
  • Elliot Wave Theory
  • Advanced Excel
  • Cryptocurrency
  • NSE Certification Course
  • Courses:​
  • Options Trading
  • Dow Theory
  • Momentum Trading
  • Stock Investing
  • Harmonic Chart Patterns
  • Algo Trading
  • Elliot Wave Theory
  • Advanced Excel
  • Cryptocurrency
  • NSE Certification Course
  • Webinars:
  • Bank Nifty Scalping
  • Intraday Trading Strategies
  • Options Trading Strategies
  • Options selling
  • Price Action
  • Relative Strength
  • Tax Planning
  • Options Buying
  • Growth Stocks
  • Portfolio Management
  • Risk Management
  • Renko Charts
  • Crude Oil
  • Traders Psychology
  • Moving Average
  • Multibagger Stocks
  • Free Learning Modules:
  • Intraday Trading
  • Options Scalping
  • Swing Trading
  • Financial Modelling
  • RSI Indicator
  • Bollinger Bands
  • Pricing of Futures
  • Personal Finance
  • Initial Public Offerings (IPO)
  • Value Investing
  • Technical Indicators
  • Candlesticks
  • Chart Patterns
  • Option Greeks
  • ELSS Funds
  • Banking and Insurance
  • Real Estate
  • Gold
  • Book Summaries:
  • Rich Dad Poor Dad
  • Psychology of Money
  • The Intelligent Investor
  • The Richest Man in Babylon
  • Think and Trade Like a Champion
  • Value Investing and Behavioural Finance
  • Trading in the Zone
  • Learn to Earn
  • Book Summaries:
  • Rich Dad Poor Dad
  • Psychology of Money
  • The Intelligent Investor
  • The Richest Man in Babylon
  • Think and Trade Like a Champion
  • Value Investing and Behavioural Finance
  • Trading in the Zone
  • Learn to Earn
  • Tools:
  • CAGR Calculator
  • SIP Calculator
  • eLearnOptions
  • Future Value Calculator
  • Present Value Calculator
  • Atal Pension Yojana
  • Cost of Delay Calculator
  • Become a Crorepati
  • Tools:
  • CAGR Calculator
  • SIP Calculator
  • eLearnOptions
  • Future Value Calculator
  • Present Value Calculator
  • Atal Pension Yojana
  • Cost of Delay Calculator
  • Become a Crorepati

© 2025 Elearnmarkets. All Rights Reserved

  • Visit Elearnmarkets
  • Courses
  • Webinars
  • Financial Guides
  • Get Free Counselling
  • Visit Elearnmarkets
  • Courses
  • Webinars
  • Financial Guides
  • Get Free Counselling

Download Our App

No Result
View All Result
  • Article Categories
    • Basic Finance
    • Derivatives
    • Financial Planning
    • Fundamental Analysis
    • Technical Analysis
    • ETFs & Mutual Funds
    • Marketshala
    • Miscellaneous
  • Language
    • Hindi
    • Bengali
    • English
  • Courses
  • Webinars
  • Stories
Get Free Course

© 2024 Elearnmarkets All Rights Reserved

A Handbook of Technical Analysis
To start your trading journey as a seasoned technical analyst
Download Guide For FREE
Guidebook On Chart Patterns
Take Your Trading To The Next Level With Strategies Shared In This Ebook
Download Guide For FREE
Trading Mentorship Program