
MACD Indicator- We, the Homo sapiens, want to live within our comfort zone. We love to change but hate being changed. I can hear an echo. Thanks for converging your thought with that of mine. It has to be. After all, you and I are traders. Hence keeping our thought equality I would write this blog on a very simple and easy-to-use tool Moving Average Convergence Divergence. Yes, it’s one of our most used indicators. Right?
Note: “MACD” is also known as “MAC–DEE” in colloquial terms of traders. Being a chartist, you must be knowing that each price reflects the consensus of value among the mass of market participants at the moment of the trade.
- What is Moving Average Convergence Divergence-MACD Indicator?
- What makes MACD indicator so useful?
- Moving Average Convergence Divergence-MACD Indicator Formula
- Interpretation of MACD Indicator
- Importance of Centre line/Zero line and Signal line in Crossovers
- Trading Rules
- More fundas on Moving Average Convergence Divergence- MACD Indicator
- Bottom Line
What is Moving Average Convergence Divergence-MACD Indicator?
A moving average is nothing but a representation of an average consensus of value in a selected period, rather, a composite photo of mass consensus. It identify trends by filtering out daily price ripples.
Excessive variation makes it difficult for traders to get clarity on a security’s overall trend. The price movement is smoothed out by the help of moving average. Once, the daily fluctuations are removed we can identify the true trend and increase our probability to win a trade. The average can be anything, the time frame depends fully on traders. You are free to choose any.
There is a variety of moving averages which differ in the calculation but their interpretation remains the same. The calculations only differ in regards to the weighting that you place on the price data, shifting from equal weighting of each price point to more weight being placed on recent data.
The most common types of moving average are simple, linear and exponential.
A beautiful oscillator can be made by comparing the difference between two moving averages. The use of two moving averages in the double crossover method, therefore, takes on greater significance and becomes an even more useful technique. All credit goes to Gerald Appel, an analyst and money manager in New York for creating this trading indicator in the late 1970s.
It is one of the simplest weapons that traders use to bring out the profit from another trader. It helps to identify changes in the strength, direction, momentum, and duration of a trend in a stock’s price.
In layman’s term, MACD turns two trends following indicators i.e. moving averages into a momentum oscillator.
How ? Just by subtracting the longer moving average from the shorter moving average.
What makes MACD indicator so useful?
It’s only because it can be used in both the approach i.e. trend following and momentum. Isn’t it interesting?
You definitely know that MACD line which is also known as the faster line is the difference between two exponentially smoothed moving averages of closing prices (usually the last 12 and 26 days or weeks).
The slower line (called the signal line) is usually a 9 period exponentially smoothed average of the MACD line.
You know the creator originally recommended one set of numbers for buying signals and another set for selling signals. But what do we use? I almost heard your voice. You must have said 12,26 and 9. These numbers are set as default values in all instances.
Let us follow the footsteps of the creator and create MACD
By now you must have got an overview of MACD. The original MACD indicator consists of two lines: a solid line (also known as the MACD Line) and a dashed line (also known as the Signal Line).
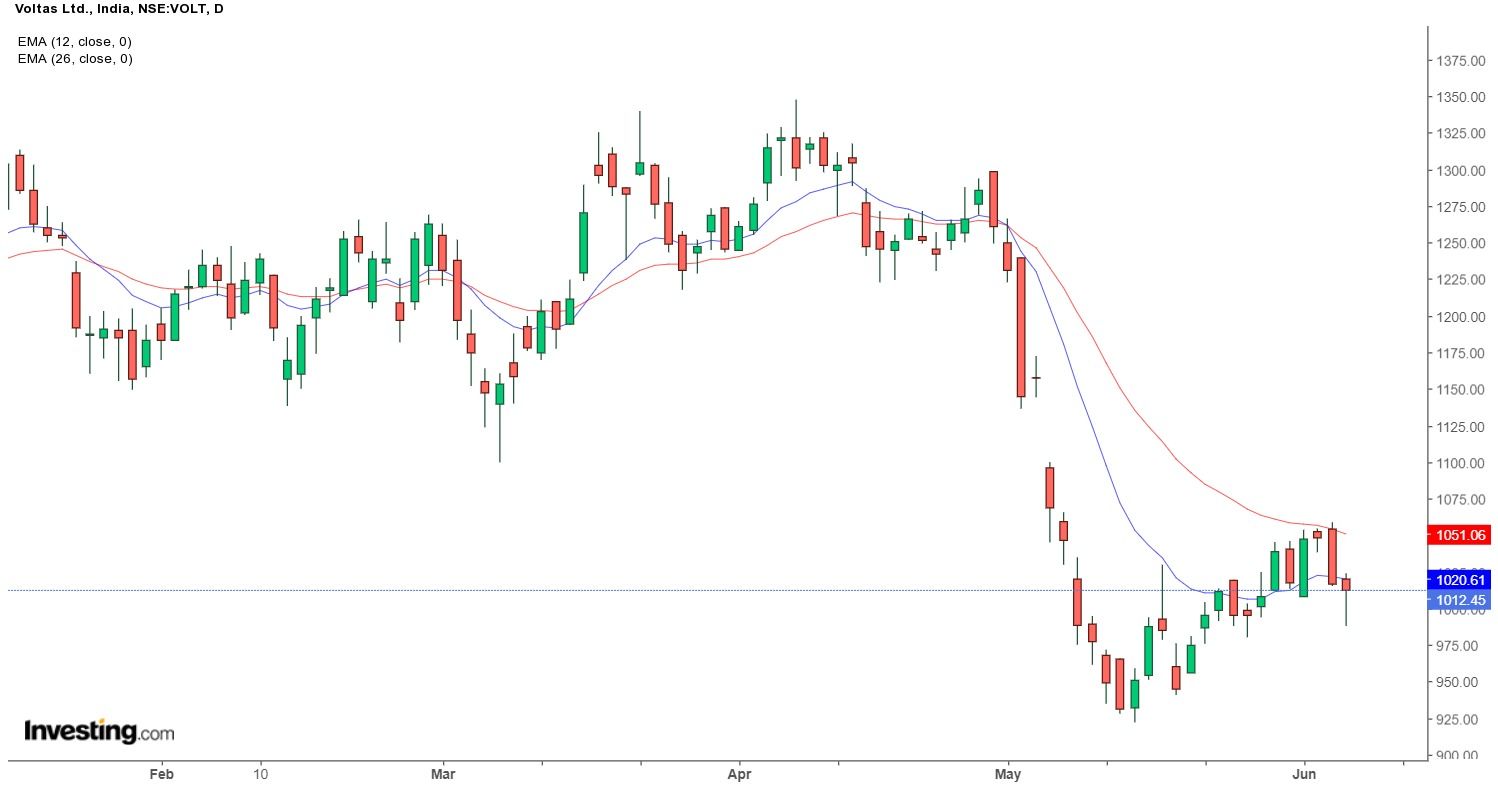
The former line i.e. the MACD line is made up of two exponential moving averages (abbreviated form is EMA).
Basically, it responds to changes in price relatively quickly, whereas the signal line which is made up of the MACD line, just smoothed with another EMA.
It is usually slower in response to price changes compared to the MACD line.
Learn from Experts in 2 hours – Magic of Moving Averages
Moving Average Convergence Divergence-MACD Indicator Formula
Let me show you step by step formula for creating MACD indicator.
If you have this in your subconscious mind, then you can skip it definitely.
Step 1) Calculate a 12 days EMA of closing prices
Step 2) Calculate a 26 days EMA of closing prices
Step 3) Subtract the 26 days EMA from the 12 days EMA, and plot their difference as a solid line. This is known as the fast MACD line.
Step 4) Calculate a 9 days EMA of the fast line, and plot the result as a dashed line. This is known as the slow Signal line.
Note: The values 12, 26 and 9 are set as default while it was constructed (though there are some reasons of course).
You should keep in mind that MACD is derived from the moving averages.
Hence, it is inherently a lagging indicator.
As an added information I would tell you that it is less useful for securities that are oscillating in a tight range or range bound or are showing some erratic movements.
Interpretation of MACD Indicator
Mac-Dee is nothing except a hide and seek between two moving averages.
Yes, you are correct. I wanted to mean the convergence and divergence of these two moving averages. According to the Oxford dictionary “convergence is the process or state of converging”.
In technical analysis, it is the situation when the moving averages move towards each other whereas it is just the opposite in case of divergence.
It occurs when the moving averages move away from each other.
Usually, the RSI divergences appear between the trend of the MACD lines and the price lines.
Before delving deeper into “divergence” let’s understand the significance of “crossovers”.
Importance of Centre line/Zero line and Signal line in Crossovers
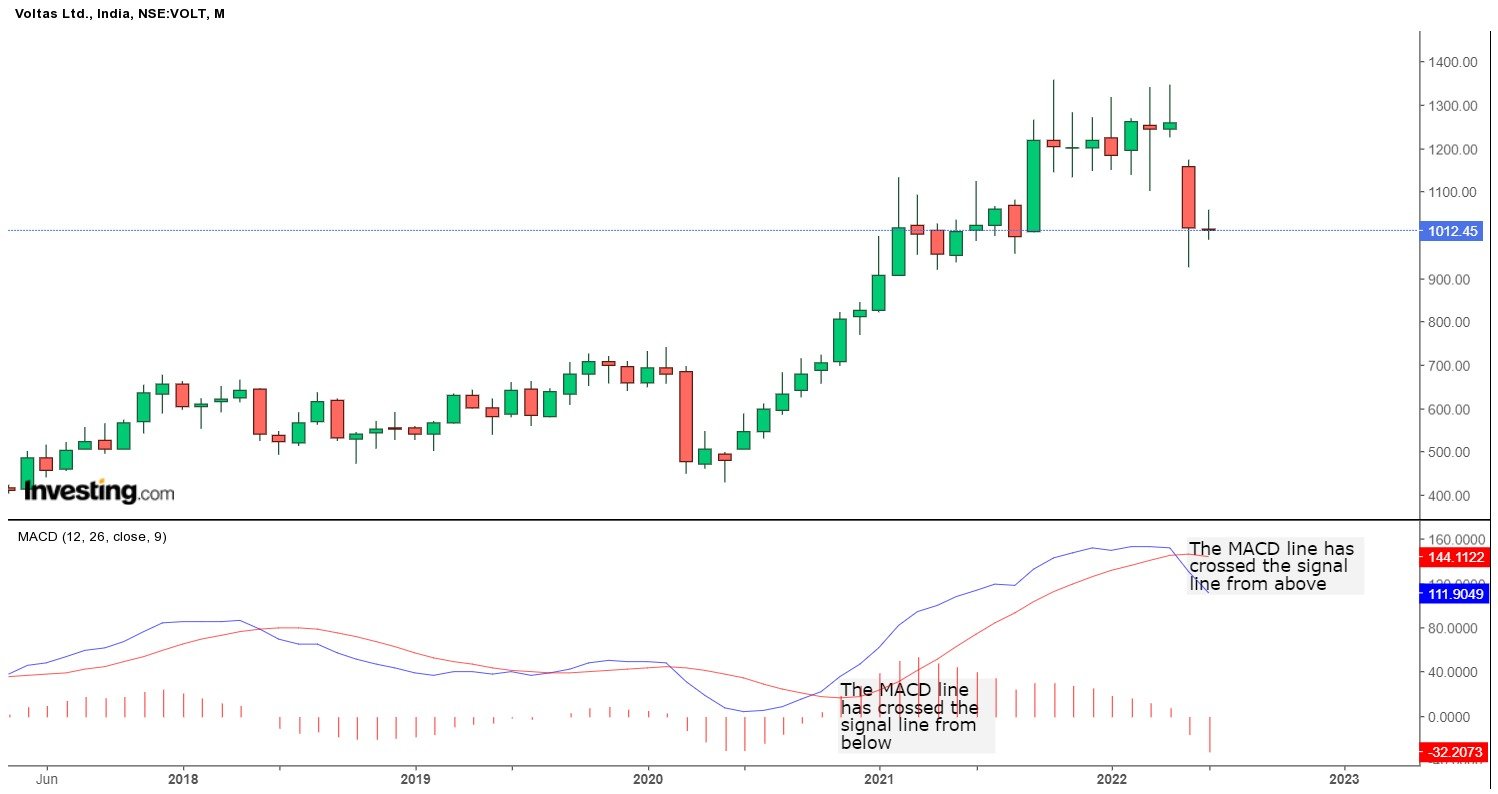
The MACD values oscillate around a zero line (also known as the center line). It resembles an oscillator. In layman’s terms when the MACD value is positive, it indicates that the 12 days EMA has crossed the 26 days EMA from below.
After the crossover, the diversion of the shorter EMA from the larger counterpart is directly proportional to positive values.
It signifies an increase in upside momentum.
Whereas, when the MACD indicator is negative, it indicates that the 12 days EMA has crossed the 26 days EMA from above.
After the crossover, the diversion of the shorter EMA from the larger counterpart is directly proportional to negative values.
It signifies an increase in downside momentum.
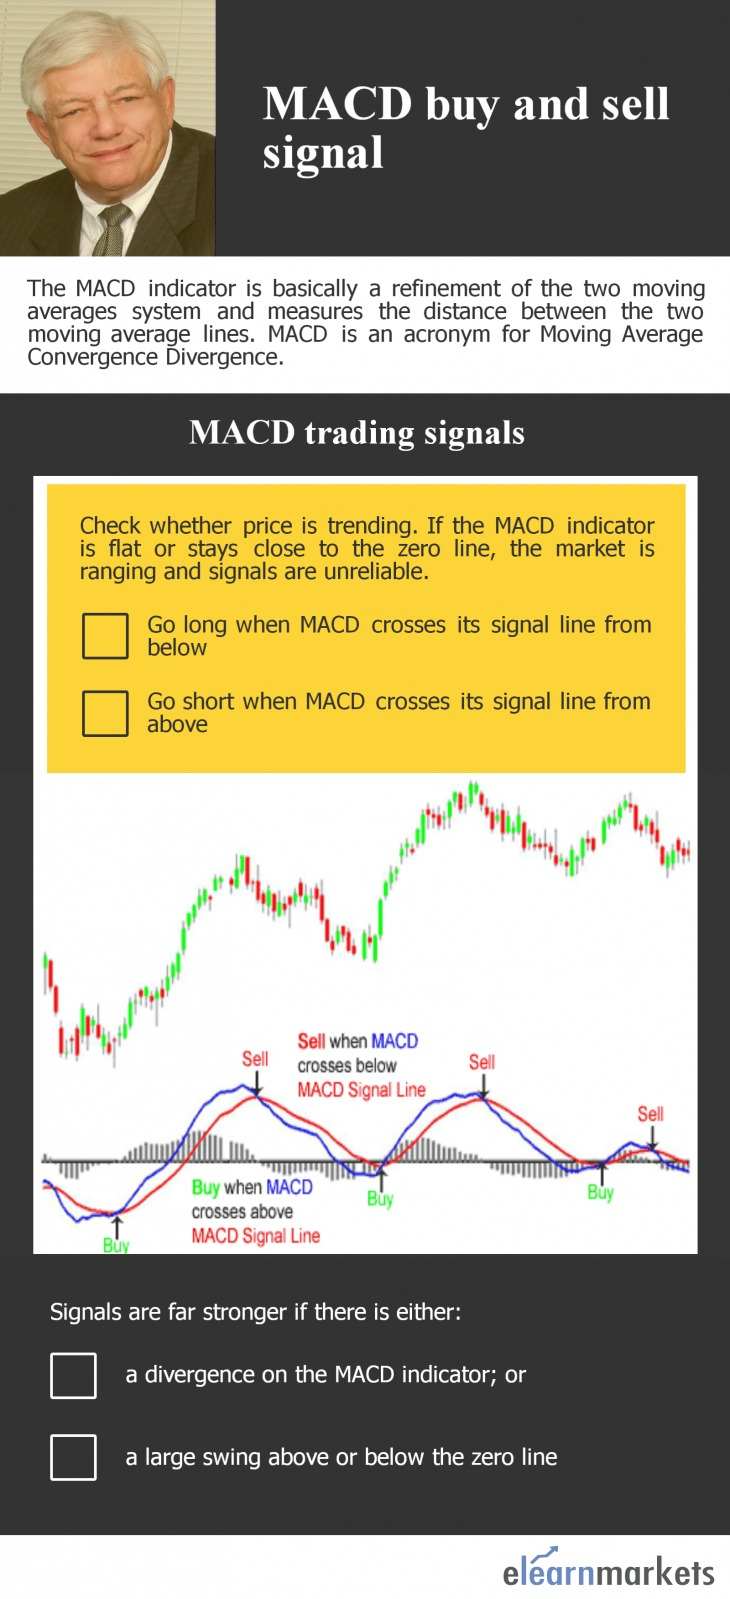
Buy and sell signals are triggered when the fast MACD line crosses above or below the slow Signal line respectively.
Usually, the most common type of crossovers is the Signal line Crossovers.
When the MACD turns up and crosses above the Signal line, it is known as Bullish Crossovers.
On the other hand, when the MACD indicator turns down and crosses below the Signal line, it is known as Bearish Crossovers.
You can even recognize the overbought and oversold condition.
An overbought condition is typically when the lines are too far above the zero line.
On the other hand, an oversold condition is typically when the lines are too far below the zero line.

One can use the crossover above and below the zero line to generate buy and sell signals.
Let me link it to your conscious mind.
The above-mentioned crossover system signals that the shorter EMA i.e. 12 days has crossed the other one i.e. 26 days.
The direction is identified by the direction of the moving average crossovers.
Note: Being a chartist I would tell you that “Divergence” is a very important term in technical analysis.
It appears between the trend of the MACD lines and the price line.
There are two types of divergences.
A positive or so-called “bullish” and a negative or so-called “bearish” divergences.
I hope you are familiar with these terms. If not, continue reading…
A positive divergence occurs when the MACD lines are well below the zero/ center line and start to move up ahead of the price line. It is often a signal of a market bottom. You can draw simple trendlines on the MACD lines to identify important trend changes.
A negative divergence occurs when the MACD lines are well above the zero/ center line and start to weaken while prices continue to move higher. It is often a warning of a market top.
Trading Rules
When there is a change in market tide, it is identified by the crossover between the MACD and Signal lines. If you trade in the direction of a crossover, it means you are going with the flow of the market.
- When the fast MACD line crosses above the slow Signal line, it gives a buy signal. Go long, and place a protective stop below the latest minor low.
- When the fast line crosses below the slow line, it gives a sell signal. Go short, and place a protective stop above the latest minor high.
The above strategies are the sole properties of Dr. Alexander Elder.
More fundas on Moving Average Convergence Divergence- MACD Indicator
Different traders have different perceptions.
The time frame of trading depends on the trader.
Hence, many traders try to customize MACD by using different parameters instead of the default settings (12, 26 & 9).
Another popular choice is 5-34-7, which increases sensitivity compared to its larger counterpart.
The larger the parameters lesser will be the crossovers, though the oscillating nature of MACD around zero will still be there.
Moreover, there is a common trait among traders to link MACD to market cycles.
The trouble is cycles are not present in the markets most of the time.
If you use cycles, the first EMA should be one quarter the length of the dominant cycle and the second EMA half the cycle length.
As you all know that the third EMA is used for smoothing purpose whose length does not have to be tied to a cycle.
Remember if you fiddle with this instrument long enough, you can definitely make it give you any signal you want using the same data.
Bottom Line
Well, if you want to take better trading decisions don’t forget to use a mix of technical indicators. Some of the concepts mentioned in this article are the results of my opinions on the basis of the theories of Dr. Alexander Elder and John J. Murphy.
As an expression of gratitude, I would like to thank you for taking the trouble to read up to this sentence. I hope you got some clarity on “MAC-DEE”. Be free to leave your suggestions or comments or questions in the space below.
Also, if you found this blog interesting , then you will also love our stock market technical analysis course.
In order to get the latest updates on Financial Markets visit StockEdge


Thanks a lot. This is great content. I might share some for you guys too. Great work poster!
It’s remarkable in favor of me to have a site, which is useful in support of my experience. thanks admin|
There is noticeably a bundle to know about this. I assume you made certain nice points in features also.
Need only Technical Analysis Course.