Key Takeaways:
- Begins with a strong bullish candle, reflecting aggressive buying in an uptrend
- Followed by a small-bodied candle or Doji, showing hesitation and a pause in momentum
- Ends with a strong bearish candle that closes well into the first candle’s body, confirming seller control
- The Evening Star Doji variation signals even stronger reversal pressure, often marking the top
- Miss it and you risk holding through a trend reversal—confirmation matters, but early recognition gives an edge
The Evening Star pattern is a candlestick pattern that appears at the end of the uptrend and signals that a downtrend is going to take place.
Whereas, The Morning Star is a candlestick pattern that appears at the end of the downtrend and signals upside reversal.
Traders should be aware of these different trading patterns, and the Evening Star is an important one to pay attention to.
As the Evening Star indicates that the uptrend is going to end, the appearance of it is a red flag to traders and gives a sign that it is time to book profits.
In this blog, we will understand the formation of the Evening Star pattern and will also explain how to trade it properly.
What is the Evening Star Candlestick Pattern?
An Evening Star is a candlestick pattern that is used by technical analysts for analyzing when a trend is about to reverse.
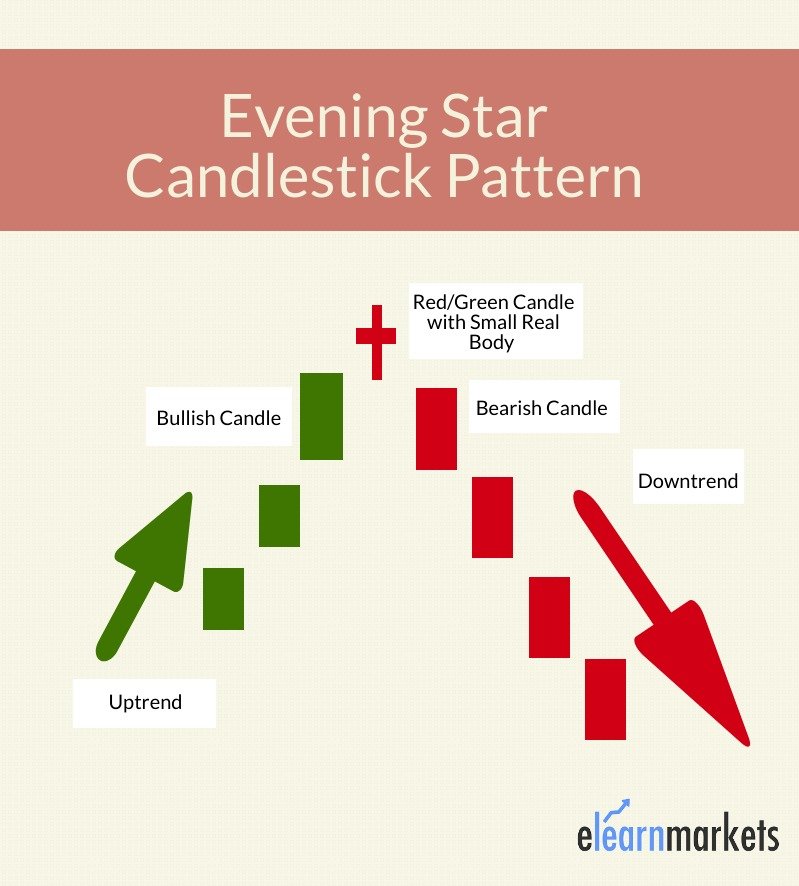
It consists of three candlesticks: a large bullish candlestick, a small-bodied candle, and a bearish candlestick.
Evening Star patterns appear at the top of a price uptrend, signalling that the uptrend is going to end.
The Morning Star pattern is the opposite of the Evening Star, which indicates a bullish reversal.
Formation of Evening Star Candlestick Pattern
Here is the formation of the Evening Star Candlestick Pattern:

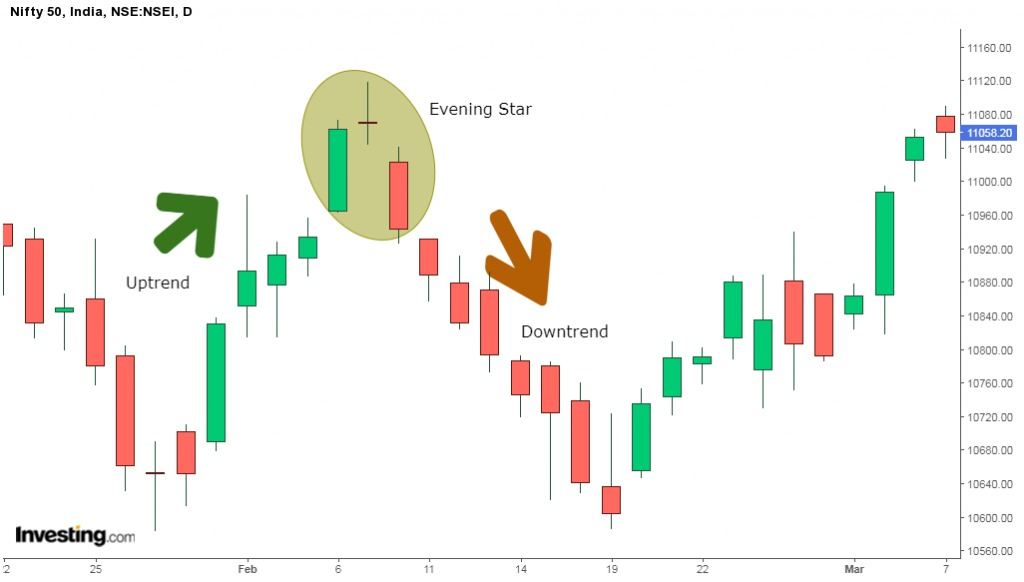
Trading Example:
One can identify this candlestick pattern by the formation of below four candlesticks:
- Small bearish or bullish candle: The second one is a small candle that indicates that there is uncertainty and shows the signs of a slowing uptrend.
- Large bearish candle: This signals selling pressure by the bears.
We can see that the Evening Star pattern is formed in the Nifty 50 chart below.

Once the formation of the candlestick has been completed, traders can enter a sell position at the opening of the next bearish candle
The traders can place their targets at previous levels of support or consolidation.
One can place a stop loss above the recent swing high. One should note that traders should always maintain a positive risk-to-reward ratio.
Evening Star Doji:
Evening Doji Stars are formed when the market opens and closes at the same or almost the same level.
This indecision candlestick pattern helps the traders to give a red flag and thus prevent further buying. The formation of the bearish candle after the Doji signals the bearish confirmation.
What are the pros and cons of evening star candlesticks?
This candlestick pattern has both pros and cons. Evening Star pattern occurs frequently in the charts and it also presents well-defined entry as well as exit levels.
This candlestick pattern is also easy to identify as they occur frequently in the charts. But one should also note that if it signals a failed reversal, then the price could move further up.
When the evening star pattern is backed up by volume and other technical indicators like resistance level, then it confirms the signal.
Bottomline
Evening Star is a candlestick pattern appearing at the end of the uptrend and signals that an uptrend is going to take place It is a bearish candlestick pattern that consists of three candles: a large bullish candlestick, a small-bodied candle, and a bearish candle. Evening Star pattern occurs frequently in the charts and it also presents well-defined entry as well as exit levels. When the evening star pattern is backed up by volume and other technical indicators like resistance level, then it confirms the signal.
Read More- All 35 Candlestick Chart Patterns in the Stock Market
Frequently Asked Questions (FAQs)
What is Evening Star Candlestick Pattern?
A technical analysis tool that indicates the reversal of upward price movement to negative momentum is the evening star pattern. Though it doesn’t happen often, the pattern is regarded as a trustworthy bearish indication. Another bullish trend-reversal pattern that provides a purchasing signal is the Morning Star pattern.
How Accurate is the Evening Star Pattern?
The evening star has a 71% accuracy rate in predicting a bearish reversal, according to Bulkowski’s Pattern Site.
Discover profitable trading strategies with advanced Scans from StockEdge.


