Elearnmarkets - Financial Market Learning
  • Courses
  • Webinars
  • Stories
  • Language
    • English
    • Hindi
    • Bengali
No Result
View All Result
Get Free Course
  • Basic Finance
  • Derivatives
    • Futures
    • Options
  • Financial Planning
  • Fundamental Analysis
  • Technical Analysis
  • Mutual Funds
  • Marketshala
  • Miscellaneous
Elearnmarkets - Learn Stock Market, trading, investing for Free
  • Courses
  • Webinars
  • Stories
  • Language
    • English
    • Hindi
    • Bengali
No Result
View All Result
Get Free Course
Elearnmarkets - Learn Stock Market, trading, investing for Free
No Result
View All Result
Home Technical Analysis Charts, Patterns & Indicators
लैगिंग बनाम लीडिंग टेक्निकल इंडिकेटर - क्या आप अंतर जानते हैं? 1

लैगिंग बनाम लीडिंग टेक्निकल इंडिकेटर – क्या आप अंतर जानते हैं?

Elearnmarkets by Elearnmarkets
August 23, 2023
in Charts, Patterns & Indicators, Technical Analysis
Reading Time: 5 mins read
0
3.7k
VIEWS
Share on FacebookShare on XShare on WhatsApp

English: Click here to read this article in English.

टेक्निकल इंडिकेटर उन लोगों के लिए ट्रेडिंग का दिल है जिनके ट्रेडिंग का तरीका टेक्निकल एनालिसिस है।

ये इंडीकेटर्स महत्वपूर्ण हैं चाहे आप डे ट्रेड करें या स्विंग ट्रेड। टेक्निकल एनालिसिस का मुख्य लक्ष्य भविष्य के मूल्य गतिविधि की भविष्यवाणी करना है। ट्रेडिंग पैटर्न और इंडीकेटर्स की कला को समझना इस इंडिकेटर के बारे में समझने में आपकी मदद करेगा।

एक और कदम आगे बढ़ाते हुए क्निकल इंडिकेटर को आगे विभाजित किया जाता है: लीडिंग और लैगिंग इंडिकेटर में।

इस लेख में, हम दोनों प्रकार के इंडीकेटर्स के बारे में  चर्चा करते हैं और पहचानते हैं कि कौन सा आपकी ट्रेडिंग शैली के अनुकूल है:

Table of Contents
एक Leading Technical Indicator क्या है?
Lagging Technical Indicator क्या है?
Lagging और Leading Technical Indicator के बीच अंतर?/a>
Lagging & Leading Technical Indicatos की कमियां
लीडिंग और लैगिंग टेक्निकल इंडीकेटर्स का संयोजन
लीडिंग बनाम लैगिंग संकेतक – कौन सा बेहतर है?
मूल बातें

एक Leading Technical Indicator क्या है?

Leading technical indicator आगे मूल्य गतिविधि का अनुमान लगाने के लिए डिज़ाइन किए गए हैं, जो ट्रेडर को ट्रेड में बढ़त देने में मदद करता है। 

एक लीडिंग टेक्निकल इंडिकेटरडिंग इंडिकेटर प्रवेश या निकास के शुरुआती संकेत प्रदान करते हैं और ट्रेड के अधिक अवसर प्रदान करते हैं। वे इंडिकेटर की गणना करने के लिए उपयोग की जाने वाली कई अवधियों में मूल्य गति का संकेत देते हैं।

कुछ प्रसिद्ध प्रमुख इंडीकेटर्स हैं:

  •  कमोडिटी चैनल इंडेक्स (सीसीआई)
  •  स्टोकेस्टिक ऑसिलेटर 
  •  रिलेटिव स्ट्रेंथ इंडेक्स
  •  विलियम% आर 
  •  वॉल्यूम

कीमतों में बदलाव होने से पहले वॉल्यूम में बदलाव दिखते हैं क्योंकि यह बाजार में खरीदारी और बिक्री के दबाव का सही मायने में प्रतिनिधित्व करता है।

SBI chart

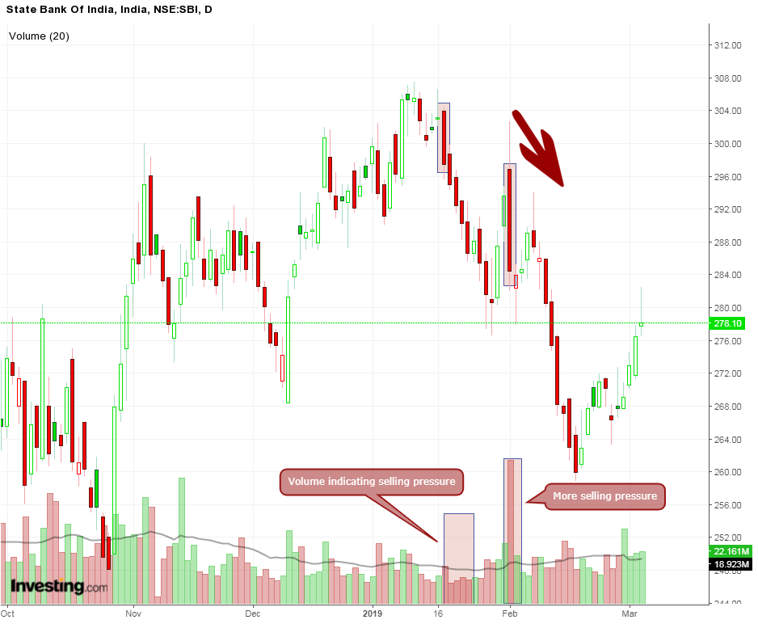
यदि आप पहले चिन्हित मूल्य और वॉल्यूम  का बारीकी से विश्लेषण करते हैं तो यह है कि वॉल्यूम गिरने लगता है। दूसरे वॉल्यूम के गिरावट में, बिना वॉल्यूम के चार्ट को देखने वाले किसी व्यक्ति के लिए यह जानना आसान हो जाएगा कि ट्रेंड रिवर्स हो गई है, लेकिन स्टॉक में बिकवाली का दबाव जारी है।

Lagging Technical Indicator क्या है?

लैगिंग  इंडीकेटर्स वो इंडीकेटर्स हैं जो एक ट्रेंड का पालन करते हैं फिर मूल्य रिवर्सल की भविष्यवाणी करते हैं। यह एक इवेंट को फॉलो करता है।

जब कीमतें लंबे ट्रेंड्स में चलती हैं तो ये इंडीकेटर्स अच्छा काम करते हैं।

वे कीमतों में आने वाले बदलावों के बारे में संकेत नहीं देते हैं, बस यह बताते हैं कि क्या कीमतें बढ़ रही हैं या घट रही हैं ताकि हम तदनुसार निवेश कर सकें।

विलंबित प्रतिक्रिया के बाद भी, कई लोग लैगिंग इंडिकेटर चुनना पसंद करते हैं जो उन्हें अपने परिणामों को मान्य करके अधिक आत्मविश्वास के साथ व्यापार करने में मदद करते हैं।

आमतौर पर ट्रेडर्स स्टॉक में प्रवेश करने से पहले मूल्य ट्रेंड्स की पुष्टि करने के लिए दो या दो से अधिक लैगिंग इंडीकेटर्स का उपयोग करते हैं।

मूविंग एवरेज और मूविंग एवरेज कन्वर्जेन्स एंड डाइवर्जेंस, ट्रेंड फॉलोइंग या लैगिंग इंडिकेटर्स के उदाहरण हैं।

मार्केट एक्सपर्ट्स द्वारा टेक्निकल एनालिसिस अब हुआ आसान कोर्स से टेक्निकल एनालिसिस की मूल बातें जाने

एक उदाहरण लेते हैं:

लैगिंग इंडिकेटर की स्थापना का एक क्लासिक उदाहरण 50 पीरियड  200 पीरियड मूविंग एवरेज है।

आमतौर पर एक सिक्योरिटी को तब बेयरिश कहा जाता है जब 50 एमए 200 एसएमए से नीचे हो जाता है। इसी तरह एक सिक्योरिटी को बुलिश तब कहा जाता है जब 50 एमए 200 एसएमए से ऊपर हो जाता है।

Nifty chart

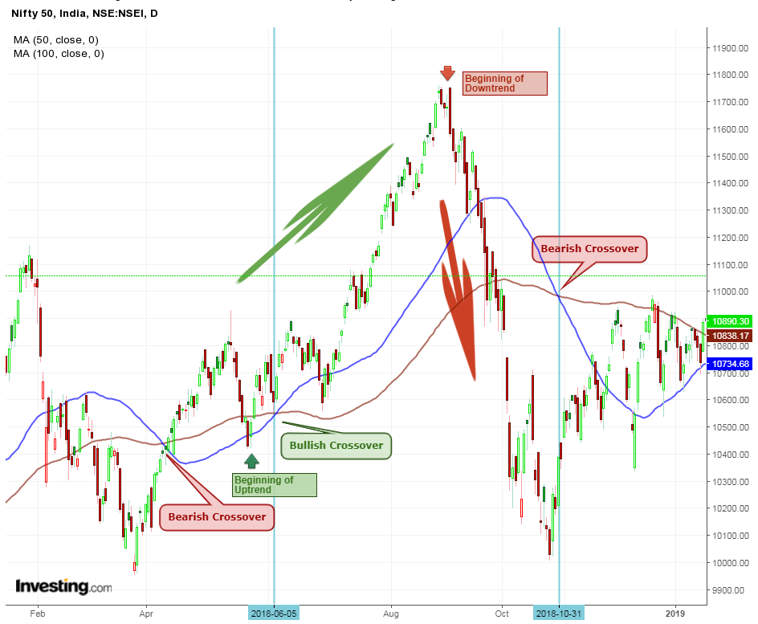
उपरोक्त चार्ट में, 200 और 50 पीरियड के मूविंग एवरेज के बुलिश और बेयरिश क्रोस ओवर्स  द्वारा उत्पन्न इंडीकेटर्स पर ध्यान दें। पहले इंडीकेटर्स में अगर हम बेयरिश के संकेत के बाद शार्ट करते हैं तो यह एक खोने वाला व्यापार होता है।

इसके पीछे मुख्य कारण यह है कि जिस समय कीमत कम हुई और एसएमए की प्रतिक्रिया हुई, कीमत पहले ही काफी गिर गई और रिवर्स हो गई थी।  

और पढ़ें – टेक्निकल इंडिकेटर जो बाजार में अस्थिरता(वोलैटिलिटी) को दर्शाते हैं

 तब हमें बुलिश क्रॉसओवर का संकेत मिलता है। लेकिन जब तक यह संकेत करता है, तब तक अपट्रेंड शुरू हो चुका होता है। इस संकेत ने हालांकि हमारे पक्ष में काम किया।

यदि किसी ट्रेडर ने तीसरे बेयरिश के संकेत का पालन किया था और शार्ट हुआ था  तो यह एक बार फिर नुकसान का कारण बनेगा।

उपरोक्त उदाहरण से पता चलता है कि लैगिंग के बावजूद, कोई इस इंडिकेटर द्वारा दिए गए संकेतों पर भरोसा नहीं कर सकता है।

Lagging और Leading Technical Indicator के बीच अंतर?

लैगिंग बनाम लीडिंग टेक्निकल इंडिकेटर - क्या आप अंतर जानते हैं? 2
  • सिग्नल उत्पन्न करना

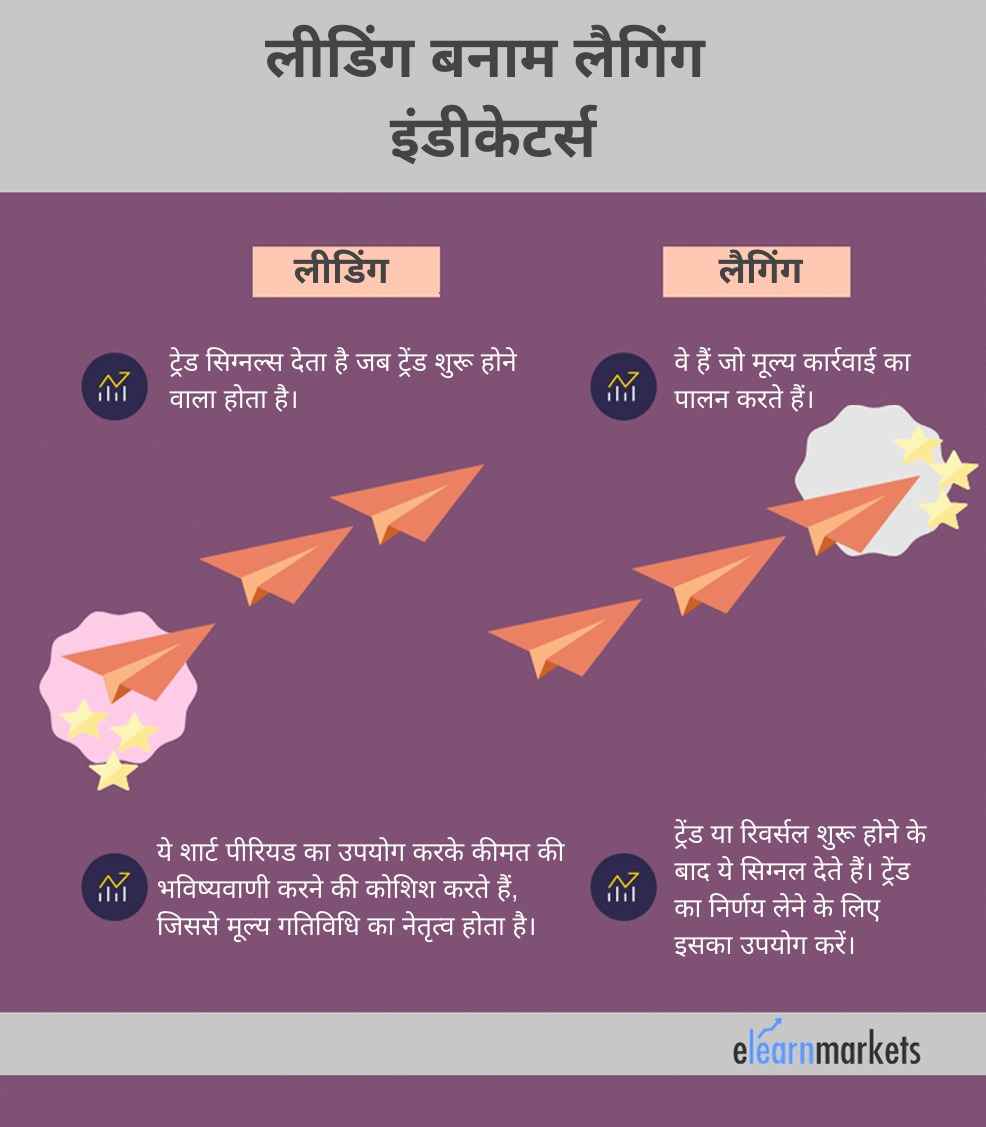
 Leading technical indicator ट्रेड सिग्नल देते हैं जब ट्रेड शुरू होने वाली होती है जबकि लैगिंग इंडिकेटर वे होते हैं जो मूल्य क्रियाओं का पालन करते हैं।

  • बेस्ट टाइम पीरियड्स

लीडिंग इंडिकेटर छोटी अवधि की समयावधि का उपयोग करके कीमत का अनुमान लगाने की कोशिश करते हैं और इसलिए मूल्य गतिविधि का नेतृत्व करते हैं।

लैगिंग इंडिकेटर ट्रेंड या रिवर्सल के बाद संकेत देते हैं। ट्रेंड का निर्धारण करने के लिए कोई भी उनका उपयोग कर सकता है।

Lagging & Leading Technical Indicators की कमियां

दोनों लीडिंग और लैगिंग इंडीकेटर्स की अपनी कमियां हैं।

लीडिंग इंडिकेटर कीमतों पर तुरंत प्रतिक्रिया करते हैं, जिसका अर्थ है कि वे गलत संकेतों से ग्रस्त हो सकते हैं।

लैगिंग इंडिकेटर प्रतिक्रिया के लिए धीमा हैं और वे भी गलत संकेत दे सकते हैं।

लीडिंग और लैगिंग टेक्निकल इंडीकेटर्स का संयोजन

आइए देखें कि एक ट्रेडर बाजार के बेहतर दृष्टिकोण को प्राप्त करने के लिए लीडिंग और लैगिंग दोनों इंडीकेटर्स का उपयोग कैसे कर सकता है।

निम्नलिखित चार्ट, रिलेटिव स्ट्रेंथ इंडेक्स (लीडिंग) और दो मूविंग एवरेज (लैगिंग) इंडीकेटर्स दिखाता है:

Leading technical indicator chart

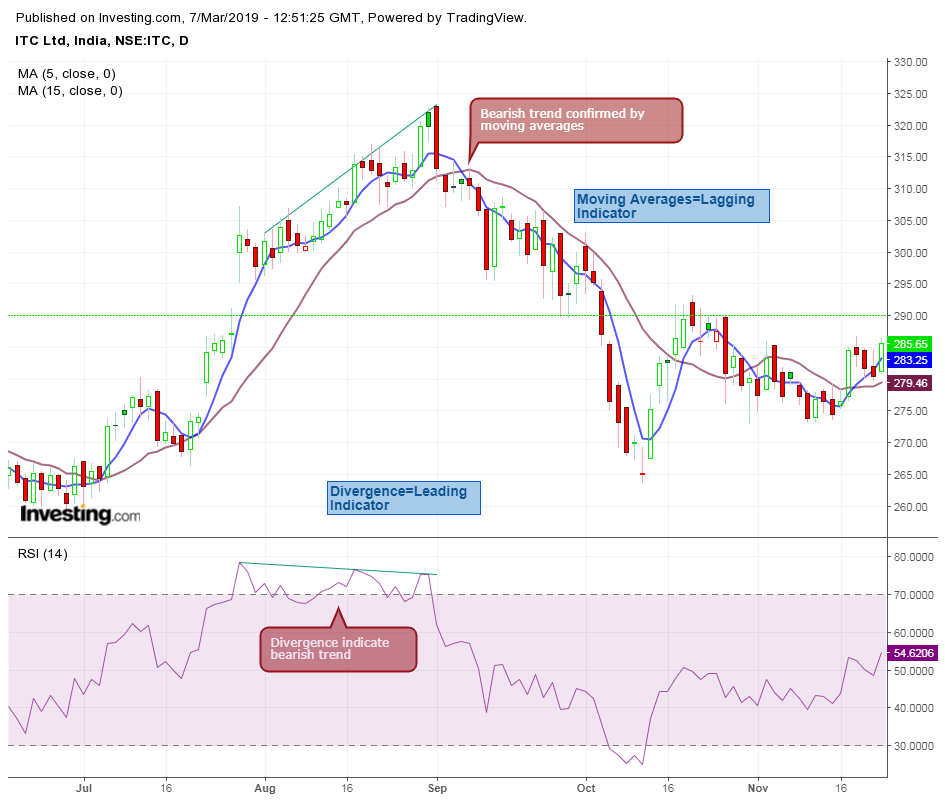
यहां चार्ट पर, हम पहले बेयरिश डाइवर्जन्स की पहचान करते हैं, जिसकी कीमत उच्चतर उच्च बनी हुई है, जबकि 14 पीरियड आरएसआई कमतर कम है। यह बेयरिश इंडिकेटर एक प्रमुख इंडिकेटर है जो एक संभावित बेयरिश ट्रेंड के बारे में व्यापारी को सूचित करता है। आप यह भी देख सकते हैं कि लीजिंग इंडिकेटर एक बेयरिश ट्रेंड का संकेत देने के बाद, इसकी पुष्टि मूविंग एवरेज बेयरिश क्रोसोवर्स द्वारा होती है।

आप देख सकते हैं कि लीडिंग और लैगिंग दोनों इंडीकेटर्स को संयोजित करना कितना सरल मगर शक्तिशाली है।

लीडिंग बनाम लैगिंग संकेतक – कौन सा बेहतर है?

ट्रेडर्स के लिए अक्सर लीडिंग और लैगिंग इंडीकेटर्स का उपयोग करने के बीच संतुलन बनाना मुश्किल होता है।

यदि आप केवल लीडिंग इंडीकेटर्स पर भरोसा करते हैं, तो संभावना बहुत सारे गलत संकेतों को देखने की है।

इसे भी पढ़ें: स्टॉक ट्रेडर्स के लिए टेक्निकल इंडीकेटर्स के लिए व्यापक गाइड

यदि आप पूरी तरह से लैगिंग संकेतकों पर भरोसा करते हैं, तो संभावना बहुत सारे गलत संकेतों को देखने की  है।

उपरोक्त कमियों के साथ, इन दोनों लीडिंग और लैगिंग इंडीकेटर्स का उपयोग करके एक ट्रेडिंग रणनीति विकसित करना सबसे अच्छा है।

अंत में यह ट्रेडर पर होता है कि वह कैसे ट्रेड करना चाहता है!

मूल बातें 

  • लीडिंग इंडिकेटर को डिज़ाइन किया जाता है ताकि ट्रेडर ट्रेड में बढ़त पाने के लिए आगे की कीमतों की गतिविधियों का अनुमान लगा सके। 
  • लैगिंग इंडिकेटर वो इंडिकेटर हैं जो एक ट्रेंड का पालन करते हैं न कि मूल्य रिवर्सल की भविष्यवाणी करते हैं। यह एक इवेंट को फॉलो करते है।
  • किसी को इन दोनों इंडीकेटर्स पर पूरी तरह से निर्भर नहीं होना चाहिए
  • किसी को इन दोनों इंडीकेटर्स का उपयोग करके एक ट्रेडिंग रणनीति स्थापित करनी चाहिए।
Tags: basichindilagging indicatorleading indicator
ShareTweetSend
Get Kotak Offer Get Kotak Offer Get Kotak Offer
Previous Post

Inventory Management – Example, Importance & Turnover Period

Next Post

मूविंग एवरेज इंडिकेटर – ट्रेडर्स के लिए एक टेक्निकल टूल

Elearnmarkets

Elearnmarkets

Elearnmarkets (ELM) is a complete financial market portal where the market experts have taken the onus to spread financial education. ELM constantly experiments with new education methodologies and technologies to make financial education effective, affordable and accessible to all. You can connect with us on Twitter @elearnmarkets.

Related Posts

Understand Slippage in Trading
Technical Analysis

What is Slippage in Trading? Meaning & Examples

March 28, 2025
297
Breakout trading strategies
Technical Analysis

Top 5 Breakout Trading Strategies

March 12, 2025
1.1k
5 stocks for today
Technical Analysis

5 Stocks to Buy Today That Could Beat the NIFTY in 2025!

May 5, 2025
398
Image describing What is marginal trading facility
Technical Analysis

 What is a Margin Trading Facility? Advantages & Risks

April 4, 2025
661

Leave a Reply Cancel reply

Your email address will not be published. Required fields are marked *

Disclaimer

Elearnmarkets (Kredent InfoEdge Pvt. Ltd.) is a SEBI-registered Research Analyst (RA) entity (SEBI Registration No.: INH300007493). The information provided in this article is for educational and informational purposes only and should not be considered as an offer to buy or sell any securities or investment products.

The stocks, securities, and investment instruments mentioned herein are not recommendations under SEBI (Research Analysts) Regulations, 2014. Readers are advised to conduct their own due diligence and seek independent financial advice before making any investment decisions.

Investments in securities markets are subject to market risks. Please read all related documents carefully before investing. Investing in Equity Shares,
Derivatives, Mutual Funds, or other instruments carry inherent risks, including potential loss of capital. Elearnmarkets (Kredent InfoEdge Pvt. Ltd.) does not provide any guarantee or assurance of returns on any investments. Past performance is not indicative of future performance.

Elearnmarkets Logo

Follow Us

Facebook-f X-twitter Instagram Linkedin-in Youtube Telegram

Register on Elearnmarkets

Continue your financial learning by creating your own account on Elearnmarkets.com

Register Free Account

Download App

Playstore logo
Download on app store

Categories

  • Basic Finance
  • Derivatives
  • Financial Planning
  • Fundamental Analysis
  • Technical Analysis
  • Mutual Funds
  • Miscellaneous

Popular On Elearnmarkets

  • Market Superheroes:
  • Vivek Bajaj
  • Chetan Panchamia
  • Ashish Kyal
  • Premal Parekh
  • Abhijit Paul
  • Jegan
  • Sivakumar Jayachadran
  • Jyoti Budhia
  • Vivek Gadodia
  • Vishal Mehta
  • Piyush Chaudhry
  • Santosh Pasi
  • Gomathi Shankar
  • Market Superheroes:
  • Vivek Bajaj
  • Chetan Panchamia
  • Ashish Kyal
  • Premal Parekh
  • Abhijit Paul
  • Jegan
  • Sivakumar Jayachadran
  • Jyoti Budhia
  • Vivek Gadodia
  • Vishal Mehta
  • Piyush Chaudhry
  • Santosh Pasi
  • Gomathi Shankar
  • Courses:​
  • Options Trading
  • Dow Theory
  • Momentum Trading
  • Stock Investing
  • Harmonic Chart Patterns
  • Algo Trading
  • Elliot Wave Theory
  • Advanced Excel
  • Cryptocurrency
  • NSE Certification Course
  • Courses:​
  • Options Trading
  • Dow Theory
  • Momentum Trading
  • Stock Investing
  • Harmonic Chart Patterns
  • Algo Trading
  • Elliot Wave Theory
  • Advanced Excel
  • Cryptocurrency
  • NSE Certification Course
  • Webinars:
  • Bank Nifty Scalping
  • Intraday Trading Strategies
  • Options Trading Strategies
  • Options selling
  • Price Action
  • Relative Strength
  • Tax Planning
  • Options Buying
  • Growth Stocks
  • Portfolio Management
  • Risk Management
  • Renko Charts
  • Crude Oil
  • Traders Psychology
  • Moving Average
  • Multibagger Stocks
  • Free Learning Modules:
  • Intraday Trading
  • Options Scalping
  • Swing Trading
  • Financial Modelling
  • RSI Indicator
  • Bollinger Bands
  • Pricing of Futures
  • Personal Finance
  • Initial Public Offerings (IPO)
  • Value Investing
  • Technical Indicators
  • Candlesticks
  • Chart Patterns
  • Option Greeks
  • ELSS Funds
  • Banking and Insurance
  • Real Estate
  • Gold
  • Book Summaries:
  • Rich Dad Poor Dad
  • Psychology of Money
  • The Intelligent Investor
  • The Richest Man in Babylon
  • Think and Trade Like a Champion
  • Value Investing and Behavioural Finance
  • Trading in the Zone
  • Learn to Earn
  • Book Summaries:
  • Rich Dad Poor Dad
  • Psychology of Money
  • The Intelligent Investor
  • The Richest Man in Babylon
  • Think and Trade Like a Champion
  • Value Investing and Behavioural Finance
  • Trading in the Zone
  • Learn to Earn
  • Tools:
  • CAGR Calculator
  • SIP Calculator
  • eLearnOptions
  • Future Value Calculator
  • Present Value Calculator
  • Atal Pension Yojana
  • Cost of Delay Calculator
  • Become a Crorepati
  • Tools:
  • CAGR Calculator
  • SIP Calculator
  • eLearnOptions
  • Future Value Calculator
  • Present Value Calculator
  • Atal Pension Yojana
  • Cost of Delay Calculator
  • Become a Crorepati

© 2025 Elearnmarkets. All Rights Reserved

  • Visit Elearnmarkets
  • Courses
  • Webinars
  • Financial Guides
  • Get Free Counselling
  • Visit Elearnmarkets
  • Courses
  • Webinars
  • Financial Guides
  • Get Free Counselling

Download Our App

No Result
View All Result
  • Article Categories
    • Basic Finance
    • Derivatives
    • Financial Planning
    • Fundamental Analysis
    • Technical Analysis
    • ETFs & Mutual Funds
    • Marketshala
    • Miscellaneous
  • Language
    • Hindi
    • Bengali
    • English
  • Courses
  • Webinars
  • Stories
Get Free Course

© 2024 Elearnmarkets All Rights Reserved

A Handbook of Technical Analysis
To start your trading journey as a seasoned technical analyst
Download Guide For FREE
Guidebook On Chart Patterns
Take Your Trading To The Next Level With Strategies Shared In This Ebook
Download Guide For FREE
Trading Mentorship Program