Key Takeaways:
- Bullish engulfing forms when a green candle completely covers a red one after a downtrend
- Bearish engulfing forms when a red candle fully engulfs a green one after an uptrend
- Pattern forms when the second candle fully covers the previous opposite candle
- Signals possible trend reversal with bullish suggesting buying and bearish suggesting selling
- In trading, bullish near support may indicate entry while bearish near resistance may indicate exit
- Bullish has green after red and bearish has red after green
The Bullish and Bearish Engulfing Patterns are multiple candlestick patterns that tend to signal a reversal of the ongoing trend in the market. This candlestick pattern involves two candles, with the latter candle ‘engulfing’ the entire body of the prior candle.
The engulfing candlestick can be bullish or bearish based on where it forms in relation to the ongoing trend.
- What is Bullish Engulfing Pattern?
- What is Bearish Engulfing Pattern?
- Formation of Bullish and Bearish Engulfing Patterns:
- What does Bullish and Bearish Engulfing Patterns tell you?
- Trading Example:
- Difference between Bullish and Bearish Engulfing Patterns:
- How to use Bullish and Bearish Engulfing Candlestick Scans in StockEdge:
- Frequently Asked Questions
What is Bullish Engulfing Pattern?
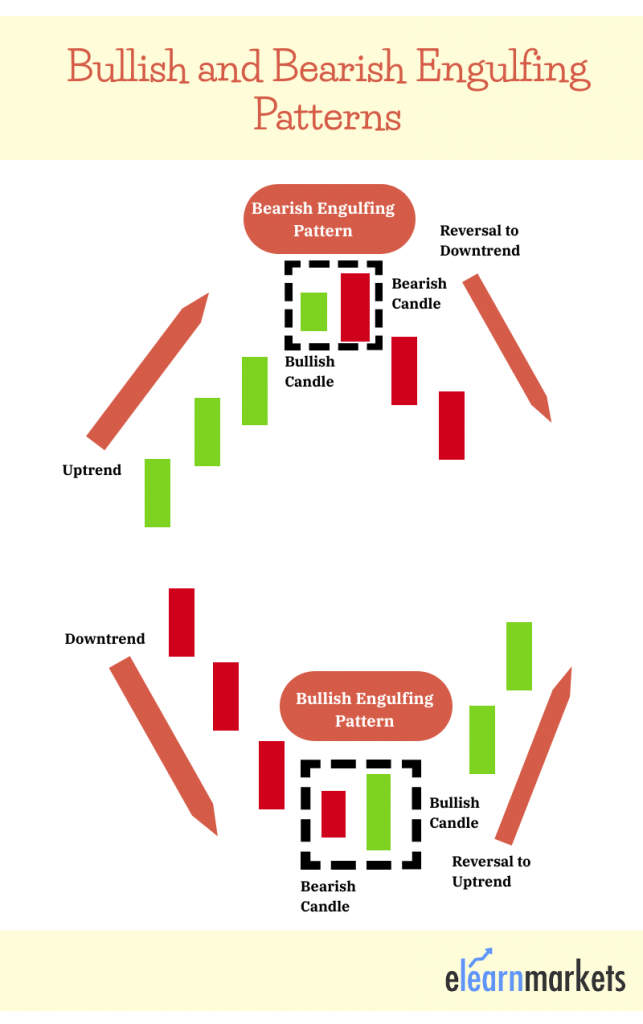
The bullish engulfing candle signals a reversal of a downtrend and indicates a rise in buying pressure when it appears at the bottom of a downtrend.
This pattern reverses the ongoing trend as more buyers enter the market and move the prices up further.
The pattern involves two candles, with the second green candle that is completely engulfing the body of the previous red candle.
What is Bearish Engulfing Pattern?
The bearish engulfing pattern is the opposite of the bullish pattern.
It signals a reversal of the uptrend and indicates a fall in prices by the sellers who exert the selling pressure when it appears at the top of an uptrend
This pattern triggers a reversal of the ongoing trend as more sellers enter the market and they make the prices fall.The pattern involves two candles with the second bearish candle completely engulfing the ‘body’ of the previous green candle.
Now let us discuss the formation of Bullish and Bearish Engulfing patterns:
Formation of Bullish and Bearish Engulfing Patterns:
Below is the formation of a Bullish and Bearish Engulfing pattern:
What does Bullish and Bearish Engulfing Patterns tell you?
Engulfing candles helps the traders spot the trend reversals that indicate trend continuation and also assists traders with an exit signal:
1. Trend continuation
Engulfing patterns support the continuation of the ongoing trend, for example, when spotting a bullish engulfing pattern in an uptrend, it indicates that the ongoing trend will continue.
2. Reversals
Bullish and Bearish Engulfing patterns signal a reversal in the trend. When a bullish engulfing pattern is found at the bottom of the downtrend, it signals an uptrend reversal
Similarly, when a bearish engulfing pattern is found at the top of an uptrend, it signals a downtrend reversal
3. Exit strategy
This pattern can also be used as a signal to exit if the trader holds a buying or selling position in the ongoing trend that is coming to an end.
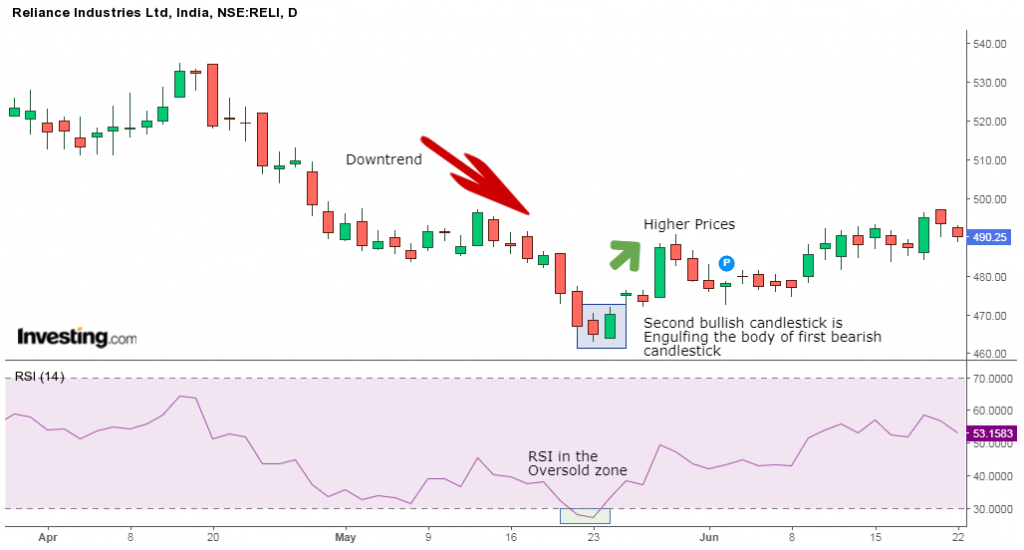
Trading Example:
Below is an example of go to trade Bullish Engulfing pattern as shown in the daily chart of Reliance Industries:


One should remember the below points when trading with the Bullish Engulfing pattern:
- Prior trend: One should note that the prior trend is the downtrend
- Pattern: The second candlestick should be bullish and engulfing the body of the first candlestick.
- Stop loss: Stop loss can be placed below the low where the bullish engulfing pattern occurs.
- Confirmation of the pattern: Also, don’t forget to confirm the signals given by this pattern with other technical indicators as we have to use the Relative Strength Index in our example.
Similarly when trading with the Bearish Engulfing pattern, one should remember the below points:
- Prior trend: One should note that the prior trend uptrend
- Pattern: The second candlestick should be bearish and engulfing the body of the first candlestick.
- Stop loss: Stop loss can be placed below at the high where the bearish engulfing pattern occurs.
- Confirmation of the pattern: Also, don’t forget to confirm the signals given by this pattern with other technical
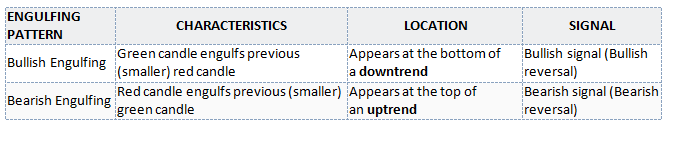
Difference between Bullish and Bearish Engulfing Patterns:
Below is a summary of the main differences between the bullish and bearish engulfing patterns.
How to use Bullish and Bearish Engulfing Candlestick Scans in StockEdge:
You can also use the Bullish and Bearish Engulfing Candlestick scans in the StockEdge web version:
Steps to use Bullish and Bearish Engulfing Candlestick in StockEdge:
- Under the “Candlestick Scans” we can see Bullish and Bearish Reversal Scans as shown below:
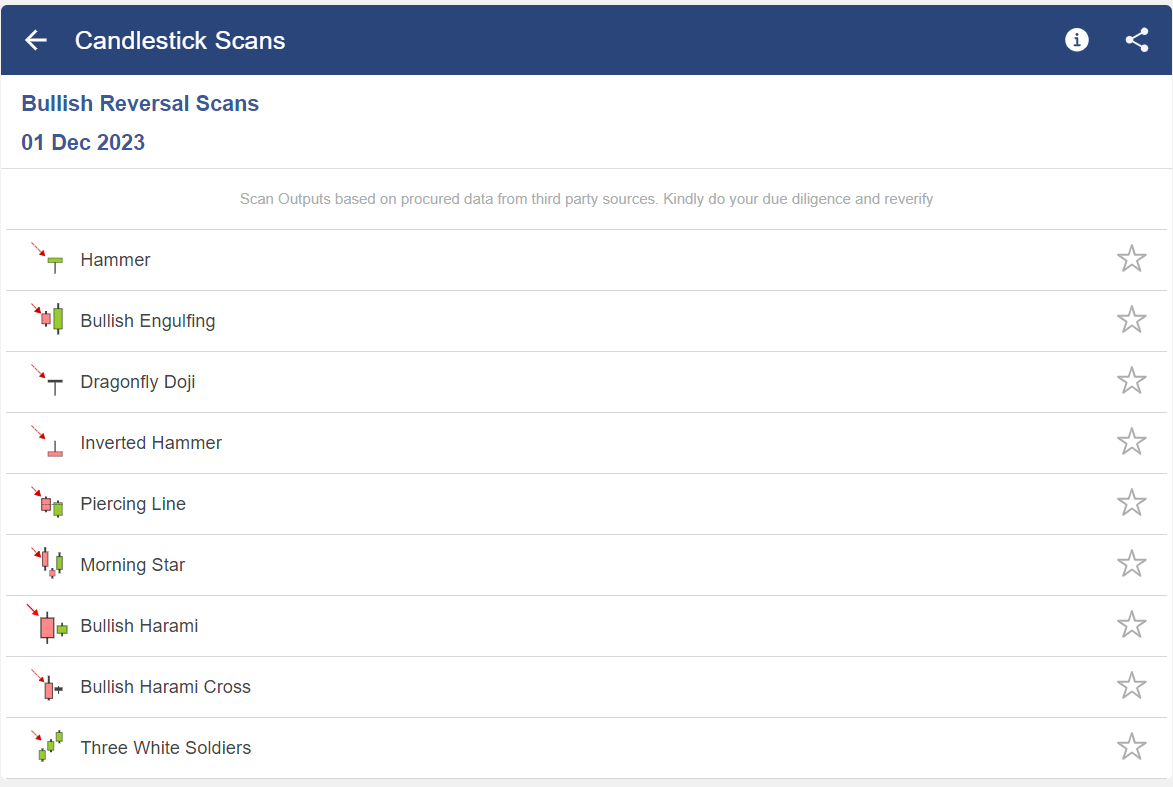
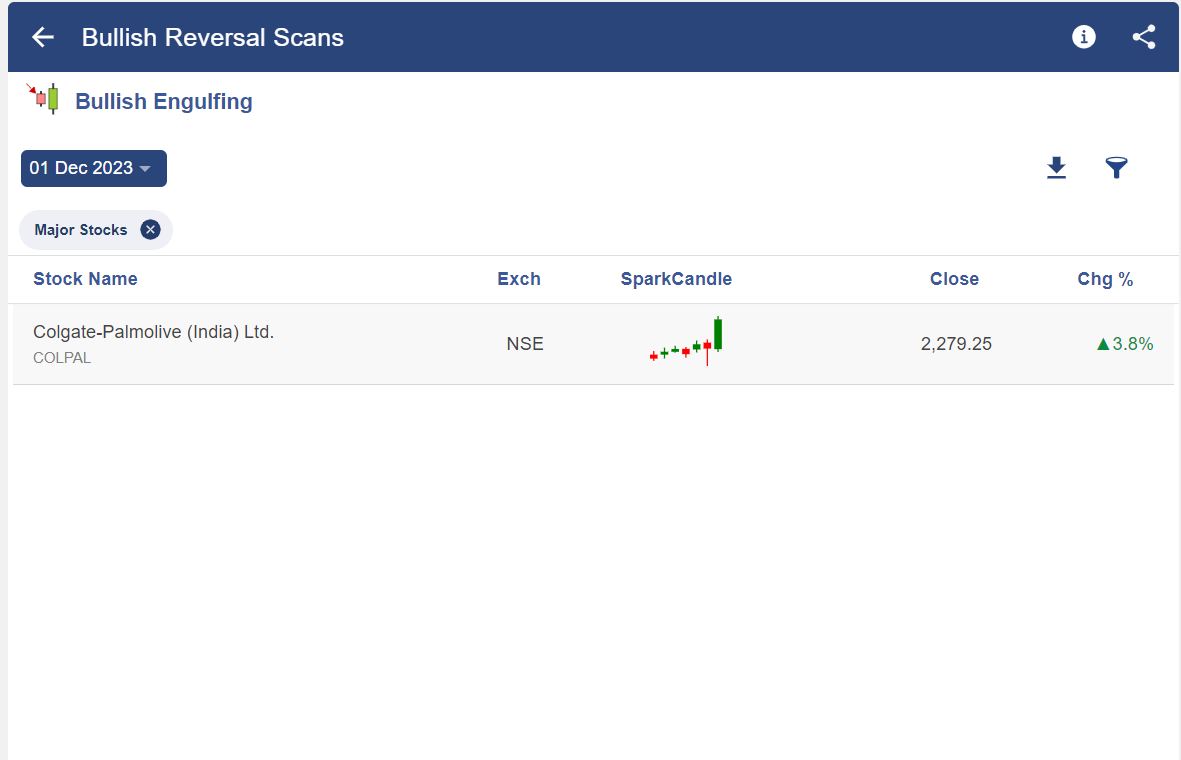
- When we click on the “Bullish Reversal Scans” we can see “Bullish Engulfing” scan, click on that:
Bottomline
The Bullish and Bearish Engulfing Patterns candlestick involves two candles, with the latter candle ‘engulfing’ the entire body of the prior candle. The engulfing candlestick can be bullish or bearish based on where it forms with the ongoing trend.
The bullish engulfing candle signals a reversal of a downtrend and indicates a rise in buying pressure when it appears at the bottom of a downtrend. The bearish engulfing signals a reversal of the uptrend and indicates a fall in prices by the sellers who exert selling pressure when it appears at the top of an uptrend. Engulfing candles helps the traders spot the trend reversals that indicate trend continuation and also assists traders with an exit signal.
Read More- All 35 Candlestick Chart Patterns in the Stock Market
Frequently Asked Questions
How Accurate is Bullish Engulfing?
The psychological basis for this pattern’s development is the purchasers’ entry at critical junctures. As a result, the volume of their trades raises the buying pressure, which results in the bullish candle engulfing the prior candle, indicating strength or substantial purchasing pressure.
What does a Bullish Candle Mean?
A bullish candlestick pattern indicates that an asset’s price is about to enter an uptrend or is already in the process of continuing uptrend. Every candlestick graphically depicts the open, close, low, and high price for a given period of time.


Bullish & bearish engulfing charts are the same. needs correction I guess. Thanks.
Hi,
Thank you for your feedback, we have corrected it.
Keep Reading!