Hindi: आप इस लेख को हिंदी में भी पढ़ सकते है|
Dark Cloud Cover is a bearish reversal candlestick pattern that is formed at the end of an uptrend. It signals potential weakness in the uptrend.
It is made of two candlesticks. The first candlestick is a bullish candlestick and the second one is a bearish candlestick. The second candlestick is a bearish candlestick that signals reversal and the uptrend’s end.
This candlestick pattern is similar to the piercing pattern. The only difference is that a piercing pattern occurs at the end of the downtrend, whereas dark cloud cover occurs at the end of an uptrend.
Let us discuss how to trade with dark cloud cover in detail:
What is a Dark Cloud Cover?
The Dark Cloud Cover pattern includes a large black candle forming a “dark cloud” over the previous day’s candle.
The buyers push the price higher at the open, but then the sellers take over later in the session and push the prices down. This shift from buying to selling signals that a price reversal to the downside could be forthcoming.
Most traders consider the Dark Cloud Cover pattern useful only when it occurs at the end of an uptrend As the prices rise, the pattern becomes more important for the reversal to the downside.
If the price action is choppy, then the pattern is less significant as the price remains choppy after this pattern.
Formation of Dark Cloud Cover
The dark cloud cover pattern involves a large bearish candle after a bullish trend. This large bearish candle forms a dark cloud over the previous day’s candle.
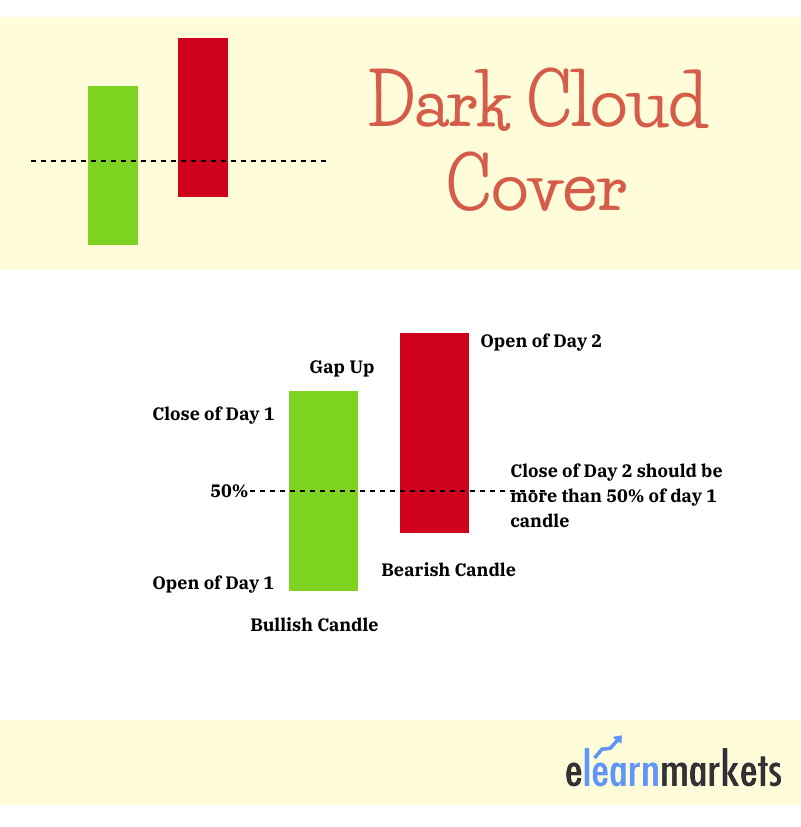
We can see how this pattern is formed from the image below:

It starts with a bullish candle in an uptrend, followed by a gap up the next day.
The candlestick of the next day turns to be a bearish candle. The close of this bearish candle is below the midpoint of the previous day candle.
The bullish and bearish candlesticks in this candlestick pattern have large real bodies with very short or no shadows.
The formation of this pattern is confirmed by the form of a bearish candle at the end of this pattern.
Investors must look at a few characteristics when they trade with the dark cloud cover pattern:
- Firstly, the trend should be an uptrend, as the dark cloud cover pattern is a bearish reversal pattern.
- Secondly, the length of the candlestick plays an important role in determining the force with which the reversal will take place.
- The gap up between the bullish and bearish candlesticks indicates how powerful the trend reversal will be.
- Fourthly, the bearish candlestick should close more than the midpoint of the previous bullish candlestick.
- Lastly, the bullish, as well as the bearish candlestick, should have larger bodies.
- Firstly, the trend should be an uptrend, as the dark cloud cover pattern is a bearish reversal pattern.
- Secondly, the length of the candlestick plays an important role in determining the force with which the reversal will take place.
- Fourthly, the bearish candlestick should close more than the midpoint of the previous bullish candlestick.
- Lastly, the bullish, as well as the bearish candlestick, should have larger bodies.
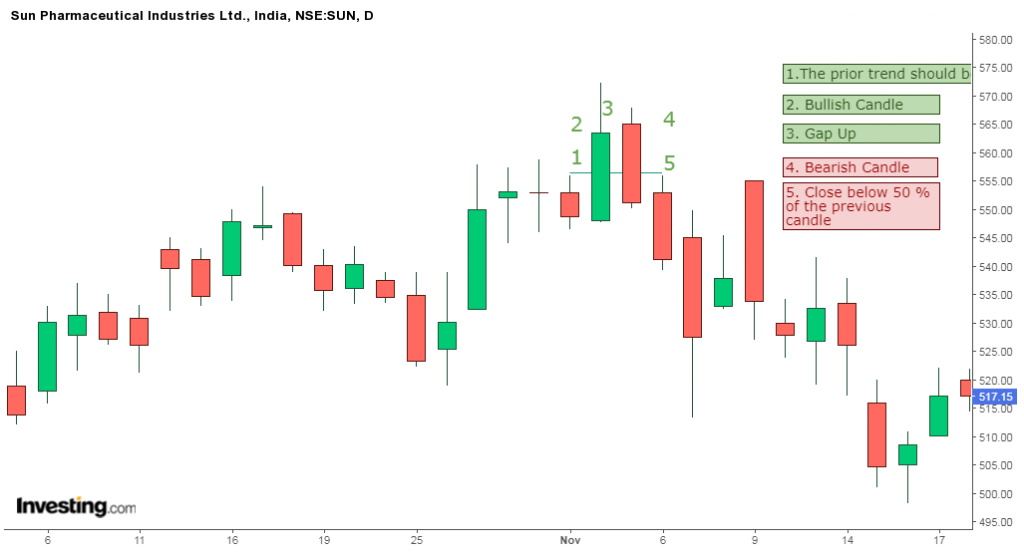
Below is an example of the piercing pattern in the daily chart of Sun Pharmaceutical Industries Ltd.

Importance of Dark Cloud Cover in Trading
The traders find this pattern important as it signals the reversal of the uptrend into a downtrend.
One should look at the daily charts for this pattern as this pattern is less significant in the lesser time-frame charts.
Another reason why traders like to trade with this pattern is that this pattern occurs near the resistance level.
Also if the volume is high during the formation of this candle, there are more chances of the reversal to take place.
Also, don’t forget to confirm the signals given by this pattern with other technical indicators.
You can also use technical scans to filter out stocks for trading the next day by using StockEdge App, now also available in the web version.
Bottomline
Dark Cloud Cover is a bearish reversal candlestick pattern that is formed at the end of an uptrend. It is made of two candlesticks. The first candlestick is a bullish candlestick and the second one is a bearish candlestick. The traders find this pattern important as it signals the reversal of uptrend into a downtrend. If the volume is high during the formation of this candle, there are more chances of the reversal to take place. Also, don’t forget to confirm the signals given by this pattern with other technical indicators.
Read More- All 35 Candlestick Chart Patterns in the Stock Market
Frequently Asked Questions (FAQs)
How do I Identify a Dark Cloud Cover Candlestick Pattern?
One can identify a dark cloud cover candlestick pattern when a large black candle forms a “dark cloud” over the previous day’s candle.
Is Dark Cloud Cover a Bearish Candlestick?
Dark Cloud Cover is a bearish reversal candlestick pattern that is formed at the end of an uptrend. It signals potential weakness in the uptrend.
How to Trade Using Dark Cloud Cover Pattern?
Investors must look at a few characteristics when they trade with the dark cloud cover pattern:
1. Firstly, the trend should be an uptrend, as the dark cloud cover pattern is a bearish reversal pattern.
2. Secondly, the length of the candlestick plays an important role in determining the force with which the reversal will take place.
3. The gap up between the bullish and bearish candlesticks indicates how powerful the trend reversal will be.
4. Fourthly, the bearish candlestick should close more than the midpoint of the previous bullish candlestick.
5. Lastly, the bullish, as well as the bearish candlestick, should have larger bodies.


Nicely explained
Hi,
Thank you for reading our blog!
Keep Reading!
great its helpful
Hi,
Thank you for reading our blog!
Keep Reading!
lucid and clear explanation. short and clear
Hi,
We are glad that you liked our post, you can read more blogs on Technical Analysis from here.
Thank you for Reading!
This is extremely helpful. Thank you so much!
Hi,
We really appreciated that you liked our blog!
Thank you for Reading!
Keep Reading!