Key Takeaways
- Volume: It is the quantity of shares traded. High volume indicates good participation of traders.
- Volume Delivery = Total Volume – Intraday Volume
- Volume Traded Vs Volume Delivery: Volume traded are total shares traded while volume delivery are shares transferred between Demat accounts.
For being a technical analyst, it’s important to understand volume traded along with volume delivery to derive the demand and supply.
Both price and volume are used as inputs for studying the price movements of the stocks.
Meanwhile, the stock exchange also provides additional information about volume known as ‘delivery volume’.
This can help traders to predict near-term market direction.
Therefore, let us understand volume traded and volume delivery and also differentiate between these two widely used tools in the stock market:
Table of Contents
What is Volume?
The quantity of shares traded in a particular trading session is known as the volume in the stock market. The trading session can be categorized into various time frames (e.g., 5 Minutes, 1 Hour, daily, weekly, and monthly).
Volume cannot be termed as buying volume or selling volume.
For a trade to take place there should be one buyer and one seller.
The high volume indicates good participation of the traders during that period and price range.
Traded volume is the number of shares traded daily during a particular share’s trading hours.
One should remember that when counting traded volume, each buys or sells transaction is only counted once. If A sells 500 shares and B buys 500 shares. Then the traded volume is 500 shares and not 1000 shares.
What is Volume Delivery?
It is not necessarily that every trade settles. Some trades are of intraday in nature, in which the trade positions are closed within the day.
Delivery volume can be derived by deducting the intraday volume from the total volume.
When the number of shares taken for delivery means that more shares are being accumulated. This shows that investors are becoming more interested in this stock because of its prospects.
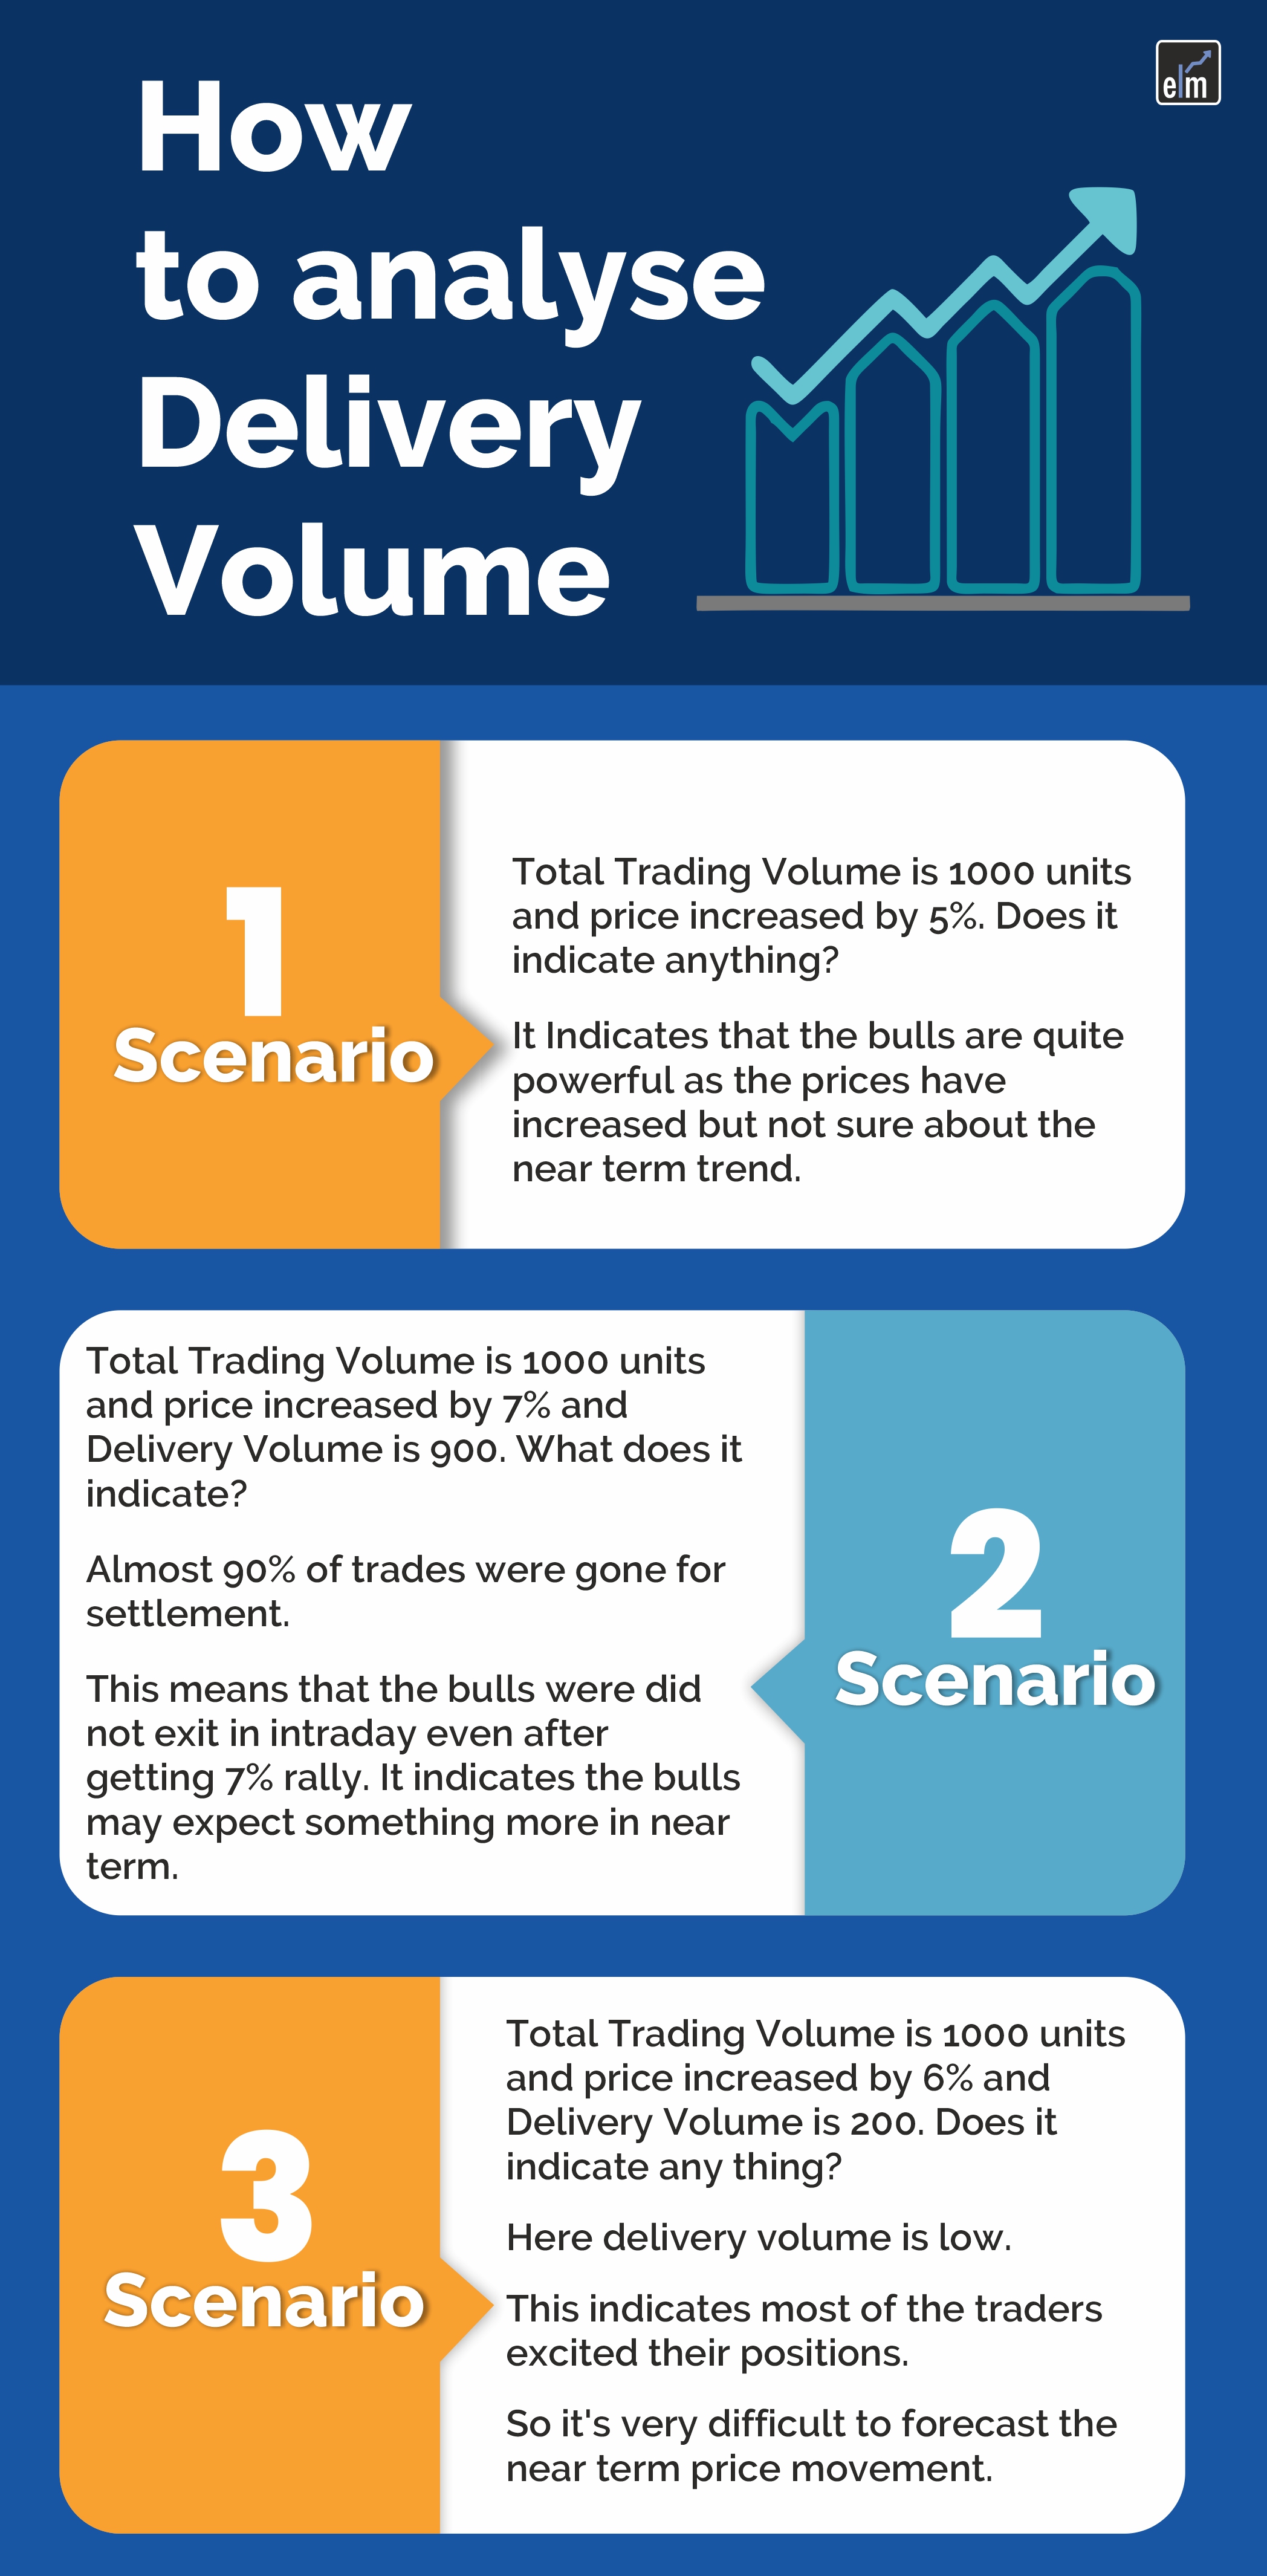
How we can use delivery volume?
It is quite possible to predict the trend by analyzing delivery volume, especially during breakouts. We need high delivery volume to determine whether the trend is strong or not.
Let us discuss various scenarios to understand how we can analyze delivery volume:
Difference Between Volume Traded and Volume Delivery
The main difference between traded volume and delivery volume is that traded volume is the total number of shares traded in a day and delivery volume is the shares that get transfers from one Demat account to the other and are not squared off within a day.
Let us understand this with the examples below:
Example 1
When in the same example you have three players A, B, C
Transaction 1: A buys 100 shares, B sells 100 shares
Volume = 100
Transaction 2 = A sells 70 shares, C buys 70 shares
Volume = 70
Total day transaction = 100 + 70 = 170
A buys 30 shares in delivery (100-70)B sells 100 shares in delivery and C buys 70 shares in delivery
So A and C buys 100 (30+70) in delivery, B sells 100 shares in delivery
Hence the total traded quantity is 170 and the total delivery is 100
Example 2
My example took two players,
Transaction 1: A buys 100 shares, B sells 100 shares
Volume = 100
Transaction 2: A sells 70 shares, B buys 70
Volume = 70
So it is 100-70 = 30 and Total traded volume in day 100+70 = 170
Example 3
When in the above example you have three players A, B, C and transactions are a little varied
Transaction 1: A buys 100 shares, B sells 100 shares
Volume = 100
Transaction 2 = A sells 70 shares, C buys 70 shares
Volume = 70
Transaction 3: C sells 50 shares to B
Volume= 50
Total day transaction = 100 + 70 + 50= 220
A buys 30 shares in delivery (100-70)
B sells 50 (100-50) shares in delivery and C buys 20 (70-50) shares in delivery
So A and C buys 50 (30+20) in delivery, and B sells 50 shares in delivery
Hence, the total traded quantity is 220, and the total delivery is 50.
Bottom Line
Traded volume is the number of shares traded daily during a particular share’s trading hours. A high volume indicates good trading participation during that period and price range. Delivery volume can be derived by deducting the intraday volume with total volume. The main difference between traded volume and delivery volume is that traded volume is the total number of shares traded in a day and delivery volume is the intraday volume minus the total volume.

Frequently Asked Questions (FAQs)
1. Why is trading value important?
Trading value is significant because it influences price movements and investment decisions by reflecting investor interest in a given asset or security, market activity, and liquidity.
2. Is higher trading volume better?
Increased liquidity and active market involvement are typically correlated with higher trade volume, and these factors may indicate increased efficiency and interest. Overly high volume, meanwhile, could also be a symptom of manipulation or volatility.
3. How to see traded volume in Nifty 50?
To see traded volume in Nifty 50, check financial websites or trading platforms that provide real-time market data. Look for the volume column specifically for Nifty 50 stocks.
4. What is the difference between traded volume and traded value?
Traded value is the total monetary value of those shares or units traded at market prices, whereas traded volume is the total number of shares or units moved.
5. What does a high delivery volume mean?
Significant movement of actual shares from sellers to buyers is indicated by a large delivery volume, which suggests active investor engagement and may have an impact on the mood and direction of the market price.
In order to get the latest information about Financial Markets visit https://stockedge.com/


Can I simply say what a relief to discover someone who really understands what they are discussing on the net.
You definitely realize how to bring an issue to light and make it important.
More and more people must check this out and understand
this side of the story. It’s surprising you aren’t more popular because you surely have the
gift.
Attractive component of content. I simply stumbled upon your site and in accession capital to say that I acquire
in fact loved account your weblog posts. Any way I’ll be subscribing on your feeds and even I fulfillment you access persistently rapidly.
Its great as your other content : D, thanks for putting up. “Too much sensibility creates unhappiness too much insensibility leads to crime.” by Charles Maurice de Talleyrand.
Wow! Thank you! I always needed to write on my blog something like that. Can I take a fragment of your post to my site?