Elearnmarkets - Financial Market Learning
  • Courses
  • Webinars
  • Stories
  • Language
    • English
    • Hindi
    • Bengali
No Result
View All Result
Get Free Course
  • Basic Finance
  • Derivatives
    • Futures
    • Options
  • Financial Planning
  • Fundamental Analysis
  • Technical Analysis
  • Mutual Funds
  • Marketshala
  • Miscellaneous
Elearnmarkets - Learn Stock Market, trading, investing for Free
  • Courses
  • Webinars
  • Stories
  • Language
    • English
    • Hindi
    • Bengali
No Result
View All Result
Get Free Course
Elearnmarkets - Learn Stock Market, trading, investing for Free
No Result
View All Result
Home Technical Analysis
7 Bar Patterns Traders should know 1

7 Bar Patterns Traders should know

Elearnmarkets by Elearnmarkets
July 7, 2023
in Technical Analysis, Charts, Patterns & Indicators
Reading Time: 7 mins read
0
13k
VIEWS
Share on FacebookShare on XShare on WhatsApp

Bar Patterns are short-term patterns that are useful for timing our trades and finding logical stop-loss points.

The bar patterns are similar to the candlesticks patterns and every price action trader should know the same.

One should note that the bar patterns play an important role when they appear at a strong uptrend or downtrend i.e. near the end of the trend.

Like candlestick patterns, bar patterns are also short-term patterns and they can indicate a reversal of the prices of the stock to another direction.

Bar patterns can be used in any timeframe, say 5 minutes, 15 minutes, hourly, daily, weekly, monthly and so on.

The larger the timeframe the greater is the importance of bar patterns in terms of the magnitude of the upcoming move.

Table Of Contents
  1. Below are the 7 Bar Patterns that every price trader should know:
    • 1. One Bar Reversal:
    • 2. Two-Bar Reversal:
    • 3. Horn Pattern:
    • 4. Inside Bar Pattern:
    • 5. Outside Bar Pattern:
    • 6. Narrow Range 7:
    • 7. Three Bar Reversal:
  2. Bottomline:

Below are the 7 Bar Patterns that every price trader should know:

1. One Bar Reversal:

One Bar Reversal also known as the reversal bar, climax, top or bottom reversal bar or key reversal bar.

A bullish key reversal bar occurs when the price opens below the low of the previous bar and closes above its high. Whereas, a bearish key reversal bar is formed when the price opens above the high of the previous bar and closes below its low.

Key reversal bars usually open with a price gap. As we rarely find gaps within intraday time frames, key reversal bars are mainly formed in the daily and above time frames.

Bearish One Bar Reversal Pattern:

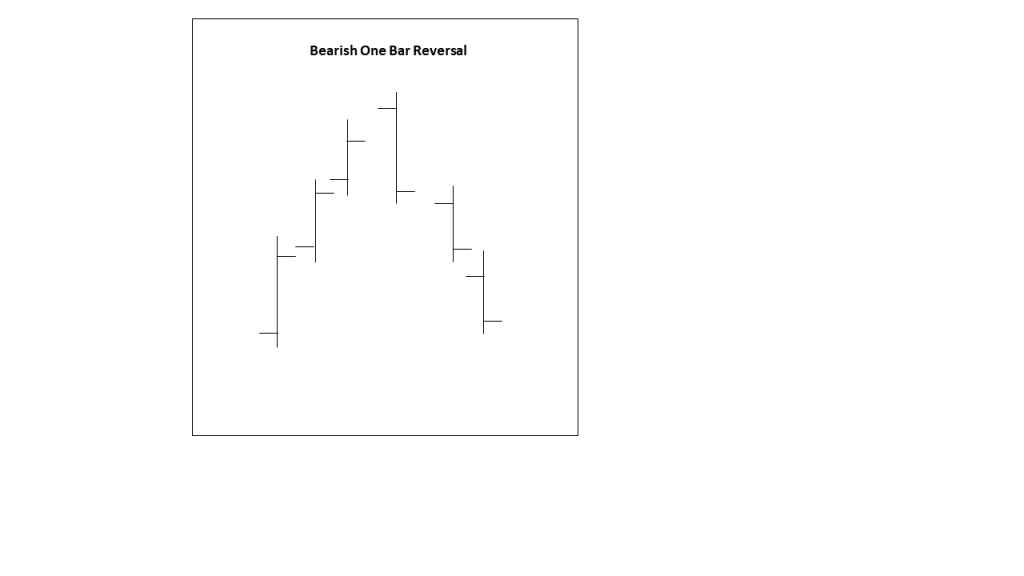
It is sometimes preceded by a gap or an opening gap and the length of the bar is not as intensive as a spike.

This pattern occurs in reverse at the bottom. After the bar formation, a series of higher highs or lower lows occur which proves that the reversal to either direction has taken place.

2. Two-Bar Reversal:

The two-bar reversal is also known as the Pipe formation which occurs at the end of the trend either upward or downward trend.

Bearish Two-Bar Reversal pattern

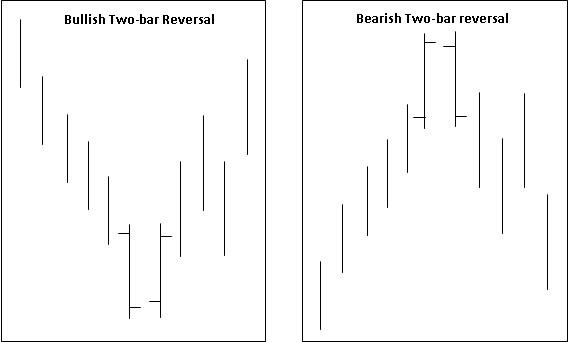
In the bottom bar pattern, the first bar usually closes in the lower half of the bar indicating a bearish bar and the second bar closes near its high indicating a bullish bar.

In the top bar pattern, the first bar usually closes near its high indicating a bullish bar and the second bar closes near its low indicating a bearish bar.

Usually, high volume can be seen in both the bars although it is preferably higher in the left bar than the right bar. The second bar should be slightly longer than the first bar.
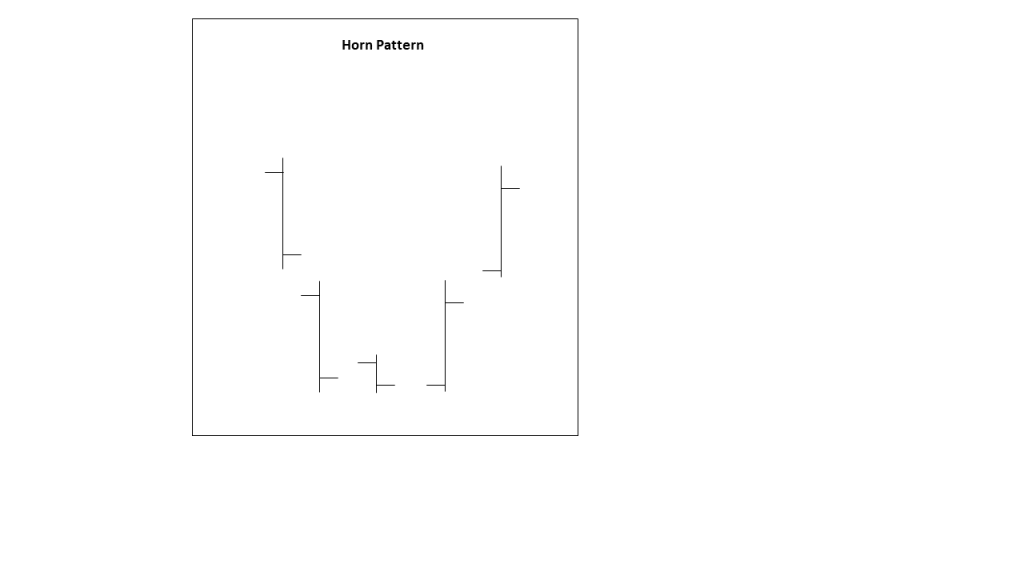
3. Horn Pattern:

This pattern is almost similar to the pipe pattern except that a smaller bar separates the two lengthy bars.

The two long bars act as the horns. This formation is more reliable with weekly bars and has the same characteristics as the pipe.

Horn Pattern

4. Inside Bar Pattern:

An Inside Bar is a bar with a range that is smaller than the previous bar range which is similar to the Harami candlestick pattern.

This pattern is more reliable when it is formed at the end of the uptrend or downtrend rather than in the congestion area.

Usually, the first bar has more volume than the second bar, although the volume increases as the subsequent bars are formed when the short-term reversal takes place.

Bullish and Bearish Inside Bar Pattern

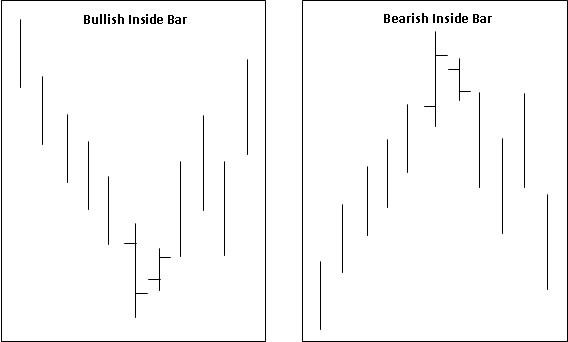
A Bullish Inside Bar takes place after a decline, the first bar is a tall bar and the closing price is below the opening price and the second bar is within the range of the first bar having a closing price more than the opening price.

Similarly, a Bearish Inside Bar takes place after an uptrend, the first bar is a tall bar having a closing price more than the opening price and the second bar is within the range of the first bar having a closing price less than the opening price.

5. Outside Bar Pattern:

The Outside Bar is a bar with a range that is larger than the previous bar range which is similar to the Engulfing candlestick pattern.

This bar pattern is more reliable when it is formed at the end of the uptrend or downtrend rather than in the congestion area.

Usually, the first bar has more volume than the second bar, although the volume increases as the subsequent bars are formed when the short term reversal takes place.

 Bullish and Bearish Outside Bar Patterns

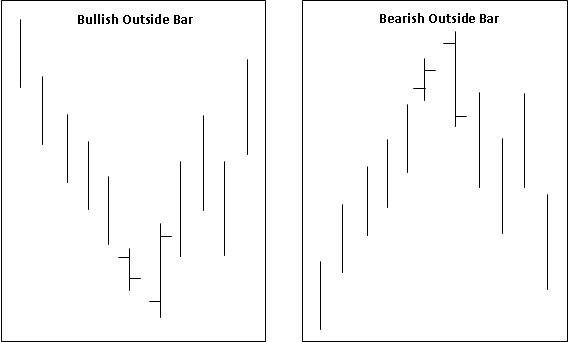
A Bullish Outside Bar takes place after a decline, the first bar is a small bar and the closing price is below the opening price and the second bar a tall bar that has a closing price more than the opening price.

Similarly, a Bearish Inside Bar takes place after an uptrend, the first bar is a small bar having a closing price more than the opening price and the second bar is a tall bar having a closing price less than the opening price.

6. Narrow Range 7:

This bar pattern requires seven bars before its formation and the last bar has the smallest bar range within the sequence.

This pattern indicates decreasing volatility as like the inside bar. As the lower volatility comes within the context of seven bars, instead of a single pattern, the NR7 pattern is a stronger sign of decreasing volatility.

Narrow Range 7

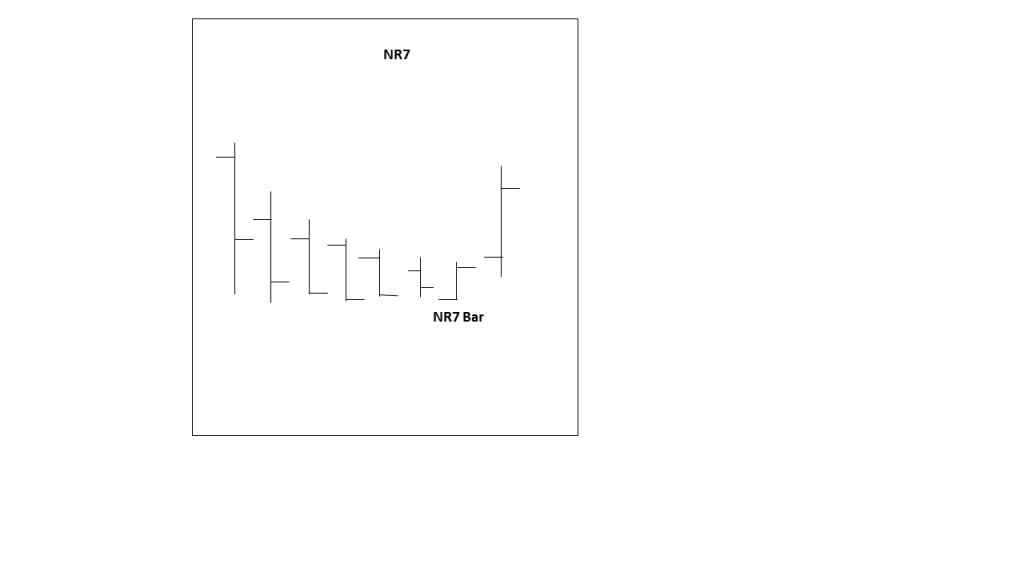
However, while the inside bar shows no strength in either direction, the NR7 pattern may drift upwards or downwards which represents a price thrust with decreasing volatility.

As the market alternates between range contraction and range expansion, the NR7 gives the traders a warning for explosive moves.

7. Three Bar Reversal:

A three-bar reversal pattern shows a trend reversal.

The three-bar reversal bar when compared to the other reversal pattern is the most conservative one as it extends over three bars and the third bar confirms that the market has changed its direction.

One should buy above the last bar of the bullish pattern and sell below the last bar of the bearish pattern

Bottomline:

One should note that the indications given by these bar patterns should be confirmed with other technical indicators like Moving Averages, Relative Strength Index etc.

The common strategies for trading with these bar patterns should include volume analysis as volume precedes price and gives confirmation of the signals generated by these bar patterns.

Start volume analysis for free in StockEdge app.

Happy Investing!

Tags: Bar chartbar patternsbasictechnical basics
ShareTweetSend
Get Kotak Offer Get Kotak Offer Get Kotak Offer
Previous Post

Fundamental Analysis 101- From Beginner to Pro

Next Post

Master Stock Technical Analysis for Beginners

Elearnmarkets

Elearnmarkets

Elearnmarkets (ELM) is a complete financial market portal where the market experts have taken the onus to spread financial education. ELM constantly experiments with new education methodologies and technologies to make financial education effective, affordable and accessible to all. You can connect with us on Twitter @elearnmarkets.

Related Posts

Understand Slippage in Trading
Technical Analysis

What is Slippage in Trading? Meaning & Examples

March 28, 2025
313
Breakout trading strategies
Technical Analysis

Top 5 Breakout Trading Strategies

March 12, 2025
1.1k
5 stocks for today
Technical Analysis

5 Stocks to Buy Today That Could Beat the NIFTY in 2025!

May 5, 2025
407
Image describing What is marginal trading facility
Technical Analysis

 What is a Margin Trading Facility? Advantages & Risks

April 4, 2025
674

Leave a Reply Cancel reply

Your email address will not be published. Required fields are marked *

Disclaimer

Elearnmarkets (Kredent InfoEdge Pvt. Ltd.) is a SEBI-registered Research Analyst (RA) entity (SEBI Registration No.: INH300007493). The information provided in this article is for educational and informational purposes only and should not be considered as an offer to buy or sell any securities or investment products.

The stocks, securities, and investment instruments mentioned herein are not recommendations under SEBI (Research Analysts) Regulations, 2014. Readers are advised to conduct their own due diligence and seek independent financial advice before making any investment decisions.

Investments in securities markets are subject to market risks. Please read all related documents carefully before investing. Investing in Equity Shares,
Derivatives, Mutual Funds, or other instruments carry inherent risks, including potential loss of capital. Elearnmarkets (Kredent InfoEdge Pvt. Ltd.) does not provide any guarantee or assurance of returns on any investments. Past performance is not indicative of future performance.

Elearnmarkets Logo

Follow Us

Facebook-f X-twitter Instagram Linkedin-in Youtube Telegram

Register on Elearnmarkets

Continue your financial learning by creating your own account on Elearnmarkets.com

Register Free Account

Download App

Playstore logo
Download on app store

Categories

  • Basic Finance
  • Derivatives
  • Financial Planning
  • Fundamental Analysis
  • Technical Analysis
  • Mutual Funds
  • Miscellaneous

Popular On Elearnmarkets

  • Market Superheroes:
  • Vivek Bajaj
  • Chetan Panchamia
  • Ashish Kyal
  • Premal Parekh
  • Abhijit Paul
  • Jegan
  • Sivakumar Jayachadran
  • Jyoti Budhia
  • Vivek Gadodia
  • Vishal Mehta
  • Piyush Chaudhry
  • Santosh Pasi
  • Gomathi Shankar
  • Market Superheroes:
  • Vivek Bajaj
  • Chetan Panchamia
  • Ashish Kyal
  • Premal Parekh
  • Abhijit Paul
  • Jegan
  • Sivakumar Jayachadran
  • Jyoti Budhia
  • Vivek Gadodia
  • Vishal Mehta
  • Piyush Chaudhry
  • Santosh Pasi
  • Gomathi Shankar
  • Courses:​
  • Options Trading
  • Dow Theory
  • Momentum Trading
  • Stock Investing
  • Harmonic Chart Patterns
  • Algo Trading
  • Elliot Wave Theory
  • Advanced Excel
  • Cryptocurrency
  • NSE Certification Course
  • Courses:​
  • Options Trading
  • Dow Theory
  • Momentum Trading
  • Stock Investing
  • Harmonic Chart Patterns
  • Algo Trading
  • Elliot Wave Theory
  • Advanced Excel
  • Cryptocurrency
  • NSE Certification Course
  • Webinars:
  • Bank Nifty Scalping
  • Intraday Trading Strategies
  • Options Trading Strategies
  • Options selling
  • Price Action
  • Relative Strength
  • Tax Planning
  • Options Buying
  • Growth Stocks
  • Portfolio Management
  • Risk Management
  • Renko Charts
  • Crude Oil
  • Traders Psychology
  • Moving Average
  • Multibagger Stocks
  • Free Learning Modules:
  • Intraday Trading
  • Options Scalping
  • Swing Trading
  • Financial Modelling
  • RSI Indicator
  • Bollinger Bands
  • Pricing of Futures
  • Personal Finance
  • Initial Public Offerings (IPO)
  • Value Investing
  • Technical Indicators
  • Candlesticks
  • Chart Patterns
  • Option Greeks
  • ELSS Funds
  • Banking and Insurance
  • Real Estate
  • Gold
  • Book Summaries:
  • Rich Dad Poor Dad
  • Psychology of Money
  • The Intelligent Investor
  • The Richest Man in Babylon
  • Think and Trade Like a Champion
  • Value Investing and Behavioural Finance
  • Trading in the Zone
  • Learn to Earn
  • Book Summaries:
  • Rich Dad Poor Dad
  • Psychology of Money
  • The Intelligent Investor
  • The Richest Man in Babylon
  • Think and Trade Like a Champion
  • Value Investing and Behavioural Finance
  • Trading in the Zone
  • Learn to Earn
  • Tools:
  • CAGR Calculator
  • SIP Calculator
  • eLearnOptions
  • Future Value Calculator
  • Present Value Calculator
  • Atal Pension Yojana
  • Cost of Delay Calculator
  • Become a Crorepati
  • Tools:
  • CAGR Calculator
  • SIP Calculator
  • eLearnOptions
  • Future Value Calculator
  • Present Value Calculator
  • Atal Pension Yojana
  • Cost of Delay Calculator
  • Become a Crorepati

© 2025 Elearnmarkets. All Rights Reserved

  • Visit Elearnmarkets
  • Courses
  • Webinars
  • Financial Guides
  • Get Free Counselling
  • Visit Elearnmarkets
  • Courses
  • Webinars
  • Financial Guides
  • Get Free Counselling

Download Our App

No Result
View All Result
  • Article Categories
    • Basic Finance
    • Derivatives
    • Financial Planning
    • Fundamental Analysis
    • Technical Analysis
    • ETFs & Mutual Funds
    • Marketshala
    • Miscellaneous
  • Language
    • Hindi
    • Bengali
    • English
  • Courses
  • Webinars
  • Stories
Get Free Course

© 2024 Elearnmarkets All Rights Reserved

A Handbook of Technical Analysis
To start your trading journey as a seasoned technical analyst
Download Guide For FREE
Guidebook On Chart Patterns
Take Your Trading To The Next Level With Strategies Shared In This Ebook
Download Guide For FREE
Trading Mentorship Program