“The trend is your friend”- quoted by Martin Zweig holds absolutely true when it comes to swing trading. Swing trading is all about making bigger profits by following the trend.
But how do we identify when the trend is beginning or going to reverse? This is the biggest problem faced by any swing trader.
We don’t want to keep this in suspense any longer and the answer to it is-Swing Trading Indicators. Today’s blog is about understanding swing trading indicators that will help us in identifying our swing trades. Swing traders use many trading indicators for identifying trading opportunities on underlying assets.
But if you are a novice in the stock market and don’t know what is actually meant by swing trading- then as we always say- Worry not! We are always here to help you understand these terms and further financial literacy!
So, let’s begin today’s blog by understanding what is swing trading-
What is Swing Trading?
Swing trading is a trading method used by traders who make gains by trading in the trend’s direction. Here, traders make a profit by trading along with the price movements of an asset usually over a few days and weeks.
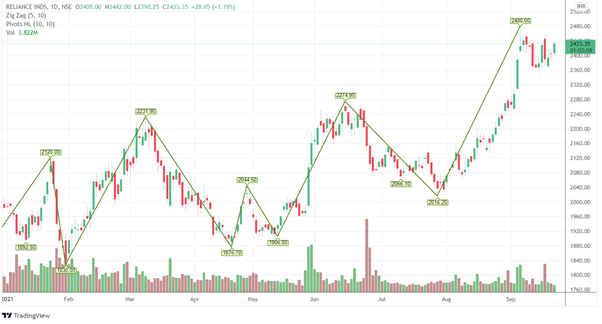
A swing low is when the price makes a low that is immediately followed by two consecutive higher lows. On the other hand, a swing high is when the price makes a high followed by two consecutive lower highs.
The swing traders analyze market trends by using techsis tools such as chart patterns or candlestick patterns, trends, and potential trend reversals in a short timeframe.
One should note that it is different from day trading, as day trading refers to buying and selling of the stocks on the same day, whereas swing trading involves holding the trading position for a few days to a few weeks.
By now you must have understood what is swing trading all about, now let us discuss the 5 Most Used Swing Trading Indicators that are used by the swing traders for identifying swing trading opportunities:
5 Most Used Swing Trading Indicators
1. Moving Averages
Moving averages are simply the average of the stock prices over a given period and smoothen out any erratic short-term spikes.
They are referred to as the lagging indicators as they don’t look back over past price action. Thus, Moving Averages are mainly used for confirming trends and used in swing trading.
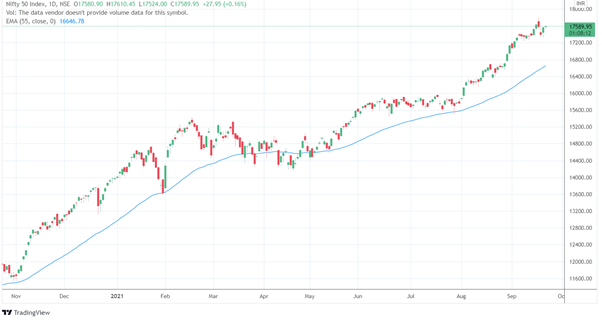
Moving Averages can be categorized into short-, medium- or long-term, based on the number of the periods such as 50- or 200-days moving average. Moving Averages are mainly of two types–
Simple moving averages, which take all the closing prices of a specific period and averages them out, and Exponential moving averages that give more weightage to the price which is closer to the current date.
Having discussed the basics of moving average, let’s see the use of this indicator in swing trading-
Swing traders use moving averages when a market’s short-term Moving Average crosses a longer-term Moving Average indicating that a change in momentum is taking place. When a faster Moving Average crosses a slower Moving Average from below then it indicates a bull move. When a faster Moving Average crosses a slower one from above, then the momentum may bersing to a bearish move.
2. Volume
Volume is an important indicator in swing trading as it tells us about the strength of the ongoing trend. Usually, a trend with high volume is stronger than one with weak volume. As more traders buy or sell, it forms a better basis for the price action.
Volume is crucial when there is a breakout in the trend. Generally, breakouts follow a period of consolidation accompanied by low volume. So, when the breakout occurs then volume spikes.
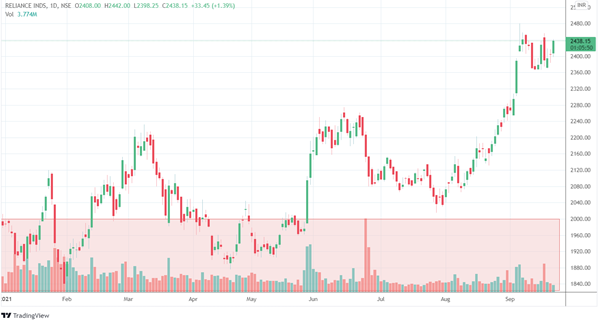
There are different types of volume indicators that signal whether the volume is rising or falling in the stock.
You can also watch our webinar on FINDING THE RIGHT SWING TRADING STRATEGY
3. Relative Strength Index
Momentum Indicators are popular among the swing traders and especially Relative Strength Index, which shows whether the stock’s prices are in overbought or the oversold zone.
Usually, when the prices are above the 70 levels, then we considered it in the overbought zone, on the other hand when the prices are below the 30 levels, it is considered to be an oversold zone.
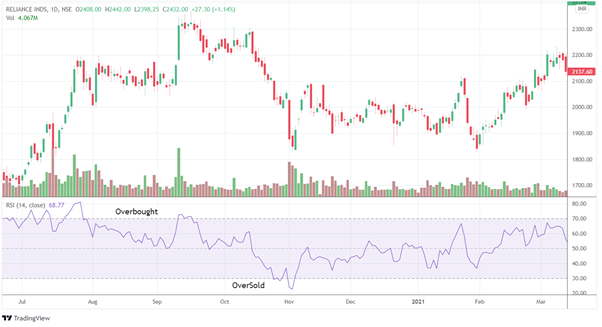
When the prices are in the overbought zone, it usually indicates the prices may reverse to the downtrend, and when the prices are in the oversold zone, it usually indicates the prices may reverse to an uptrend.

Thus, this indicator can be used in swing trading, as it tells us when the trend is going to reverse.
4. Stochastic Oscillator
The stochastic oscillator is another type of momentum indicator that works almost similar to the RSI. This indicator compares the closing price of a stock to the range of its prices over a particular period.
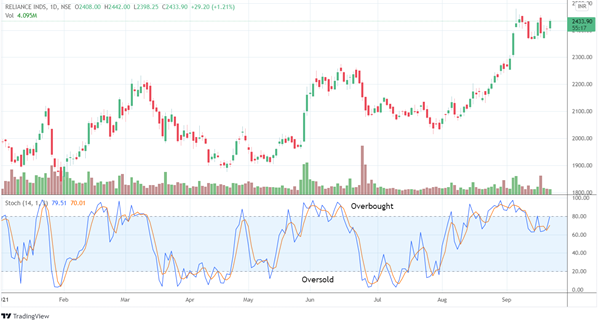
Like the RSI, the stochastic oscillator also shows the overbought and oversold zone. In this case, 80 is usually considered as overbought while under 20 is oversold. However, it comprises 2 lines, unlike RSI. One shows the current value of the oscillator whereas the other shows three-day MA.
You can read more about swing trading from our ELM School Module
5. Ease of Movement
Ease of movement is a momentum indicator that indicated the relationship between the rate of change in an asset’s price with its volume and can be used as a swing trading indicator. It is usually used in the daily chart and larger timeframes.
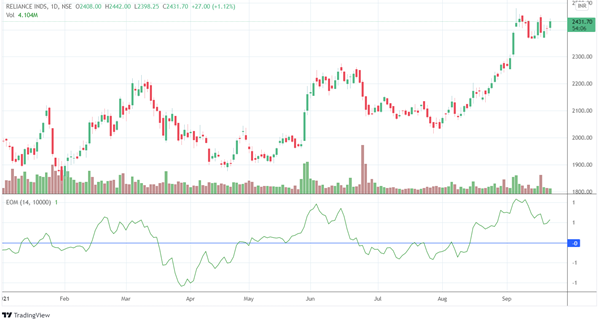
This indicator is plotted on a chart with zero as the baseline. So, when it rises above zero, then it’s indicating that the market’s price is advancing with relative ease and when there is a further EOM rise, the more easily the price will advance. As EOM falls below zero, then it indicates that the market is falling with increasing ease.
We’ve helped you identify the most used swing trading indicators that are used in swing trading and guide us in identifying opportunities for swing trades. Let’s move on to an open secret through this blog. Trust me, you are going to love this!
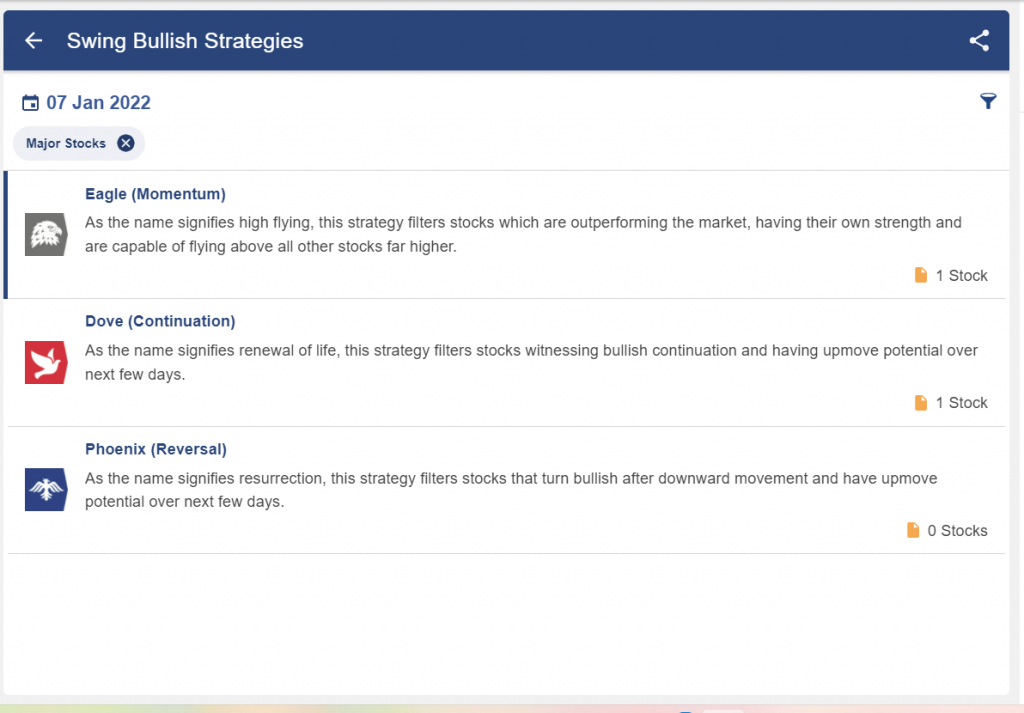
How to filter swing trading stocks using StockEdge?
In StockEdge there are various bullish as well bearish strategies available that help us in filtering out stocks for swing trading as shown below:
Bottomline
Swing trading is perfect for those traders who don’t have the time to sit on the trading screen throughout a day’s trading session. They can combine swing trading with their 9-5 job or any other business so that they can generate a separate source of a consistent cash flow for themselves. With a good strategy and proper risk management, one can expect to make good returns from swing trading.
Also, with swing trading, one doesn’t need to put one’s capital in a bad stock for a long time, unlike in a long-term investment. One can simply book a loss and move their capital to another stock if that trade goes wrong. Always remember while engaging in swing trading– “The Trend is your friend”. We hope you found this blog informative and use the information to its max potential in the practical world. Show some love by sharing this blog with your family and friends and help us in our mission of spreading financial literacy.
Happy Investing!


Without finding any other means of augmenting my income , i have been thinking about swing trading. I have a small investment portfolio. I am 81 years old. Can you suggest some book to help me ? The same should be available on line
Hi,
You can read more about Swing trading from our ELM School Module
Thank you for Reading!
Just apply 10 & 30 simple moving average sir, on daily timeframe, enter trade on bullish cross over, exit when the Trend finishes, put a stoploss on the previous low candle of crossover and trade only in Nifty top 10 stocks.