Elearnmarkets - Financial Market Learning
  • Categories
    • Basic Finance
    • Derivatives
    • Financial Planning
    • Fundamental Analysis
    • Technical Analysis
    • Marketshala
    • Miscellaneous
  • Language
    • English
    • Hindi
    • Bengali
No Result
View All Result
  • Courses
  • Webinars
  • Learn On Elearnmarkets
Elearnmarkets - Learn Stock Market, trading, investing for Free
No Result
View All Result
Home Miscellaneous
Hourly Chart

Approx 380 Points Fall In The Index, Further Down Move Possible?

Elearnmarkets by Elearnmarkets
August 30, 2021
in Miscellaneous
Reading Time: 4 mins read
0
77
VIEWS
Share on FacebookShare on TwitterShare on WhatsApp

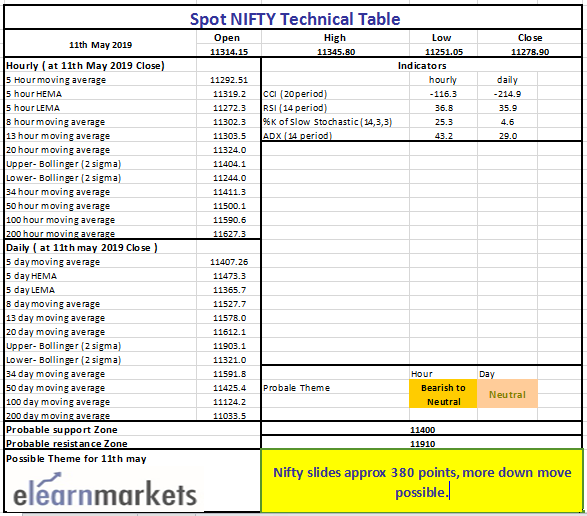
Nifty close 11278.90: After making a Doji in the weekly chart on the last week, today Nifty is down almost 380 points. Technically the sign was given by the index as it was breaching below the low of that Doji. But what are the factors which impacted so much in the Index?

The first one as we all know the uncertainty of Lok- Sabha election. Second, the rising tension of US-China trade war. Third, the volatility index (India Vix) crossed last three years high on Monday’s trading session. So these are the possible scenarios which are creating an impact in the market.

Now the Big question for Nifty is – will the correction continue?

Lets find out.

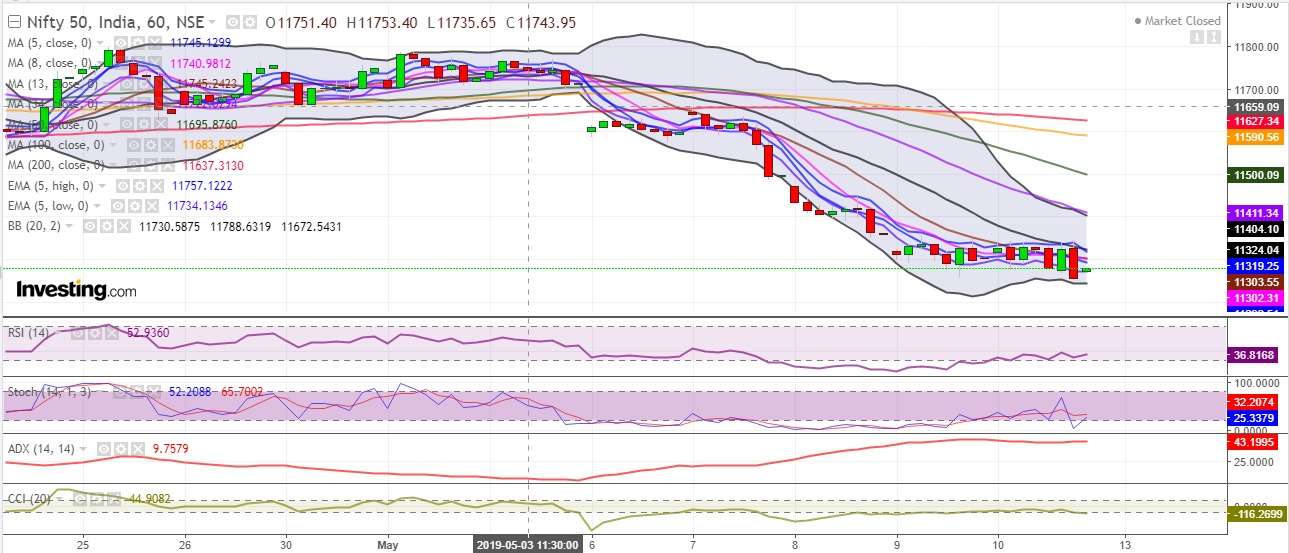
Hourly Technical: Market was very choppy on Friday’s trading session. Though, it had a negative close. So as of now, 11100 would be the possible support level for the Index and the 11350 is the possible short term resistance level.

Technical indicators side, RSI is showing tripple divergence and it is trading above 35 level, Stochastic is below its 30 level, ADX is trading above 40 and CCI is below -100 level.

So overall, sentiment is weak but the momentum is lacking. In case price breaches below the 11250 level, further down move likely to take place. But if price start moving upward, 11350and 11420 would be the possible resistance level.

Hourly Chart
Hourly Chart

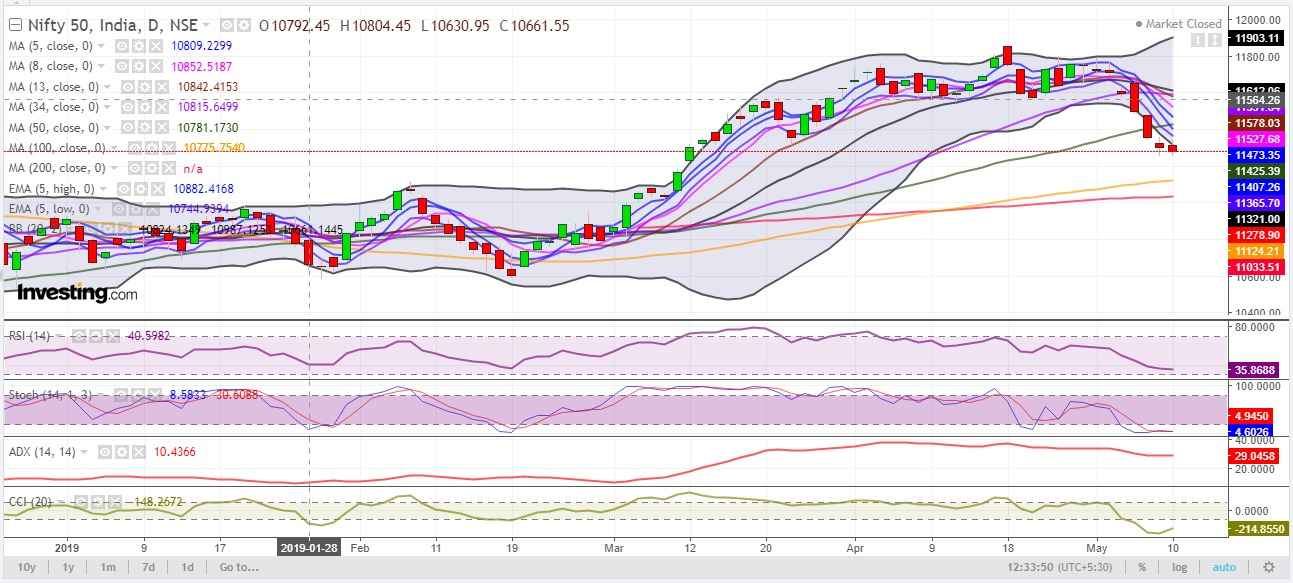
Daily Technical: On the daily chart Nifty is consolidating for last two days. Once it breaks either side there will be quick move.

As per the price action and indicators, if the move happens on the downside then it will be fierce.

On the indicators side, RSI is below 50, Stochastic is below 10, ADX is below  30 and the CCI is below -200 level.

So there is weakness in the market.If the price goes down 11100 would be the possible support (100 MA is at 11124.20). In case it goes up, 11425.39 (50 MA line) is the possible resistance level.

Daily Chart
Daily Chart

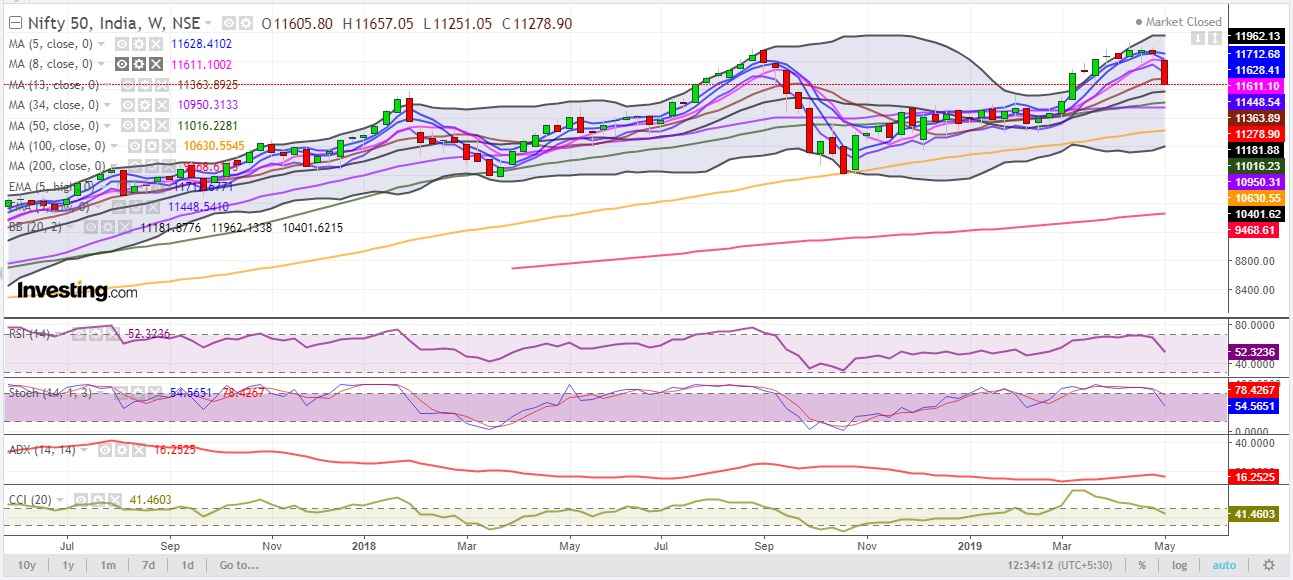
Weekly Technical: It is big red candles in the weekly chart and as per the price action suggest the move is fierce and further downside is likely to take place. Two possible support level would be there if price slides below this week low, one at 11000 level and the seconds one is at 10650. 

Indicators are also suggesting weakness ahead, RSI below 55 level, Stochastic is also trading below the 55level,  ADX is below  20 and the CCI is below 50 level.

So overall there is more room for correction at this moment. But if any pull back happens ,11500 would be the possible resistance level.

Weekly Chart
Weekly Chart

Approx 380 Points Fall In The Index, Further Down Move Possible? 1
Technical Analysis
Nifty

BOTTOMLINE

Visit elearnmarkets to get access to NSE and MCX certified courses and standout from others in the Financial Markets.

You can use StockEdge app to get cutting edge over others in both short term trading and investing. Here you not only get data at one particular place but can also create your own combination scans based on your own technical and fundamental parameter. See the video below to know about various features in StockEdge app.

Tags: englishstock market reportstock market weekly reportweekly market reportweekly report
ShareTweetSend
Previous Post

My first self financed solo trip, Thanks Mom!

Next Post

Understand the significance of Volume in Trading

Elearnmarkets

Elearnmarkets

Elearnmarkets (ELM) is a complete financial market portal where the market experts have taken the onus to spread financial education. ELM constantly experiments with new education methodologies and technologies to make financial education effective, affordable and accessible to all. You can connect with us on Twitter @elearnmarkets.

Related Posts

Binary Options Trading
Miscellaneous

Tips for Successful Binary Options Trading

September 29, 2022
3.1k
5 Simple Ways to Get Into Forex Trading for Beginners 2
Miscellaneous

5 Simple Ways to Get Into Forex Trading for Beginners

September 21, 2022
11.3k
Top 11 Factors to consider for taking a Personal Loan 3
Miscellaneous

Top 11 Factors to consider for taking a Personal Loan

August 29, 2022
1.4k
Term Plan with or Without Maturity Benefits - What's the Difference? 4
Miscellaneous

Term Plan with or Without Maturity Benefits – What’s the Difference?

September 12, 2022
314

Leave a Reply Cancel reply

Your email address will not be published. Required fields are marked *

Follow Us

Facebook-f Twitter Instagram Linkedin-in Youtube Telegram

Register on Elearnmarkets

Continue your financial learning by creating your own account on Elearnmarkets.com

Register Free Account

Download App

Categories

  • Basic Finance
  • Derivatives
  • Financial Planning
  • Fundamental Analysis
  • Technical Analysis
  • Marketshala
  • Miscellaneous

Popular On Elearnmarkets

  • Market Superheroes:
  • Vivek Bajaj
  • Chetan Panchamia
  • Ashish Kyal
  • Premal Parekh
  • Abhijit Paul
  • Jegan
  • Sivakumar Jayachadran
  • Vishal Malkan
  • Jyoti Budhia
  • Vivek Gadodia
  • Vishal Mehta
  • Piyush Chaudhry
  • Santosh Pasi
  • Gomathi Shankar
  • Market Superheroes:
  • Vivek Bajaj
  • Chetan Panchamia
  • Ashish Kyal
  • Premal Parekh
  • Abhijit Paul
  • Jegan
  • Sivakumar Jayachadran
  • Vishal Malkan
  • Jyoti Budhia
  • Vivek Gadodia
  • Vishal Mehta
  • Piyush Chaudhry
  • Santosh Pasi
  • Gomathi Shankar
  • Courses:​
  • Options Trading
  • Dow Theory
  • Momentum Trading
  • Stock Investing
  • Stock Market for Beginners
  • Harmonic Chart Patterns
  • Algo Trading
  • Elliot Wave Theory
  • Advanced Excel
  • Cryptocurrency
  • NSE Certification Course
  • Courses:​
  • Options Trading
  • Dow Theory
  • Momentum Trading
  • Stock Investing
  • Stock Market for Beginners
  • Harmonic Chart Patterns
  • Algo Trading
  • Elliot Wave Theory
  • Advanced Excel
  • Cryptocurrency
  • NSE Certification Course
  • Webinars:
  • Bank Nifty Scalping
  • Intraday Trading Strategies
  • Options Trading Strategies
  • Options selling
  • Price Action
  • Relative Strength
  • Tax Planning
  • Options Buying
  • Growth Stocks
  • Portfolio Management
  • Relative Strength Index
  • Risk Management
  • Renko Charts
  • Crude Oil
  • Traders Psychology
  • Moving Average
  • Multibagger Stocks
  • Free Learning Modules:
  • Intraday Trading
  • Options Scalping
  • Swing Trading
  • Financial Modelling
  • RSI Indicator
  • Bollinger Bands
  • Pricing of Futures
  • Personal Finance
  • Initial Public Offerings (IPO)
  • Value Investing
  • Technical Indicators
  • Candlesticks
  • Chart Patterns
  • Option Greeks
  • ELSS Funds
  • Banking and Insurance
  • Real Estate
  • Gold
  • Book Summaries:
  • Rich Dad Poor Dad
  • Psychology of Money
  • The Intelligent Investor
  • The Richest Man in Babylon
  • Think and Trade Like a Champion
  • Value Investing and Behavioural Finance
  • Trading in the Zone
  • Learn to Earn
  • Book Summaries:
  • Rich Dad Poor Dad
  • Psychology of Money
  • The Intelligent Investor
  • The Richest Man in Babylon
  • Think and Trade Like a Champion
  • Value Investing and Behavioural Finance
  • Trading in the Zone
  • Learn to Earn
  • Tools:
  • CAGR Calculator
  • SIP Calculator
  • eLearnOptions
  • Future Value Calculator
  • Present Value Calculator
  • Atal Pension Yojana
  • Cost of Delay Calculator
  • Become a Crorepati
  • Tools:
  • CAGR Calculator
  • SIP Calculator
  • eLearnOptions
  • Future Value Calculator
  • Present Value Calculator
  • Atal Pension Yojana
  • Cost of Delay Calculator
  • Become a Crorepati

© 2023 Elearnmarkets. All Rights Reserved

  • Visit Elearnmarkets
  • Courses
  • Webinars
  • Financial Guides
  • Get Free Counselling
  • Visit Elearnmarkets
  • Courses
  • Webinars
  • Financial Guides
  • Get Free Counselling

Get Elearnmarkets App

No Result
View All Result
  • Article Categories
    • Basic Finance
    • Derivatives
    • Financial Planning
    • Fundamental Analysis
    • Technical Analysis
    • Marketshala
    • Miscellaneous
  • Language
    • Hindi
    • Bengali
    • English
  • Courses
  • Webinars

© 2020 Elearnmarkets All Rights Reserved