Elearnmarkets - Financial Market Learning
  • Courses
  • Webinars
  • Stories
  • Language
    • English
    • Hindi
    • Bengali
No Result
View All Result
Get Free Course
  • Basic Finance
  • Derivatives
    • Futures
    • Options
  • Financial Planning
  • Fundamental Analysis
  • Technical Analysis
  • Mutual Funds
  • Marketshala
  • Miscellaneous
Elearnmarkets - Learn Stock Market, trading, investing for Free
  • Courses
  • Webinars
  • Stories
  • Language
    • English
    • Hindi
    • Bengali
No Result
View All Result
Get Free Course
Elearnmarkets - Learn Stock Market, trading, investing for Free
No Result
View All Result
Home Basic Finance
Why is Cash conversion cycle important

Why is Cash Conversion Cycle Important?

Elearnmarkets by Elearnmarkets
October 27, 2021
in Basic Finance
Reading Time: 4 mins read
0
12.5k
VIEWS
Share on FacebookShare on XShare on WhatsApp

People in stock market usually believe the complex things to be most effective, but however, the things which are simple are found to be a better choice for both in personal life as well as stock-market. One such similar concept we have is Cash Conversion Cycle.

It is a simple yet very effective way to analyze the efficiency of company’s operation.

Table of Contents
Cash Conversion Cycle
Calculation of Cash Conversion Cycle
Negative Cash Conversion Cycle
Illustration
Bottomline
Key Takeaways

Cash Conversion Cycle

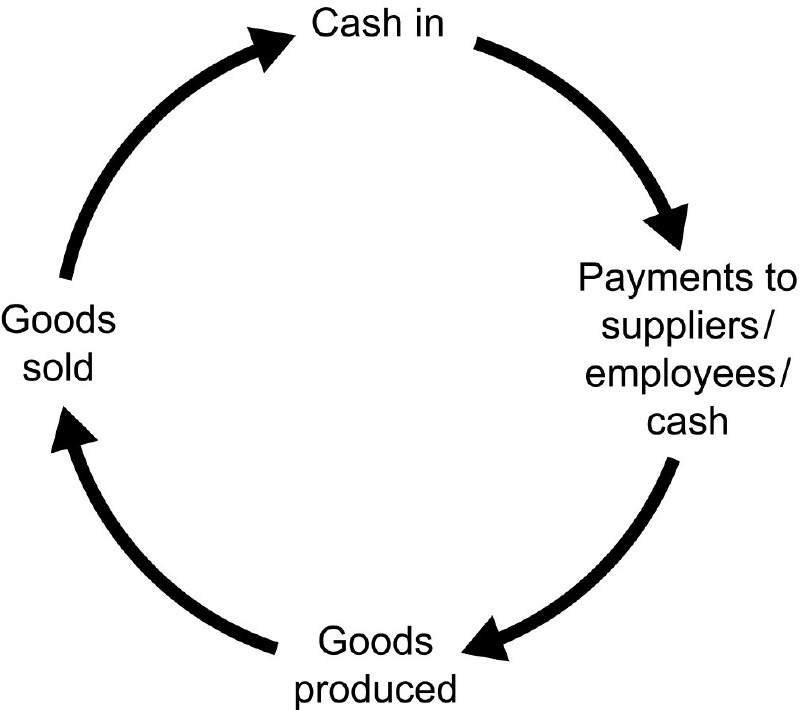
It measures the time period between the cash outlay and the inflow of cash i.e. it calculates the number of days since the company made payment to procure raw materials and cash received from the sale of such goods. In simple words, it measures the time period for which the funds are tied up in the business. It is a very important metric for any company in the manufacturing sector.

Cash Conversion Cycle

Calculation of Cash Conversion Cycle

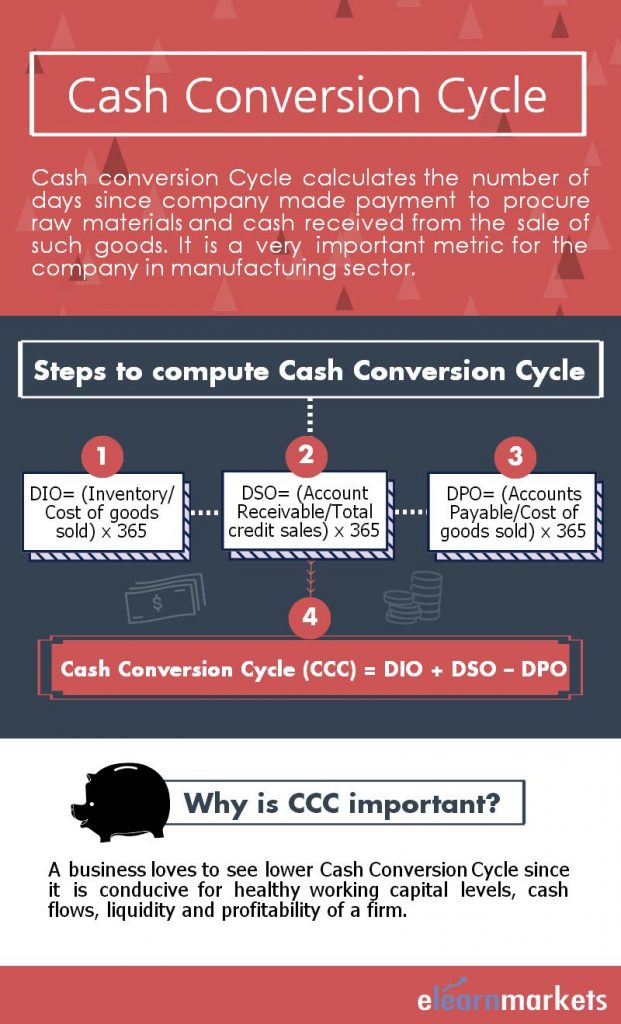
It is calculated by summing up Days Sales Outstanding and Days Inventory Outstanding and subtracting Days Payable Outstanding. The shorter the value, better is for the company.

Now, we will understand how to calculate the above three figures.
1. Days Inventory Outstanding (DIO)- It measures how fast a company converts its raw material into sales. Lower the better.

DIO= (Inventory/Cost of sales) x 365

2. Days Sales Outstanding (DSO)– It measures how quickly a company receives cash from its customers. Lower the figure, better is the company’s operation.

DSO= (Account Receivable/Total credit sales) x 365

3. Days Payable Outstanding (DPO)– It calculates how quickly a company makes payment for its purchases. Unlike the first two figures, a company would want its days payable outstanding to be higher.

DPO= (Accounts Payable/Cost of sales) x 365

Cash conversion cycle

Negative Cash Conversion Cycle

There are few companies whose business model results in negative cash conversion cycle. It implies that the company is able to manage its working capital in such an efficient manner that on an average it is able to buy its inventory, sell the final product and collect the receivable before the corresponding account payable becomes due. This is an ideal situation for a business.

Once you have calculated the above three figures, you can compute this conversion cycle as follows-

Cash Conversion Cycle= Days in Inventory Outstanding (DIO) + Days in Sales Outstanding (DSO) – Days in Payables Outstanding (DPO)

To know about this cycle in more details you can watch the video below:

Illustration

We can do the calculation in just 4 steps and we need information from the working capital accounts like Inventory, Accounts Receivable and Accounts Payable along with some Income statement items. Let’s take an example to understand this.

Also Read: How to Prepare Income Statement?

Net Revenue                           40000

Inventory                                2500

Cost of Goods sold                 25000

Average Receivables              850

Average Payables                   1000

Step 1: Calculation of Days Inventory outstanding (DIO)

DIO= (Average Inventory/COGS) x 365

       = 2500/25000 x 365 = 37 days

Step 2: Calculation of Days Sales outstanding (DSO)

 DSO= (Account Receivable/Total credit sales) x 365

         = 850/40000 x 365= 8 days

Step 3: Calculation of Days Payable Outstanding (DPO)

DPO= (Average Payable/COGS) x 365

        = 1000/25000 x 365 =15 days

Step 4: Calculation of Cash Conversion Cycle (CCC)

CCC = DIO + DSO – DPO

         = 37 + 8 – 15 = 30 days

It implies that the company takes approximately 30 days on an average to purchase its inventory, make payment to suppliers, collect the receivables, and receive cash.

Bottomline

Cash conversion cycle is an important metric for a business to determine the efficiency at which a company is able to convert its inventory into sales and then into cash.

A business loves to see lower value of this cycle since it is conducive to healthy working capital levels, cash flows, liquidity and profitability of a firm.

In order to get the latest updates about Financial Markets visit https://stockedge.com/

Tags: englishliquidityratio analysis
ShareTweetSend
Get Kotak Offer Get Kotak Offer Get Kotak Offer
Previous Post

Understand the Relationship Between Demand And Supply

Next Post

Mastering Trading Psychology and Money Management to Trade Effectively

Elearnmarkets

Elearnmarkets

Elearnmarkets (ELM) is a complete financial market portal where the market experts have taken the onus to spread financial education. ELM constantly experiments with new education methodologies and technologies to make financial education effective, affordable and accessible to all. You can connect with us on Twitter @elearnmarkets.

Related Posts

How is standard deviation used in mutual fund
ETFs & Mutual Funds

How is Standard Deviation Used in Mutual Fund

April 22, 2025
353
Ways to Make Trading More Transparent
Cryptocurrency

Under the Crypto Hood: 5 Ways to Make Trading More Transparent

May 5, 2025
79
options trading books
Basic Finance

Top 5 Options Trading Books for Beginners

March 19, 2025
856
The Rise of Meme Coins Like Trump Coin and Why They May Be a Good Investment 1
Cryptocurrency

The Rise of Meme Coins Like Trump Coin and Why They May Be a Good Investment

February 26, 2025
166

Leave a Reply Cancel reply

Your email address will not be published. Required fields are marked *

Disclaimer

Elearnmarkets (Kredent InfoEdge Pvt. Ltd.) is a SEBI-registered Research Analyst (RA) entity (SEBI Registration No.: INH300007493). The information provided in this article is for educational and informational purposes only and should not be considered as an offer to buy or sell any securities or investment products.

The stocks, securities, and investment instruments mentioned herein are not recommendations under SEBI (Research Analysts) Regulations, 2014. Readers are advised to conduct their own due diligence and seek independent financial advice before making any investment decisions.

Investments in securities markets are subject to market risks. Please read all related documents carefully before investing. Investing in Equity Shares,
Derivatives, Mutual Funds, or other instruments carry inherent risks, including potential loss of capital. Elearnmarkets (Kredent InfoEdge Pvt. Ltd.) does not provide any guarantee or assurance of returns on any investments. Past performance is not indicative of future performance.

Elearnmarkets Logo

Follow Us

Facebook-f X-twitter Instagram Linkedin-in Youtube Telegram

Register on Elearnmarkets

Continue your financial learning by creating your own account on Elearnmarkets.com

Register Free Account

Download App

Playstore logo
Download on app store

Categories

  • Basic Finance
  • Derivatives
  • Financial Planning
  • Fundamental Analysis
  • Technical Analysis
  • Mutual Funds
  • Miscellaneous

Popular On Elearnmarkets

  • Market Superheroes:
  • Vivek Bajaj
  • Chetan Panchamia
  • Ashish Kyal
  • Premal Parekh
  • Abhijit Paul
  • Jegan
  • Sivakumar Jayachadran
  • Jyoti Budhia
  • Vivek Gadodia
  • Vishal Mehta
  • Piyush Chaudhry
  • Santosh Pasi
  • Gomathi Shankar
  • Market Superheroes:
  • Vivek Bajaj
  • Chetan Panchamia
  • Ashish Kyal
  • Premal Parekh
  • Abhijit Paul
  • Jegan
  • Sivakumar Jayachadran
  • Jyoti Budhia
  • Vivek Gadodia
  • Vishal Mehta
  • Piyush Chaudhry
  • Santosh Pasi
  • Gomathi Shankar
  • Courses:​
  • Options Trading
  • Dow Theory
  • Momentum Trading
  • Stock Investing
  • Harmonic Chart Patterns
  • Algo Trading
  • Elliot Wave Theory
  • Advanced Excel
  • Cryptocurrency
  • NSE Certification Course
  • Courses:​
  • Options Trading
  • Dow Theory
  • Momentum Trading
  • Stock Investing
  • Harmonic Chart Patterns
  • Algo Trading
  • Elliot Wave Theory
  • Advanced Excel
  • Cryptocurrency
  • NSE Certification Course
  • Webinars:
  • Bank Nifty Scalping
  • Intraday Trading Strategies
  • Options Trading Strategies
  • Options selling
  • Price Action
  • Relative Strength
  • Tax Planning
  • Options Buying
  • Growth Stocks
  • Portfolio Management
  • Risk Management
  • Renko Charts
  • Crude Oil
  • Traders Psychology
  • Moving Average
  • Multibagger Stocks
  • Free Learning Modules:
  • Intraday Trading
  • Options Scalping
  • Swing Trading
  • Financial Modelling
  • RSI Indicator
  • Bollinger Bands
  • Pricing of Futures
  • Personal Finance
  • Initial Public Offerings (IPO)
  • Value Investing
  • Technical Indicators
  • Candlesticks
  • Chart Patterns
  • Option Greeks
  • ELSS Funds
  • Banking and Insurance
  • Real Estate
  • Gold
  • Book Summaries:
  • Rich Dad Poor Dad
  • Psychology of Money
  • The Intelligent Investor
  • The Richest Man in Babylon
  • Think and Trade Like a Champion
  • Value Investing and Behavioural Finance
  • Trading in the Zone
  • Learn to Earn
  • Book Summaries:
  • Rich Dad Poor Dad
  • Psychology of Money
  • The Intelligent Investor
  • The Richest Man in Babylon
  • Think and Trade Like a Champion
  • Value Investing and Behavioural Finance
  • Trading in the Zone
  • Learn to Earn
  • Tools:
  • CAGR Calculator
  • SIP Calculator
  • eLearnOptions
  • Future Value Calculator
  • Present Value Calculator
  • Atal Pension Yojana
  • Cost of Delay Calculator
  • Become a Crorepati
  • Tools:
  • CAGR Calculator
  • SIP Calculator
  • eLearnOptions
  • Future Value Calculator
  • Present Value Calculator
  • Atal Pension Yojana
  • Cost of Delay Calculator
  • Become a Crorepati

© 2025 Elearnmarkets. All Rights Reserved

  • Visit Elearnmarkets
  • Courses
  • Webinars
  • Financial Guides
  • Get Free Counselling
  • Visit Elearnmarkets
  • Courses
  • Webinars
  • Financial Guides
  • Get Free Counselling

Download Our App

No Result
View All Result
  • Article Categories
    • Basic Finance
    • Derivatives
    • Financial Planning
    • Fundamental Analysis
    • Technical Analysis
    • ETFs & Mutual Funds
    • Marketshala
    • Miscellaneous
  • Language
    • Hindi
    • Bengali
    • English
  • Courses
  • Webinars
  • Stories
Get Free Course

© 2024 Elearnmarkets All Rights Reserved

Guide to Basics of Stock Investing
Learn to interpret the financial performance and health of a company.
Download Guide For FREE
Trading Mentorship Program