Elearnmarkets - Financial Market Learning
  • Courses
  • Webinars
  • Stories
  • Language
    • English
    • Hindi
    • Bengali
No Result
View All Result
Get Free Course
  • Basic Finance
  • Derivatives
    • Futures
    • Options
  • Financial Planning
  • Fundamental Analysis
  • Technical Analysis
  • Mutual Funds
  • Marketshala
  • Miscellaneous
Elearnmarkets - Learn Stock Market, trading, investing for Free
  • Courses
  • Webinars
  • Stories
  • Language
    • English
    • Hindi
    • Bengali
No Result
View All Result
Get Free Course
Elearnmarkets - Learn Stock Market, trading, investing for Free
No Result
View All Result
Home Basic Finance
Sharpe Ratio

Sharpe Ratio: Meaning, Formula & Example

Vivek Bajaj by Vivek Bajaj
November 3, 2025
in Basic Finance, Mutual Funds
Reading Time: 8 mins read
0
736
VIEWS
Share on FacebookShare on XShare on WhatsApp

Key Takeaways

  • Sharpe Ratio: The Sharpe Ratio shows how efficiently an investment generates returns for the level of risk taken.
  • Simple Formula: It is calculated as (Portfolio Return – Risk-Free Return) ÷ Portfolio Volatility.
  • Comparison Tool: Helps investors compare mutual funds within the same category for balanced risk and reward.
  • Indian Context: AMCs use the 91-day Treasury Bill yield as the risk-free rate in Sharpe Ratio calculations.
  • Ideal Range: A Sharpe Ratio above 1 is good, above 2 is strong, and 3 or more indicates excellent risk management.

Table Of Contents
  1. Key Takeaways
  2. What is Sharpe Ratio?
  3. How to Measure Sharpe Ratio?
    • Sharpe Ratio Formula
    • How to Measure the Sharpe Ratio?
  4. Importance of Sharpe Ratio
  5. Sharpe Ratio for Indian Investors
  6. Conclusion
  7. Frequently Asked Questions (FAQs)

Imagine two Uber drivers taking you from Nariman Point in Mumbai to the airport. Driver A gets you there in 30 minutes with a smooth, predictable ride. Driver B also takes 30 minutes, but he’s a menace. Constantly slamming the brakes, swerving between lanes, and giving you a minor heart attack. Both achieved the same result, but the experiences were worlds apart.

This is exactly what the Sharpe Ratio helps investors understand. It’s not just about how much return you get, but how smooth and risk-adjusted the ride is.

This, in a nutshell, is the flaw with judging investments solely on their final percentage return. 

The journey is as important as the destination. This realization is why senior investors and Wall Street “quants” swear by one metric: the Sharpe Ratio. 

It’s the financial world’s way of rating your investment’s journey, and it’s far more revealing than just looking at the final fare.

What is Sharpe Ratio?

Created by Nobel Prize winner William F. Sharpe, the Sharpe Ratio serves as a gauge for risk-adjusted performance. It addresses a fundamental investor concern: “Is the level of risk I’m assuming justified by the potential returns?”

Put simply, this ratio calculates the additional gain you receive from a risky investment compared to a completely secure one, relative to its price swings. Consider it a report card that grades how efficiently your money is working for you, considering the bumps along the way.

How to Measure Sharpe Ratio?

Calculating the Sharpe Ratio involves pulling together three key pieces of financial data.

First, you need the average return of your specific investment, such as an equity mutual fund. Next, you must identify the prevailing risk-free rate, which in the Indian context is best represented by the yield on the 91-day Government Treasury Bill. Finally, you have to determine the investment’s standard deviation. This third metric captures the instability of the returns; a higher number signals a much rougher and less predictable performance history.

Sharpe Ratio Formula

Here is the standard deviation formula you can use to calculate the Sharpe ratio:
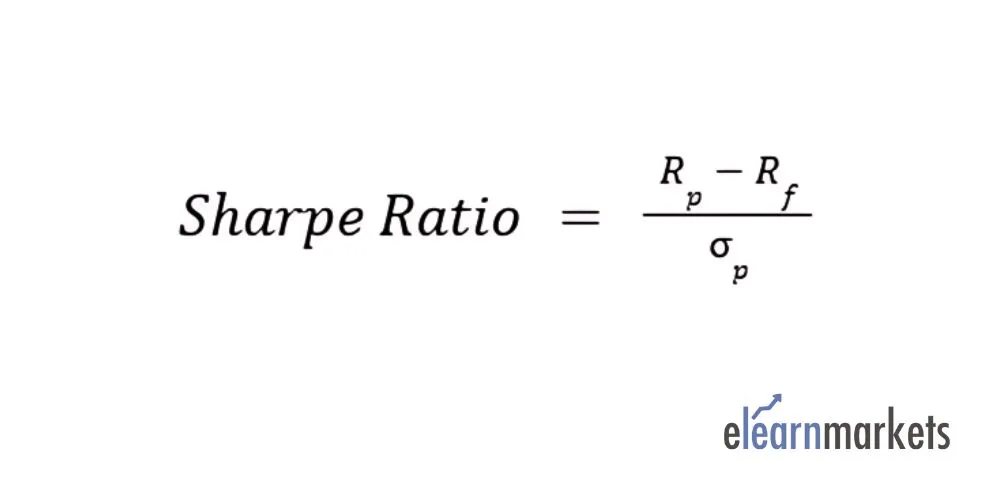
formula of sharpe ratio

In this formula:

  • Rp = Investment or portfolio’s average return that your investment or portfolio would give you over a given period of time
  • Rf = Risk-free return that is used as a benchmark to determine the amount of additional return your investment is generating compared to a safe investment.
  • σp = The investment’s standard deviation (a risk or volatility measure) is the extent to which the returns vary with time

This formula shows you how much extra returns (over the risk-free) you’re getting for each unit of risk you’re taking. Suppose your portfolio return is 12%, the risk-free rate is 6%, and the standard deviation is 10%. Then:

Sharpe Ratio = 12 – 6/10

Sharpe Ratio = 0.6

A Sharpe ratio of 0.6 means that you are being paid 0.6 units of extra return for each unit of risk. In simple words, it tells you how efficiently your investment is generating returns for the risk you are taking.

How to Measure the Sharpe Ratio?

To calculate it, you just need three things:

  1. Average return of your investment – say, a mutual fund.
  2. Risk-free rate, which in India is usually the yield on a 91-day Treasury Bill.
  3. Standard deviation of returns, that’s how much your returns fluctuate.

Now, plug them into the formula:
Sharpe Ratio = (Rp – Rf) / σp

And there you go, it tells you how much extra return you earned for every bit of risk you took.

Sharpe vs Sortino vs Treynor

People often confuse these three, so let’s untangle them real quick:

  • Sortino Ratio: Only worries about the bad kind of volatility, the downside. It doesn’t punish the fund for positive fluctuations, which makes it ideal for investors who hate losses more than they love gains.
  • Treynor Ratio: Swaps standard deviation for Beta, which means it focuses only on market-related risk. In simple words, it checks how the fund moves compared to an index like Nifty 50.

Sharpe cares about total risk, Sortino about downside, and Treynor about market. Each tells a slightly different story.

Importance of Sharpe Ratio

Why does this matter to you?

  • Sees Beyond the Hype: Two funds may both claim 15% annual returns. If Fund A achieved this smoothly and Fund B with terrifying dips, the Sharpe Ratio identifies Fund A as the superior choice.
  • Builds Confidence: A smoother, high-Sharpe investment is easier to hold during market downturns, preventing panic-driven decisions.
  • The Diversification Key: It helps you combine assets (like equity and debt) to create a portfolio that is “more than the sum of its parts,” potentially achieving higher returns for the same risk or the same return for lower risk.

Sharpe Ratio for Indian Investors

When you’re comparing mutual funds, don’t just jump at the biggest return number.
Instead, look at the Sharpe Ratio, but make sure you’re comparing funds from the same category.

At StockEdge, you can have the data neatly.
A higher Sharpe Ratio basically says, “Hey, this fund managed to earn better returns for every bit of risk it took.”
That’s efficiency, and that’s what you want in a fund.

Conclusion

Running after returns alone is like getting into an Uber with a driver who thinks he’s in Fast & Furious. You might reach the destination faster, but you’ll probably chew your nails off on the way. The Sharpe Ratio helps you pick the calmer, more reliable driver, one who knows speed and safety both matter.
It’s your best bet to make sure your wealth grows smoothly, without unnecessary turbulence.

Frequently Asked Questions (FAQs)

1. What’s considered a good Sharpe Ratio?

There’s no hard rule, but as a thumb rule, anything above 1 is decent, 2 is pretty impressive, and if a fund touches 3 or higher, you’ve probably found a star performer. It means the fund isn’t just making returns, it’s doing it smartly, with balanced risk.

2. Does higher Sharpe always mean better investment?

Mostly, but not blindly. It’s based on past data and punishes joyful upside volatility as well. Use it as a key tool, not the only tool, in your research kit.

3. How is Sharpe ratio calculated in mutual funds?

Fund houses calculate and publish it in their monthly fact sheets. They use the 91-day T-bill yield for the risk-free rate and the fund’s 3-year standard deviation.

4. What is a negative Sharpe ratio?

A big red flag. It means the investment underperformed the risk-free asset. You took a risk only to earn less than a safe T-bill.

ShareTweetSend
Previous Post

Downside Tasuki Gap: Meaning, Formation & Guide

Next Post

Indexation in Mutual Funds: Meaning, Benefits & Calculation

Vivek Bajaj

Vivek Bajaj

Mr Vivek Bajaj has over 20 years of experience in Multi-Asset Trading, Momentum Investor and student of Mark Minervini. He is the co-founder of StockEdge and Elearnmarkets and is passionate about data, analytics, and technology. He serves on various exchange committees and has played a significant role in the evolution of India's derivative market. He has been a speaker at various colleges and higher institutions, including IIT and IIMs.

Related Posts

Systematic Transfer Plan
Mutual Funds

Systematic Transfer Plan: What is STP in Mutual Funds? Benefits, Types & How It Works

November 27, 2025
45
Choose the Right Mutual Funds in India
Mutual Funds

How to Choose the Right Mutual Funds in India to Invest in 2025

November 7, 2025
202
Indexation in mutual funds
Basic Finance

Indexation in Mutual Funds: Meaning, Benefits & Calculation

October 28, 2025
96
amortisation
Basic Finance

Amortisation: What It Is & How To Calculate?

September 26, 2025
213

Leave a Reply Cancel reply

Your email address will not be published. Required fields are marked *

Disclaimer

Elearnmarkets (Kredent InfoEdge Pvt. Ltd.) is a SEBI-registered Research Analyst (RA) entity (SEBI Registration No.: INH300007493). The information provided in this article is for educational and informational purposes only and should not be considered as an offer to buy or sell any securities or investment products.

The stocks, securities, and investment instruments mentioned herein are not recommendations under SEBI (Research Analysts) Regulations, 2014. Readers are advised to conduct their own due diligence and seek independent financial advice before making any investment decisions.

Investments in securities markets are subject to market risks. Please read all related documents carefully before investing. Investing in Equity Shares,
Derivatives, Mutual Funds, or other instruments carry inherent risks, including potential loss of capital. Elearnmarkets (Kredent InfoEdge Pvt. Ltd.) does not provide any guarantee or assurance of returns on any investments. Past performance is not indicative of future performance.

Elearnmarkets Logo

Follow Us

Facebook-f X-twitter Instagram Linkedin-in Youtube Telegram

Register on Elearnmarkets

Continue your financial learning by creating your own account on Elearnmarkets.com

Register Free Account

Download App

Playstore logo
Download on app store

Categories

  • Basic Finance
  • Derivatives
  • Financial Planning
  • Fundamental Analysis
  • Technical Analysis
  • Mutual Funds
  • Miscellaneous

Popular On Elearnmarkets

  • Market Superheroes:
  • Vivek Bajaj
  • Chetan Panchamia
  • Ashish Kyal
  • Premal Parekh
  • Abhijit Paul
  • Jegan
  • Sivakumar Jayachadran
  • Jyoti Budhia
  • Vivek Gadodia
  • Vishal Mehta
  • Piyush Chaudhry
  • Santosh Pasi
  • Gomathi Shankar
  • Market Superheroes:
  • Vivek Bajaj
  • Chetan Panchamia
  • Ashish Kyal
  • Premal Parekh
  • Abhijit Paul
  • Jegan
  • Sivakumar Jayachadran
  • Jyoti Budhia
  • Vivek Gadodia
  • Vishal Mehta
  • Piyush Chaudhry
  • Santosh Pasi
  • Gomathi Shankar
  • Courses:​
  • Options Trading
  • Dow Theory
  • Momentum Trading
  • Stock Investing
  • Harmonic Chart Patterns
  • Algo Trading
  • Elliot Wave Theory
  • Advanced Excel
  • Cryptocurrency
  • NSE Certification Course
  • Courses:​
  • Options Trading
  • Dow Theory
  • Momentum Trading
  • Stock Investing
  • Harmonic Chart Patterns
  • Algo Trading
  • Elliot Wave Theory
  • Advanced Excel
  • Cryptocurrency
  • NSE Certification Course
  • Webinars:
  • Bank Nifty Scalping
  • Intraday Trading Strategies
  • Options Trading Strategies
  • Options selling
  • Price Action
  • Relative Strength
  • Tax Planning
  • Options Buying
  • Growth Stocks
  • Portfolio Management
  • Risk Management
  • Renko Charts
  • Crude Oil
  • Traders Psychology
  • Moving Average
  • Multibagger Stocks
  • Free Learning Modules:
  • Intraday Trading
  • Options Scalping
  • Swing Trading
  • Financial Modelling
  • RSI Indicator
  • Bollinger Bands
  • Pricing of Futures
  • Personal Finance
  • Initial Public Offerings (IPO)
  • Value Investing
  • Technical Indicators
  • Candlesticks
  • Chart Patterns
  • Option Greeks
  • ELSS Funds
  • Banking and Insurance
  • Real Estate
  • Gold
  • Book Summaries:
  • Rich Dad Poor Dad
  • Psychology of Money
  • The Intelligent Investor
  • The Richest Man in Babylon
  • Think and Trade Like a Champion
  • Value Investing and Behavioural Finance
  • Trading in the Zone
  • Learn to Earn
  • Book Summaries:
  • Rich Dad Poor Dad
  • Psychology of Money
  • The Intelligent Investor
  • The Richest Man in Babylon
  • Think and Trade Like a Champion
  • Value Investing and Behavioural Finance
  • Trading in the Zone
  • Learn to Earn
  • Tools:
  • CAGR Calculator
  • SIP Calculator
  • eLearnOptions
  • Future Value Calculator
  • Present Value Calculator
  • Atal Pension Yojana
  • Cost of Delay Calculator
  • Become a Crorepati
  • Tools:
  • CAGR Calculator
  • SIP Calculator
  • eLearnOptions
  • Future Value Calculator
  • Present Value Calculator
  • Atal Pension Yojana
  • Cost of Delay Calculator
  • Become a Crorepati

© 2025 Elearnmarkets. All Rights Reserved

  • Visit Elearnmarkets
  • Courses
  • Webinars
  • Financial Guides
  • Get Free Counselling
  • Visit Elearnmarkets
  • Courses
  • Webinars
  • Financial Guides
  • Get Free Counselling

Download Our App

Deliver breaking news, insightful commentary, and exclusive reports. Targeting readers who rely on our platform to stay ahead.

Contact Benzinga
No Result
View All Result
  • Article Categories
    • Basic Finance
    • Derivatives
    • Financial Planning
    • Fundamental Analysis
    • Technical Analysis
    • ETFs & Mutual Funds
    • Marketshala
    • Miscellaneous
  • Language
    • Hindi
    • Bengali
    • English
  • Courses
  • Webinars
  • Stories
Get Free Course

© 2024 Elearnmarkets All Rights Reserved

Guide to Basics of Stock Investing
Learn to interpret the financial performance and health of a company.
Download Guide For FREE