Have you ever looked at the stock market and noticed some stocks suddenly stopped trading? Stock exchanges set price ceilings to control sharp price changes, and these limits are often referred to as upper circuit and lower circuit.
These boundaries protect investors from sudden and sharp price swings due to unforeseen events or changes in public opinion. Circuits protect investors and offer valuable insights into a stock’s supply, demand, and market mood.
Let’s explore what the upper circuit and lower circuit mean, why they happen, and how you can use them to your advantage.
Upper Circuit in Stock Market
A stock’s daily maximum price is known as the upper circuit. This means that a stock has reached its peak price for the day once it reaches the upper circuit, and purchase orders are no longer accepted until the following trading session or the circuit is reset. It acts as a ceiling to keep the price from rising too quickly.
Assume a stock with a 10% upper circuit closes at ₹100 today. The next day, the stock can go only up to ₹110. If buyers bid more than ₹110 due to the enormous demand, the stock will hit the upper circuit, and trading will temporarily stop at that price.
High demand for a stock, sometimes brought on by positive news such as a company’s announcement of strong results, the launch of a new product, or favourable policy changes, causes upper circuits.
The circuit also shields the stock from wildly speculative price increases to allow the market to process the news and keep prices from going crazy,
Lower Circuit in Stock Market
A lower circuit is the opposite of an upper circuit. It’s the minimum price a stock can fall in a day.
Once a stock hits the lower circuit, no more sell orders are executed till the circuit is removed. A lower circuit happens when there’s too much selling, often due to bad news, poor earnings, or market panic.
For example, if a stock is at ₹100 and has a 10% lower circuit, the stock cannot fall below ₹90 for the day. If sellers try to push the stock down further, it will hit the lower circuit and freeze the price.
A lower circuit is a significant change in sentiment. It happens when a company is in trouble – product recall, bad earnings, regulatory issues. It could also be a broader market or political issue that creates fear. While lower circuits protect investors from panicking, it also means the stock is in trouble.
Circuit in the Nifty 50 Index
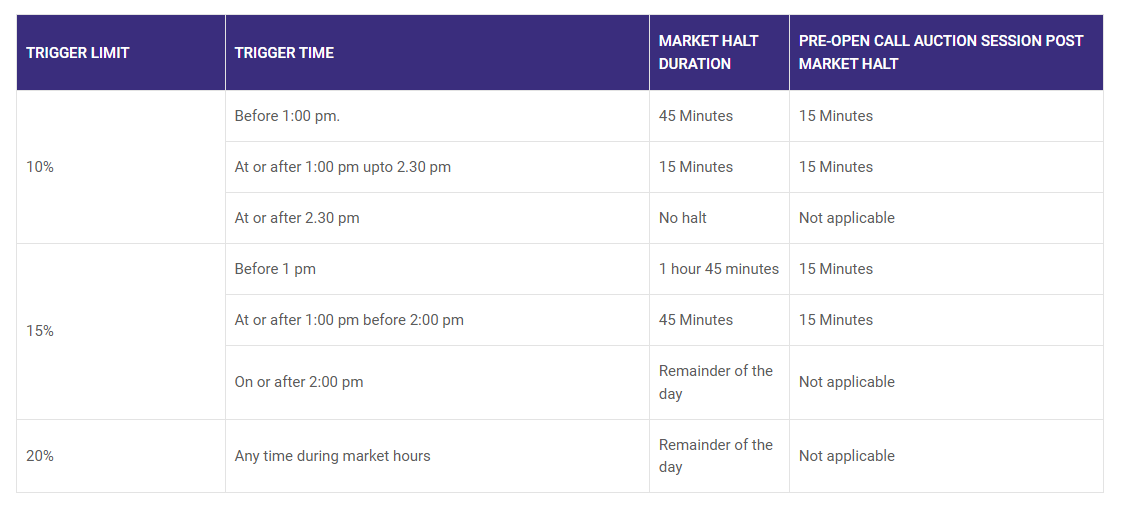
To curb panic-selling, circuit breakers are activated when the Nifty 50 index reaches price movement criteria of 10%, 15%, or 20% in a single trading day. This is how they work:
10% Movement: If the breach happens before 1:00 PM, trading is halted for 45 minutes; if it happens between 1:00 and 2:30 PM, it is halted for 15 minutes; and if it happens after 2:30 PM, trading continues uninterrupted.
15% Movement: If violated before 1:00 PM, a 1 hour 45 minutes pause is imposed. If the breach happens between 1:00 and 2:00 PM, the pause is shortened to 45 minutes. Trading stops for the remainder of the day after 2:00 PM.
20% Movement: Trading is halted for the remainder of the day if the Nifty 50 swings by 20%.
The market holds a 15-minute pre-open call auction session following a trading halt. Participants can place, edit, or cancel orders during this period in a controlled setting to ensure a seamless return to trading.
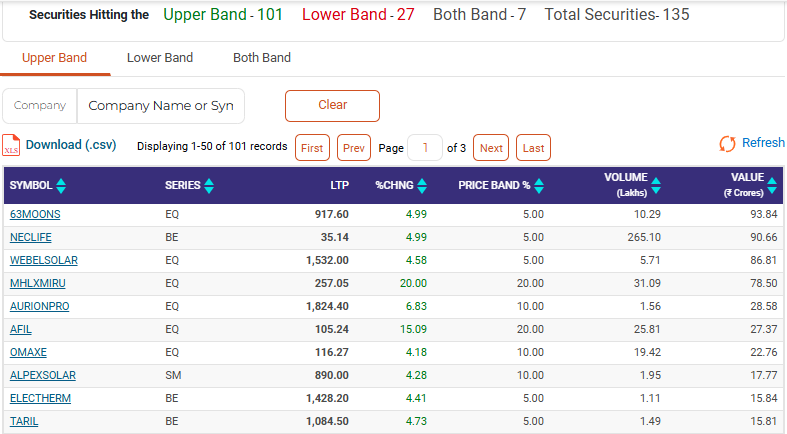
How can one check which stocks are the upper or lower circuit?
To identify stocks hitting the upper circuit or lower circuit, follow these steps:
1) Go to the NSE India Website:
Visit the NSE India homepage.
2) Access Market Data:
- Navigate to the Market Data section.
- Click on the links for Upper Band Hitters or Lower Band Hitters.
3) Explore the Stock List:
The page displays a list of stocks that have reached their circuit limits for the day, either upward or downward.
4) Review Key Information:
Each stock in the list includes:
- Stock Symbol: The identifier of the stock.
- Last Traded Price: The most recent transaction price.
- Percentage Change: The extent of price movement within the limit.
5) Use Filters for Specific Searches:
- Filter by indices (e.g., Nifty 50, Nifty Next 50).
- Explore by sectors to focus on relevant stocks.
What Drives the Upper/Lower Circuit?
Upper circuit and lower circuit are primarily driven by abrupt price changes, which are frequently caused by gaps in supply and demand. An upward circuit indicates a spike in purchasing activity, whereas a lower circuit indicates intense selling pressure.
Many factors that impact investor behaviour and stock performance, such as corporate announcements, political factors, interest rate fluctuations, and overall market mood, usually have an impact on these movements.
Here are key factors to keep an eye on:
Market Sentiment
The market’s mood significantly impacts whether price of equities move higher or lower. Stock prices will reach higher circuits if investors are confident, as they are more inclined to purchase in bulk.
Conversely, lower circuits are triggered when sellers rush the market when sentiment shifts negatively. Economic data, market trends, and geopolitical concerns are just a few examples of events that may swiftly change market mood and move equities in either direction.
Change in Interest Rates
Central banks control interest rates, which impact borrowing costs and the state of the economy. Interest rate reductions make borrowing more affordable and increase consumer spending, which can accelerate stock price growth. Certain equities could reach their upper circuits as a result.
On the other hand, a rise in interest rates makes borrowing more costly, which may cause lower circuits by slowing down economic activity and causing stock prices to drop.
Corporate Announcements
Announcements made by companies can significantly affect the price of their stocks. A major partnership, a new product launch, or better-than-expected results are examples of positive news that might increase demand for the stock and move it up the circuit.
On the other hand, the stock price may drop and hit the lower circuit due to an unsatisfactory earnings report, a scandal, or regulatory concerns.
Political Factors
Political events, whether locally, nationally, or globally, may significantly impact market conditions. Investor confidence may rise due to an economic reform or a government program that supports business, creating an upper circuit for equities in particular industries.
On the other hand, investor fear brought on by political unrest, elections, or unfavourable policy changes may result in a lower circuit as investors divest their shares.
How to Use Circuits or Price Bands on Stocks to Your Advantage?
Now that we know what upper circuit and lower circuit are and what factors influence them let’s explore how you can use them as part of your trading strategy.
- Spotting Momentum with Upper Circuits: A stock reaching its upper circuit frequently indicates high momentum driven by positive news or investor excitement. It may be a sign of more to come if you see a stock hitting its upper circuit and steadily increasing.
You may take advantage of this momentum by getting in early and riding the wave. However, use caution since when a stock achieves its upper circuit, prices can frequently become inflated. The price may then adjust itself once the news has subsided.
- Buying the Dip with Lower Circuits: A stock reaching its lower circuit often indicates a market overreaction or panic selling. This can be an excellent time to purchase the stock at a discount if you think its fundamentals are sound.
However, by learning technical analysis, you can determine if the decline is short-term or part of a longer downtrend, which can help you stay away from risky bets.
- Using Stop-Losses and Take-Profits: You can use stop-loss and take-profit orders to protect yourself against market volatility brought on by circuits.
For example, placing a stop loss order just outside the circuit while trading a stock close to its upper circuit and lower circuit in stock market will shield you if the price moves in the other direction. To lower the chance of losing earnings if the price changes later, you may also create a take-profit order to lock in profits if the stock hits a price you’re satisfied with.
- Monitor News: Always analyse the news driving the circuit. Is it a short-term reaction, or does it indicate a longer-term trend? This can help in making informed decisions.
Conclusion
Understanding the concepts of upper circuit and lower circuit can help you manage the stock market more confidently. These price bands stabilise the market and provide valuable insights into investor behaviour and overall market sentiment. By learning what influences these price movements, you’ll be better equipped to make smarter decisions and manage risk effectively.
If you’re looking to sharpen your trading skills and gain a deeper understanding of market mechanics, explore expert-led courses on Elearnmarkets which will help you in learning technical analysis through webinars, masterclasses, and self-paced programs designed to equip you with the knowledge to stay ahead in the market.
Also Read: All 35 Candlestick Chart Patterns in the Stock Market

Frequently Asked Questions
1. Is it good to buy stock at the upper circuit?
It can be tempting to purchase at the upper circuit as it shows high demand, but it also suggests that the stock may be overbought. Equities hitting higher circuits may see price corrections as soon as the initial excitement subsides, so proceed with caution.
2. What happens in lower circuit?
Trading is stopped for the day when a stock reaches its lower circuit limit to stop more drops. This method protects Investors from panic selling but can cause further volatility when trading resumes.
3. How to check the upper and lower circuits of a stock?
Most trading platforms show the price bands for stocks in real time so that you can check the upper circuit and lower circuit limits of a stock. Furthermore, exchanges such as the NSE and BSE provide circuit limit information for equities listed on their systems.


