Elearnmarkets - Financial Market Learning
  • Categories
    • Basic Finance
    • Derivatives
      • Futures
      • Options
    • Financial Planning
    • Fundamental Analysis
    • Technical Analysis
    • Marketshala
    • Miscellaneous
  • Language
    • English
    • Hindi
    • Bengali
No Result
View All Result
  • Courses
  • Webinars
  • Stories
Elearnmarkets - Learn Stock Market, trading, investing for Free
No Result
View All Result
Home Basic Finance
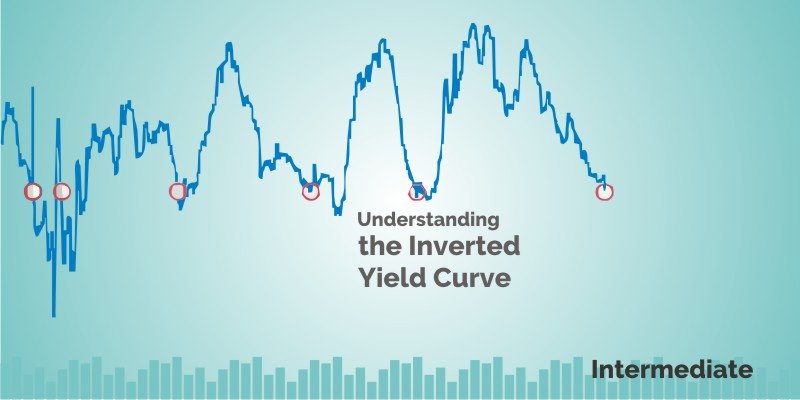
Understanding the Inverted yield curve 1

Understanding the Inverted yield curve

Elearnmarkets by Elearnmarkets
August 28, 2023
in Basic Finance, Bonds & Fixed Income
Reading Time: 6 mins read
0
934
VIEWS
Share on FacebookShare on XShare on WhatsApp

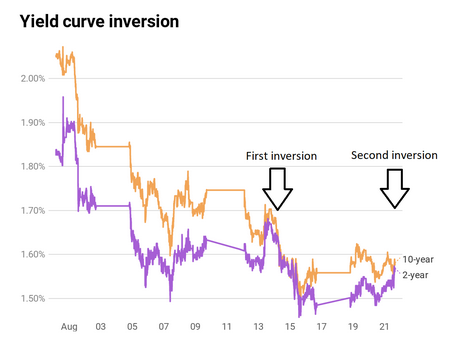
With yield on 10-year high, US Bond having fallen below 2-year bond yields for the first time since 2007, the phase “inverted yield curve” has found its way back into the media.

You must have heard and wondered what on earth were they talking about?

To understand what message a yield curve is sending, we first need to understand what bond is.

A bond is a debt instrument created for the purpose of raising capital. They are loan agreements between the bond issuer and an investor, in which the bond issuer is obligated to pay a specified amount of money at specified future date.

Bond is also known as fixed-income security.

Relationship between Stocks and Bond

Stocks and bond prices are usually inversely related that is if stocks rise bonds fall and vice versa.

When the stock market is not performing well, investors withdraw their money and put it into bonds, which they consider as safe haven.

RelatedPosts

2024 Elections-Impact on Indian Stock Market 5

2024 Elections-Impact on Indian Stock Market

December 5, 2023
609
How can we earn Rs 500 from the Stock Market daily? 6

How can we earn Rs 500 from the Stock Market daily?

December 5, 2023
157.4k
Pradhan Mantri Suraksha Bima Yojana 7

Pradhan Mantri Suraksha Bima Yojana

November 28, 2023
7.1k

The increase in demand of bonds during bear market raises bond prices.

When the stocks start rallying and the risk seems less, investors move out of bonds and shift their money into stocks, driving stock prices up further.
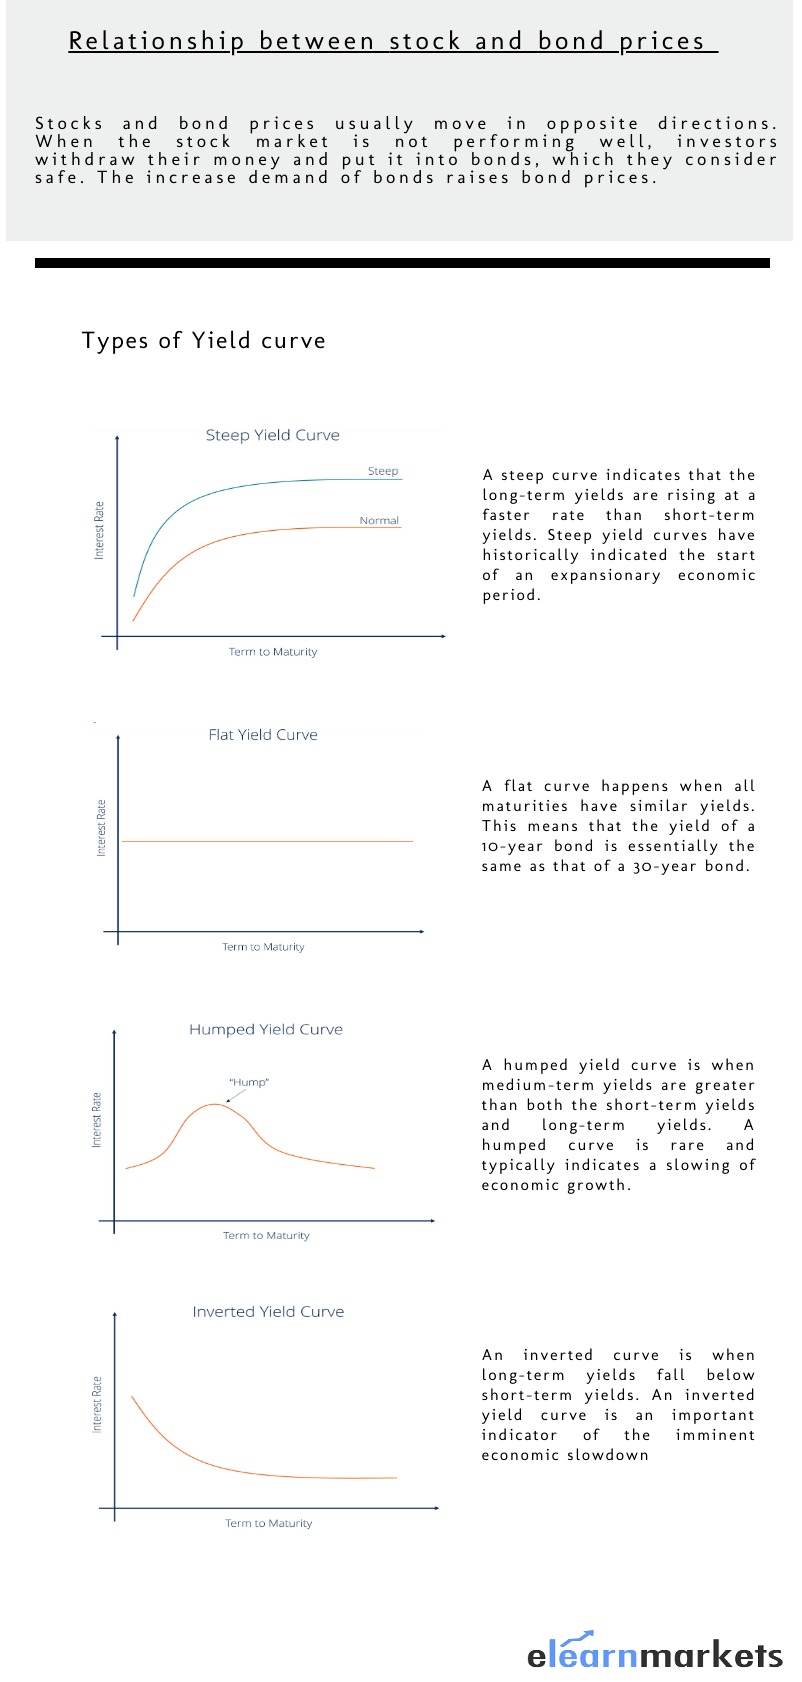
Relationship between stock and Bond prices

How do bond prices and yield behave in bull market and bear market?

A bull market is the condition of a financial market in which stock prices are continuously rising or are expected to rise.

To beat inflation and earn alpha returns, investors start selling their bonds and buy stocks.

This drives bond price lower and bond yields higher.

On the contrary:

A bear market is a condition in which stock prices fall generally 20% or more from recent highs.

Because of pessimism and negative sentiment in the market, Investors start shifting to bonds (safer assets class) to get the regular guaranteed interest payment which drives bond prices higher and bond yields lower as money moves into bond market.
Understanding the Inverted yield curve 2

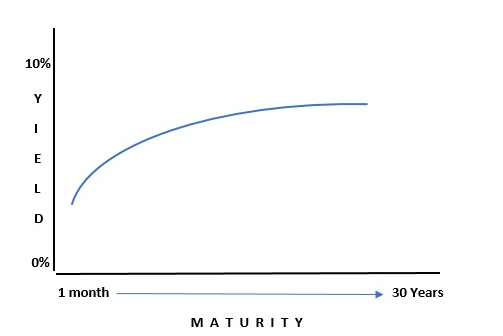
A yield curve is simply a graphical representation between a Bond’s yield (government bonds) and its range of maturities.

It shows the yield an investor is expecting to earn if he lent his money for a given period of time. (Yield refers to the interest earned by an investor on a bond till it matures)
Understanding the Inverted yield curve 3

The graph displays the bond’s yield on the vertical axis and the time to maturity across the horizontal axis.

The Government issues bonds with maturities ranging from the very short term (less than a year) to very long term (up to 30 years).

Short-term bonds typically offer lower yields because they pose relatively little risk to an investor’s money.

Longer-term bonds typically pay more to compensate the risk of inflation, liquidity and many other uncertainties.

The curve takes different shapes at different points in the economic cycle like Steep, Flat, Inverted, and Humped yield curve.

Inverted Yield curve

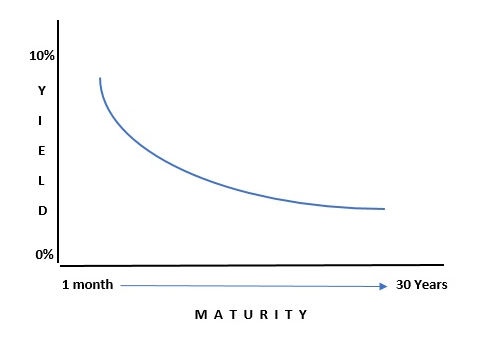
A yield curve is inverted when the yields on bonds with shorter duration are higher than the yields on the longer-dated bonds.
inverted yield curve

Why inverted yield curve happens?

The short-term bond yields are highly sensitive to the interest rate policy whereas the performance of the longer-term bonds is largely determined by market forces.

When investors are worried about growth and feel that recession is looming, they start investing in (safe assets) long-term Treasury bonds which drives longer-term bond prices higher, and pushes yield lower.

Inversely, the demand for short-term bond falls, which drives the prices to lower.

Lower prices brings higher yields.

The most commonly feared inversion arrives when a 10-year bond yield fall under a two-year bond yield. This inversion is regarded as one of the most consistent recession indicators for the economy.

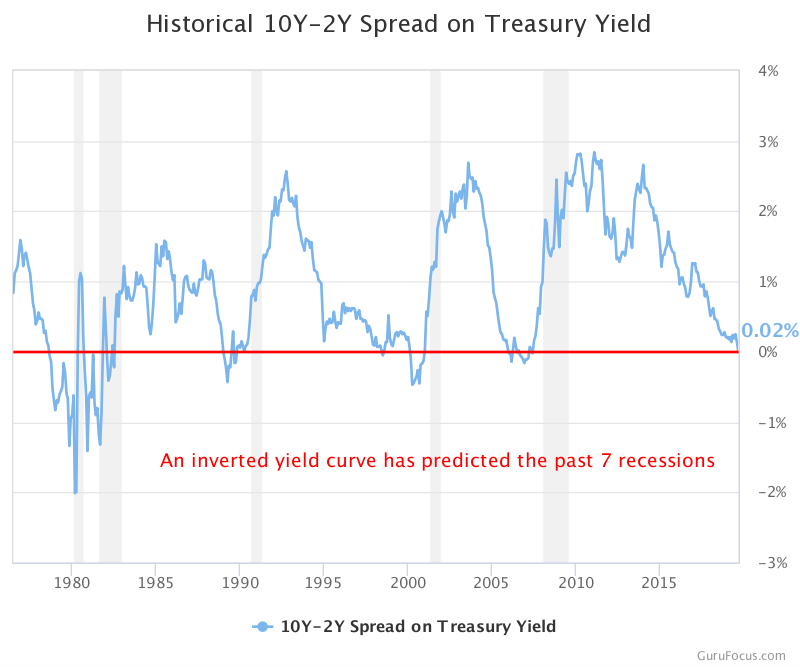
Historically, economic recessions occur when the spread between the 10-year yield and the two-year yield is less than zero.

you look carefully at the historical spread chart below, you will notice grey bars throughout the charts. These bars indicate the past U.S. recession since 1976.
Understanding the Inverted yield curve 4

What to do about an inverted yield curve?

The inverted yield does not mean that the economy will enter into a recession.

The inversion that took place in 1966 and 1998 were not followed by recession.

However, an inverted yield curve does strongly remind investors that recession is inevitable and that they should be careful to maintain proper asset allocation in their portfolio, rather than trying to make tactical moves in anticipation of the market downturn.

Key- takeaways

  • The yield curve is often viewed as a leading indicator. It provides an early warning of the direction of the economy.

  • Inverted Yield curve don’t come very often. But when they do come, they tend to send investors and policy makers into a worry.

  • The 10-2-year US Treasury spread has a general tendency to signal the market’s expectation of an upcoming recession or general downturn in growth.

  • An inverted yield curve, like most other indicators, is not perfect and doesn’t mean a recession is imminent.

In order to get the latest updates on Financial Markets visit Stockedge

Tags: bondsintermediate
Share1TweetSend
Get Kotak Offer Get Kotak Offer Get Kotak Offer
Previous Post

Follow 50/30/20 Rule – A perfect way to start Savings

Next Post

Capital Asset Pricing Model (CAPM) – Calculation, Advantages, Problems

Elearnmarkets

Elearnmarkets

Elearnmarkets (ELM) is a complete financial market portal where the market experts have taken the onus to spread financial education. ELM constantly experiments with new education methodologies and technologies to make financial education effective, affordable and accessible to all. You can connect with us on Twitter @elearnmarkets.

Related Posts

2024 Elections-Impact on Indian Stock Market 8
Basic Finance

2024 Elections-Impact on Indian Stock Market

December 5, 2023
609
How can we earn Rs 500 from the Stock Market daily? 9
Basic Finance

How can we earn Rs 500 from the Stock Market daily?

December 5, 2023
157.4k
Pradhan Mantri Suraksha Bima Yojana 10
Basic Finance

Pradhan Mantri Suraksha Bima Yojana

November 28, 2023
7.1k
What is the Right Time For Teenagers to Start Investing? 11
Basic Finance

What is the Right Time For Teenagers to Start Investing?

November 28, 2023
710

Leave a Reply Cancel reply

Your email address will not be published. Required fields are marked *

Elearnmarkets Logo

Follow Us

Facebook-f Twitter Instagram Linkedin-in Youtube Telegram

Register on Elearnmarkets

Continue your financial learning by creating your own account on Elearnmarkets.com

Register Free Account

Download App

Playstore logo
Download on app store

Categories

  • Basic Finance
  • Derivatives
  • Financial Planning
  • Fundamental Analysis
  • Technical Analysis
  • Marketshala
  • Miscellaneous

Popular On Elearnmarkets

  • Market Superheroes:
  • Vivek Bajaj
  • Chetan Panchamia
  • Ashish Kyal
  • Premal Parekh
  • Abhijit Paul
  • Jegan
  • Sivakumar Jayachadran
  • Vishal Malkan
  • Jyoti Budhia
  • Vivek Gadodia
  • Vishal Mehta
  • Piyush Chaudhry
  • Santosh Pasi
  • Gomathi Shankar
  • Market Superheroes:
  • Vivek Bajaj
  • Chetan Panchamia
  • Ashish Kyal
  • Premal Parekh
  • Abhijit Paul
  • Jegan
  • Sivakumar Jayachadran
  • Vishal Malkan
  • Jyoti Budhia
  • Vivek Gadodia
  • Vishal Mehta
  • Piyush Chaudhry
  • Santosh Pasi
  • Gomathi Shankar
  • Courses:​
  • Options Trading
  • Dow Theory
  • Momentum Trading
  • Stock Investing
  • Stock Market for Beginners
  • Harmonic Chart Patterns
  • Algo Trading
  • Elliot Wave Theory
  • Advanced Excel
  • Cryptocurrency
  • NSE Certification Course
  • Courses:​
  • Options Trading
  • Dow Theory
  • Momentum Trading
  • Stock Investing
  • Stock Market for Beginners
  • Harmonic Chart Patterns
  • Algo Trading
  • Elliot Wave Theory
  • Advanced Excel
  • Cryptocurrency
  • NSE Certification Course
  • Webinars:
  • Bank Nifty Scalping
  • Intraday Trading Strategies
  • Options Trading Strategies
  • Options selling
  • Price Action
  • Relative Strength
  • Tax Planning
  • Options Buying
  • Growth Stocks
  • Portfolio Management
  • Relative Strength Index
  • Risk Management
  • Renko Charts
  • Crude Oil
  • Traders Psychology
  • Moving Average
  • Multibagger Stocks
  • Free Learning Modules:
  • Intraday Trading
  • Options Scalping
  • Swing Trading
  • Financial Modelling
  • RSI Indicator
  • Bollinger Bands
  • Pricing of Futures
  • Personal Finance
  • Initial Public Offerings (IPO)
  • Value Investing
  • Technical Indicators
  • Candlesticks
  • Chart Patterns
  • Option Greeks
  • ELSS Funds
  • Banking and Insurance
  • Real Estate
  • Gold
  • Book Summaries:
  • Rich Dad Poor Dad
  • Psychology of Money
  • The Intelligent Investor
  • The Richest Man in Babylon
  • Think and Trade Like a Champion
  • Value Investing and Behavioural Finance
  • Trading in the Zone
  • Learn to Earn
  • Book Summaries:
  • Rich Dad Poor Dad
  • Psychology of Money
  • The Intelligent Investor
  • The Richest Man in Babylon
  • Think and Trade Like a Champion
  • Value Investing and Behavioural Finance
  • Trading in the Zone
  • Learn to Earn
  • Tools:
  • CAGR Calculator
  • SIP Calculator
  • eLearnOptions
  • Future Value Calculator
  • Present Value Calculator
  • Atal Pension Yojana
  • Cost of Delay Calculator
  • Become a Crorepati
  • Tools:
  • CAGR Calculator
  • SIP Calculator
  • eLearnOptions
  • Future Value Calculator
  • Present Value Calculator
  • Atal Pension Yojana
  • Cost of Delay Calculator
  • Become a Crorepati

© 2023 Elearnmarkets. All Rights Reserved

  • Visit Elearnmarkets
  • Courses
  • Webinars
  • Financial Guides
  • Get Free Counselling
  • Visit Elearnmarkets
  • Courses
  • Webinars
  • Financial Guides
  • Get Free Counselling

Get Elearnmarkets App

No Result
View All Result
  • Article Categories
    • Basic Finance
    • Derivatives
    • Financial Planning
    • Fundamental Analysis
    • Technical Analysis
    • Marketshala
    • Miscellaneous
  • Language
    • Hindi
    • Bengali
    • English
  • Courses
  • Webinars
  • Stories

© 2020 Elearnmarkets All Rights Reserved

Guide to Basics of Stock Investing
Learn to interpret the financial performance and health of a company.
Download Now
Guidebook on Savings and Investment
A comprehensive guide book to start your investment journey
Download Now
Maximum Mentorship
Maximum Mentorship - Trading Mentorship Program