Key Takeaways
- Sentiment Indicator: The Put-Call Ratio (PCR) helps traders understand whether the market is showing a bullish or bearish bias based on options activity.
- Two Calculation Methods: PCR can be computed using open interest or trading volume, both revealing how puts and calls are being built up in the market.
- How to Read PCR: A PCR above 1 signals stronger bearish sentiment, while a PCR below 1 reflects bullish expectations. Around 0.7 is often seen as the average level for equities.
- Acts as Contrarian Tool: Extremely high or low PCR values can indicate potential trend reversals, helping traders avoid following the herd blindly.
- Works Best with Other Indicators: PCR alone isn’t enough; it should be used along with other market indicators and risk management practices for better trading decisions.
Investors use a variety of financial indicators to assess the market’s mood before putting their money into it. The put-call ratio is one such financial tool that benefits investors in multiple ways.
To understand the application and role of this financial measurement, one must first understand its fundamentals. We’ve reviewed the specifics, including the put-call ratio formula and other information.
What is Put Call Ratio?
A put-call ratio is typically used as a derivative indicator. It is intended to help traders effectively determine the sentiment of the options market. This ratio is calculated by taking the open interest for a given period and dividing it by the volume of options trading.
This particular ratio, also known as PCR, serves as a contrarian indicator and is primarily concerned with option build-up. This type of indicator aids in determining the market’s bullish or bearish influence.
In other words, it assists traders in determining whether a recent market increase or decrease is excessive. Traders decide whether to take a contrarian call in the current market based on this information.
To combat mispricing in the securities market, such an investment strategy is based on the practice of purchasing or selling investment units in response to market conditions.
How to Calculate Put-Call Ratio?
It is critical to understand the components of the put-call ratio formula before learning about the formula.
For example, the put option gives traders the right to buy assets at predetermined prices, whereas the call option gives traders the right to buy assets at current market prices.
The put-call ratio can be calculated in the following ways:
1. Open Interest
PCR is calculated by dividing open interest in a put contract on a given day by open interest in a call contract on the same day.
PCR (OI) = Put Open Interest/ Call Open Interest
2. The volume of Options Trading
In this case, PCR is calculated by dividing the put trading volume by the call trading volume on a given day.
PCR (Volume) = Put Trading Volume/Call Trading Volume
Here, Put volume indicates the total put options initiated over a specific time frame. Conversely, Call volume indicates the total call options initiated over a specific time-frame.
Notably, the interpretation of this said ratio differs as per the type of investor.
Example
Look at this put-call ratio example to better understand the put-call ratio calculation.
Suppose a trader intends to use the put-call ratio to gauge market sentiment toward a specific security. The following puts and calls were initiated:
Total put open interest/ Total call open interest = PCR = 1300/1700= 0.7647
Because the result is less than one, it indicates that investors are purchasing more call options than put options. It also represents that investors anticipate a bullish trend in the future.
Interpretation
Call options, on the other hand, are widely used to hedge against the market’s strong suit or simply to bet on its advances.
It should be noted that put options are useful for hedging market weaknesses or assisting traders in taking risks on market declines.
According to the put-call ratio analysis –
A PCR value greater than one indicates that the put volume has exceeded the call volume. It represents an increase in bearish sentiment.
A PCR of less than one indicates that the call volume is greater than the put volume. It portends a bullish market ahead.

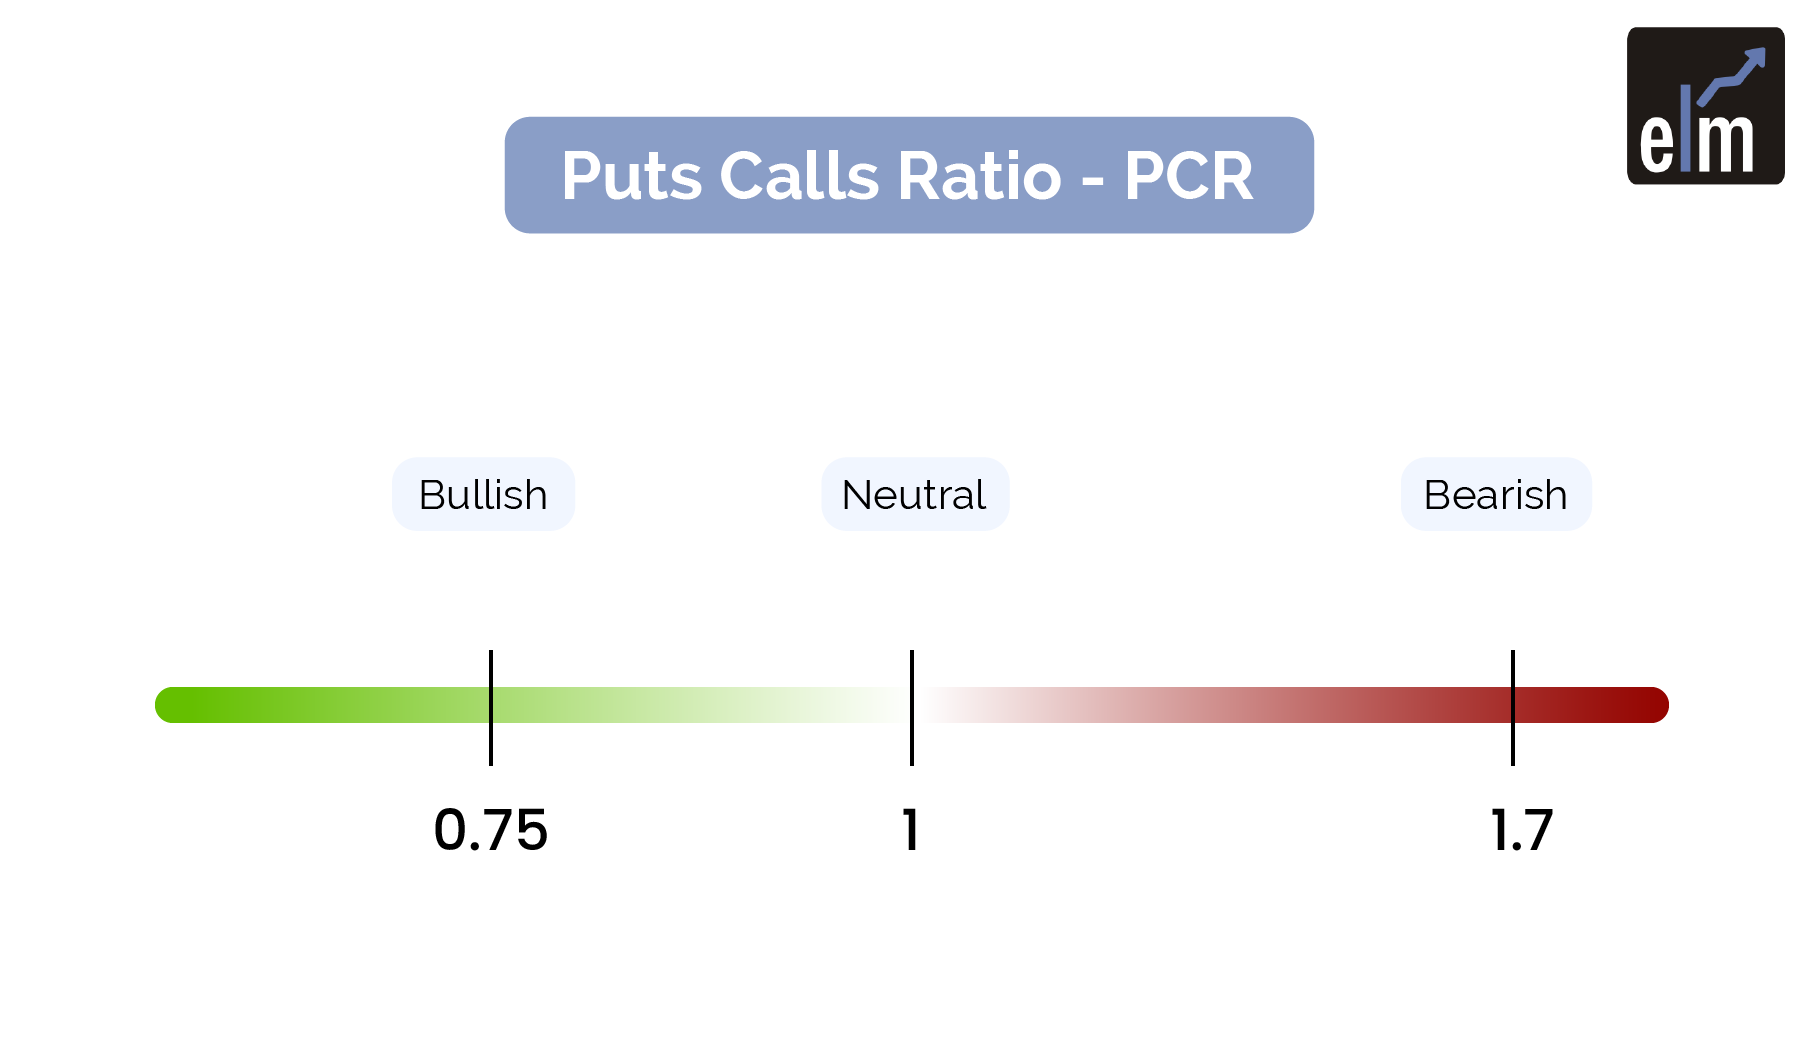
However, it should be noted that a PCR of 1 is not a reliable indicator of market sentiment. This is due to the fact that more traders buy call options than put options. As a result, an average PCR of 0.7 for equity options is deemed appropriate for assessing market sentiment.
However, a PCR greater than 0.7 or 1 indicates that more traders buy put options than call options. As bearish sentiment grows, more investors hedge their portfolios against sell-offs or speculate on a falling market. A falling put-call ratio between 0.7 and 0.5, on the other hand, indicates bullish tendencies.
Importance
In brief, the following pointers highlight the significance of PCR –
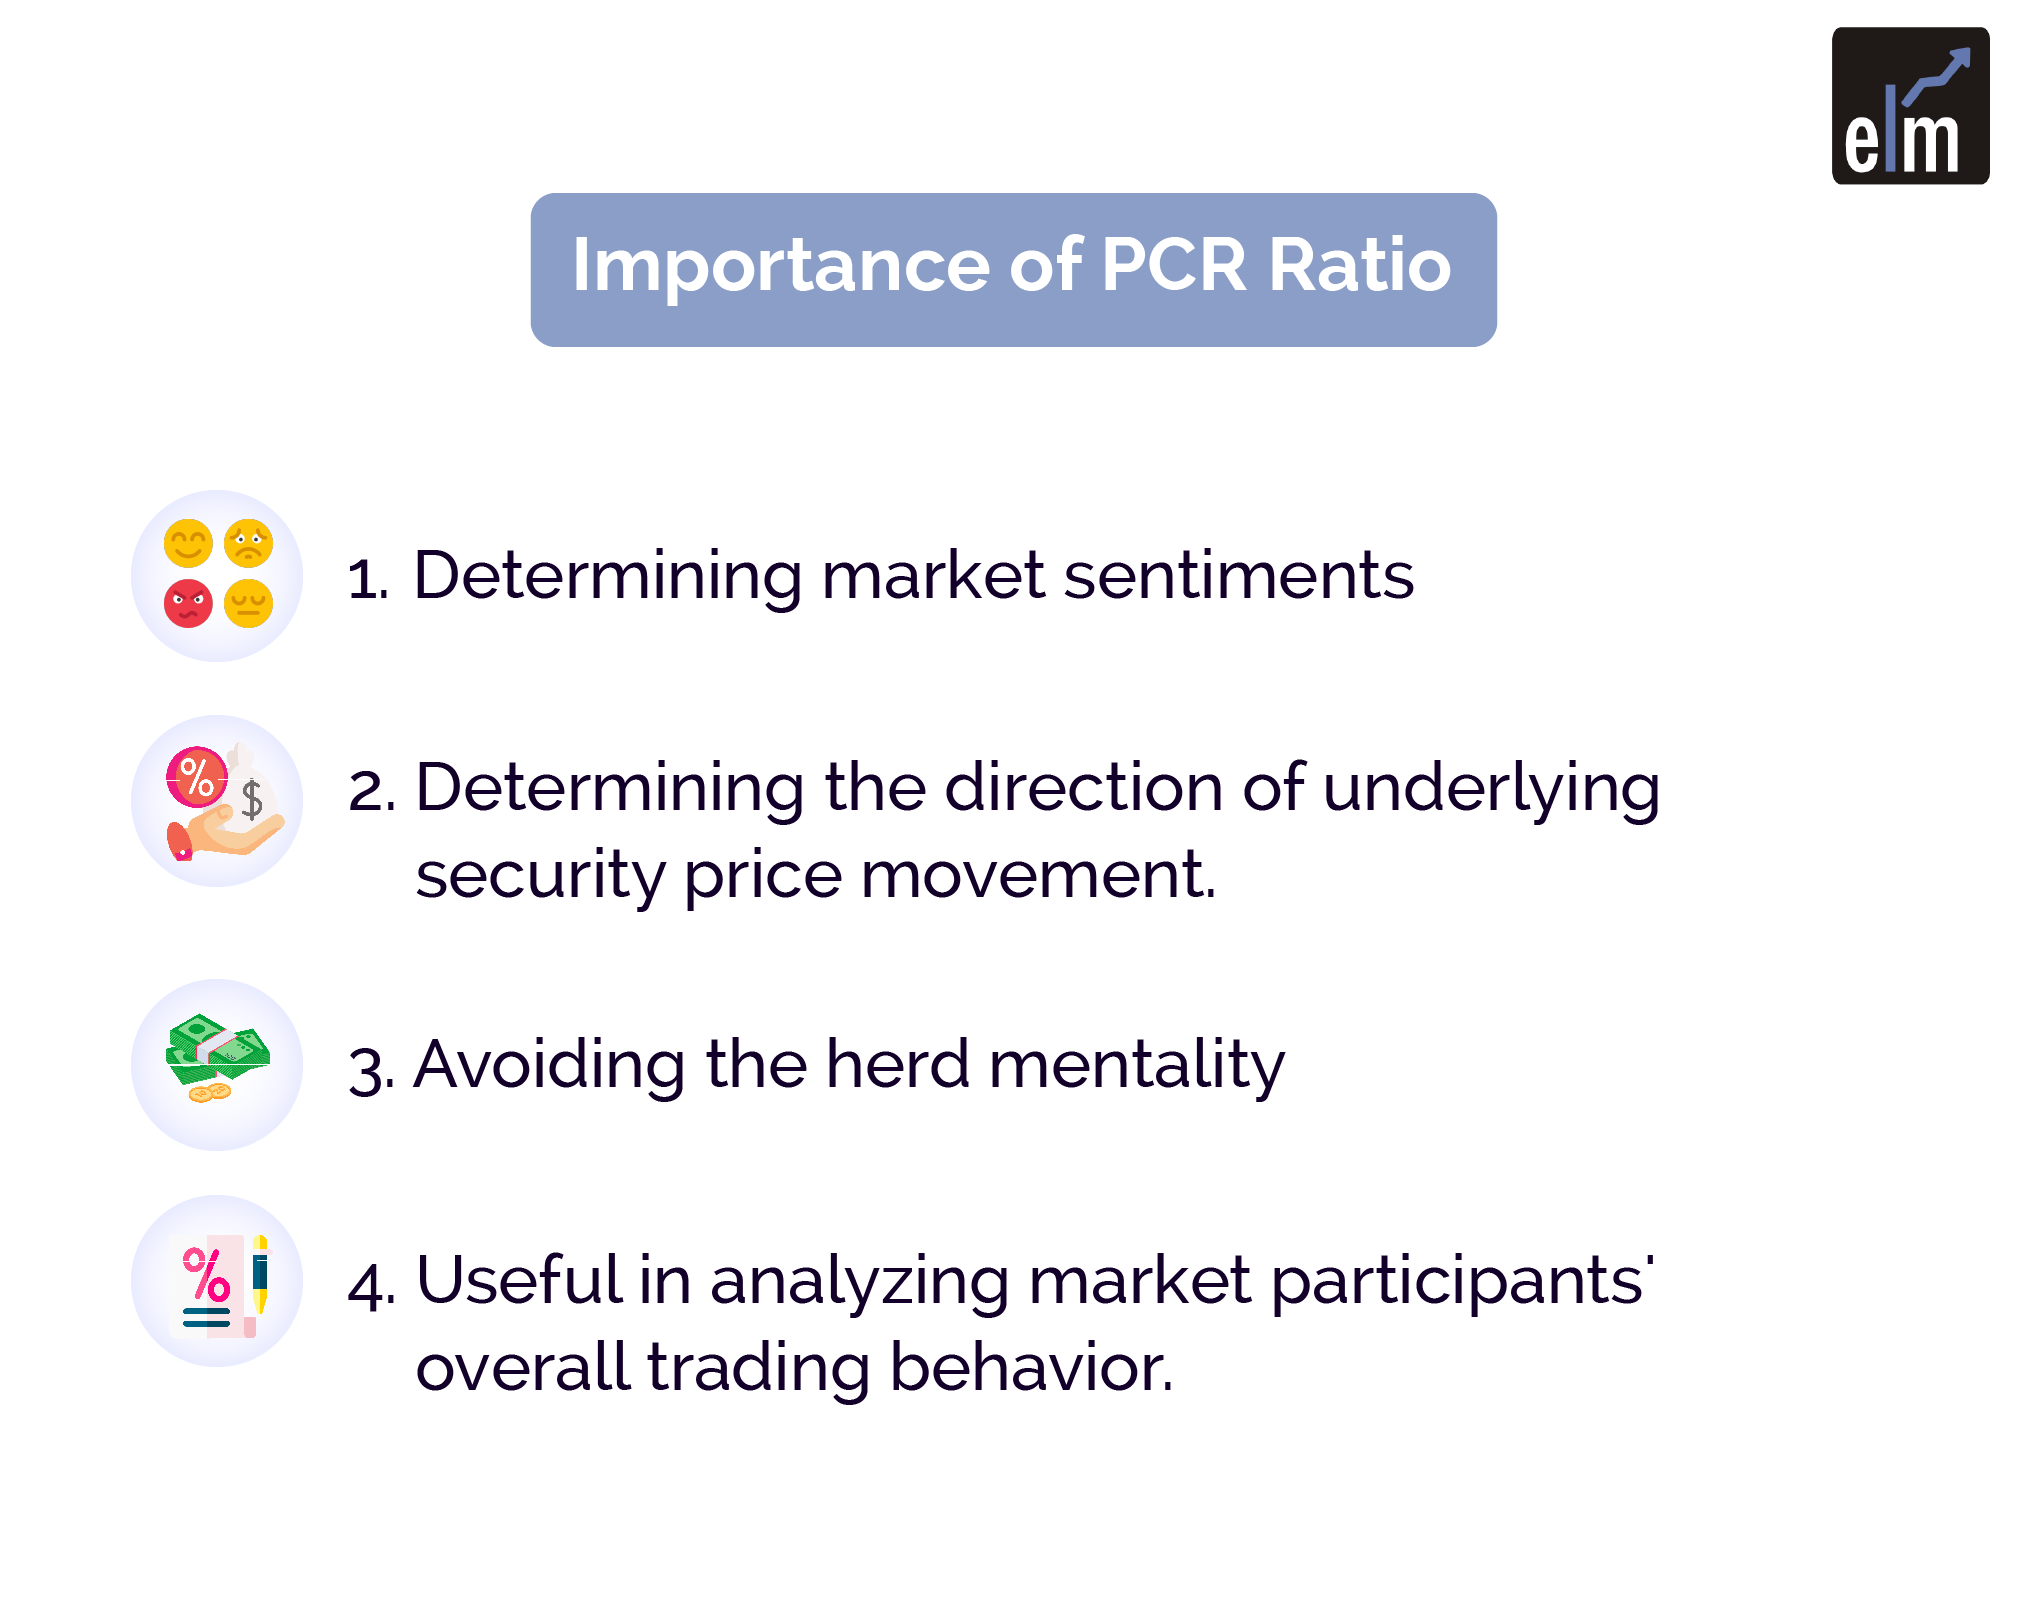
- It is an effective tool for determining market sentiment at any given time.
- PCR assists traders in determining the direction of underlying security price movement. As a result, they can organize directional bets on orders.
- It is essentially a contrarian indicator, and as such, it assists traders in avoiding the herd mentality when investing in a given market.
- This ratio is useful in analyzing market participants’ overall trading behavior.
You can also do our course on Certification In Online Options Strategies
Limitation
One of the most serious shortcomings of PCR is that it only sometimes accurately reflects market sentiments.
This ratio’s other limitations include market participants-
- Many company stocks do not provide options. This makes calculating the PCR for most stocks impossible.
- Even though it is a contrarian indicator, investors should consider other important factors before betting on current market sentiments.
- To achieve effective results, PCR must be used in conjunction with other powerful indicators.
- Investors must understand how to read the put-call ratio chart correctly, as even minor changes serve as an important indicator of possible market movement.
To make the most of this derivative indicator, investors should understand where to find the PCR ratio of a specific stock and how to use it to make an informed decision.
Aside from these, investors must consider their risk tolerance and financial objectives before betting on market sentiments against security.
Bottomline
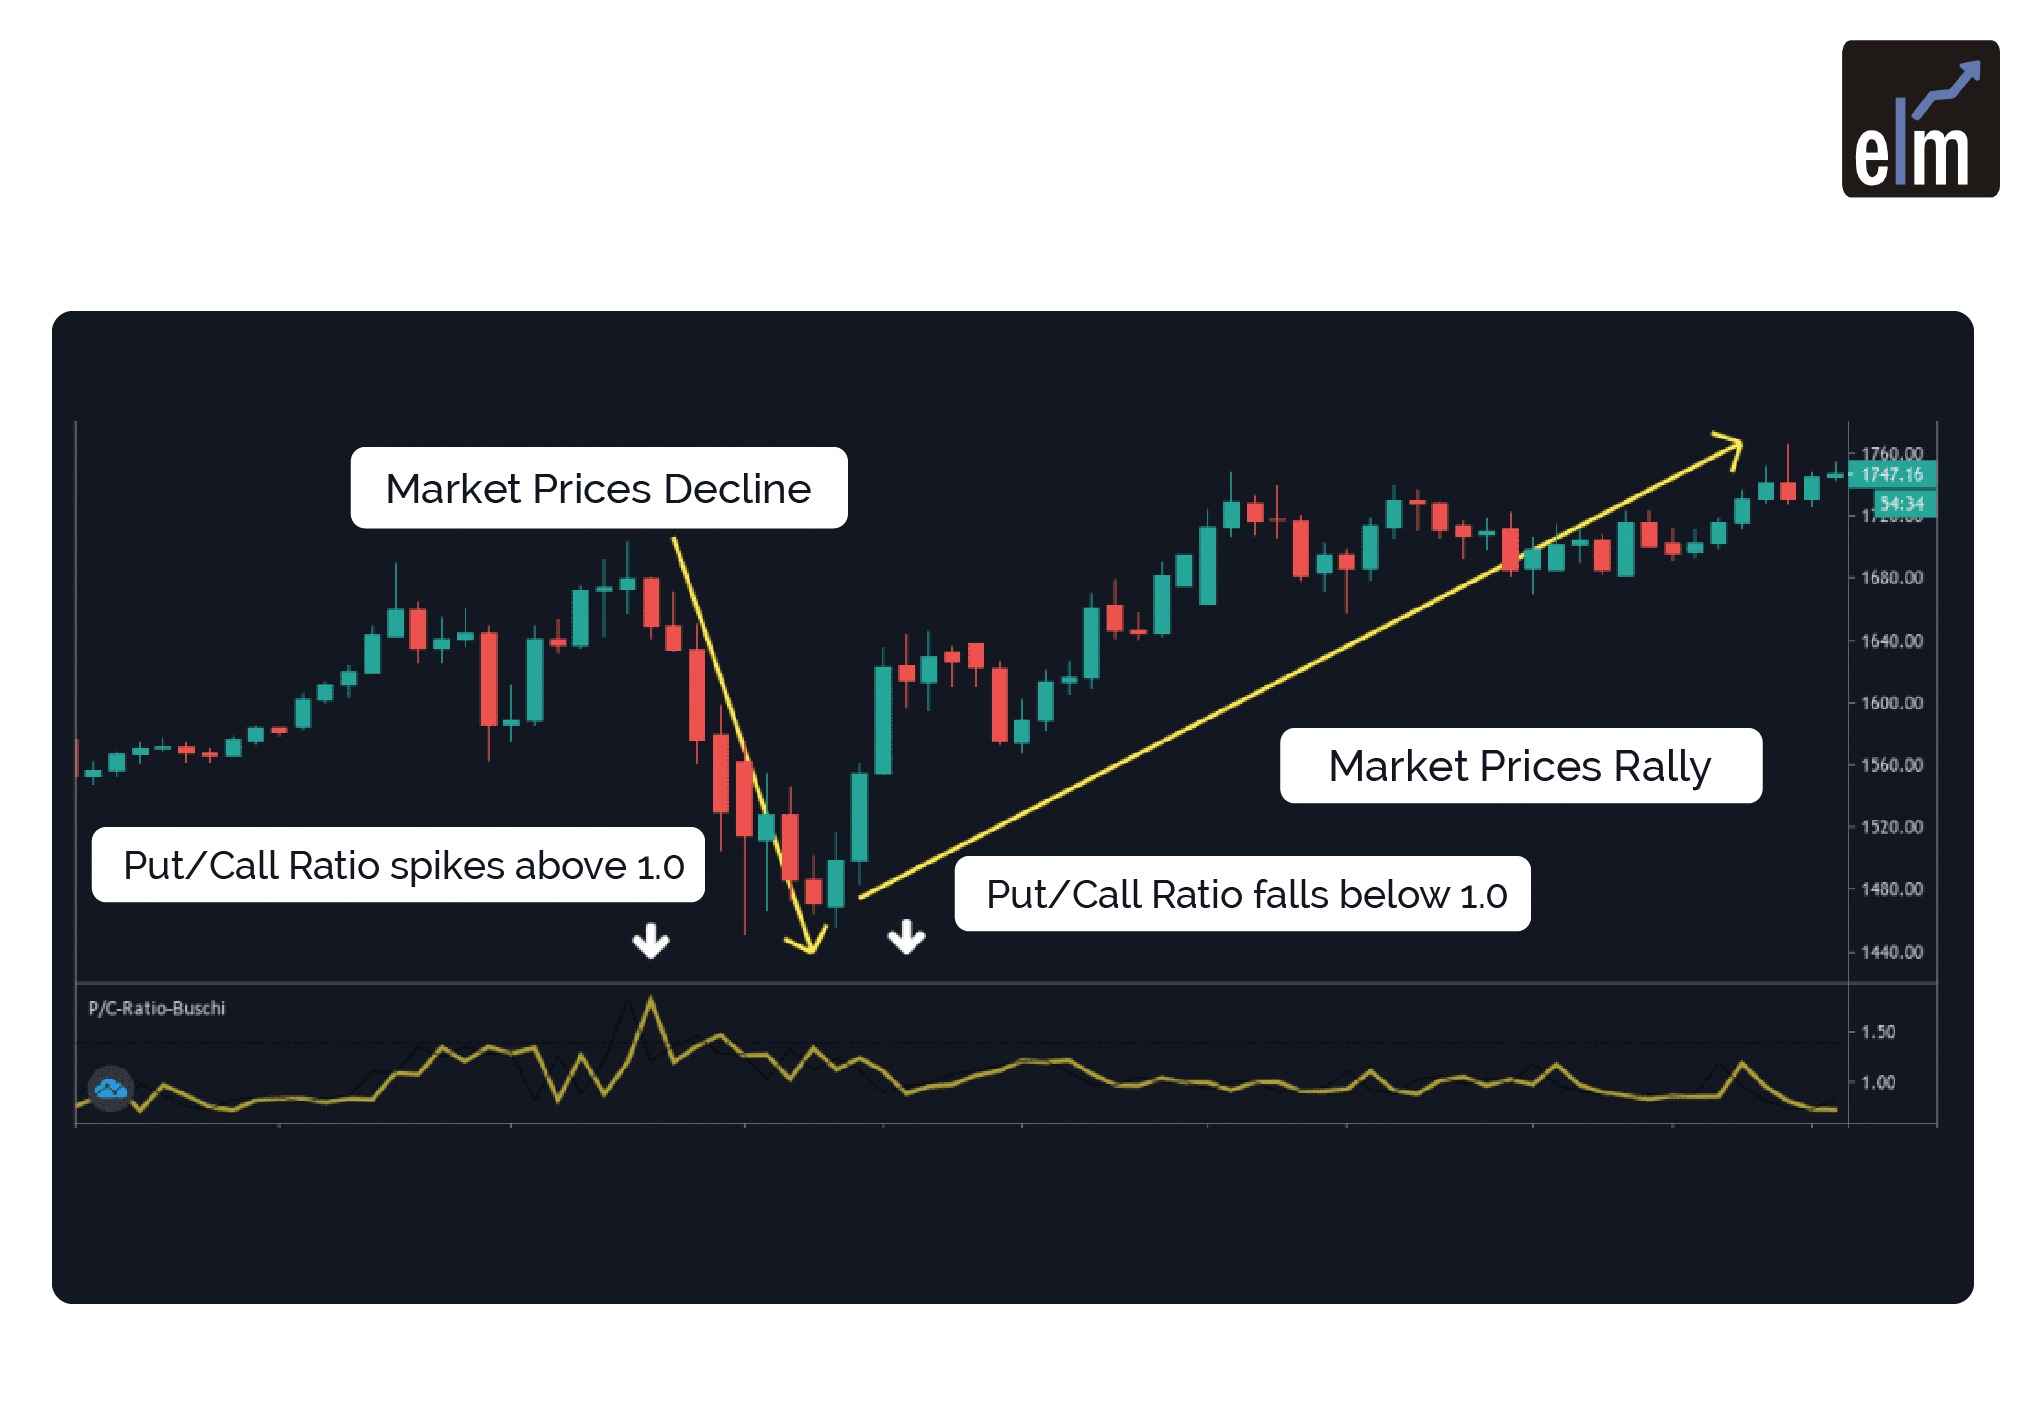
When the Put Call Ratio (PCR) reaches extremely high levels, traders use it as a contrarian indicator.
This means that traders may view a high Put Call ratio of, say, 1.4 as a great opportunity to buy because they believe the market sentiment is extremely bearish and will soon adjust when those with short positions switch positions to cover, and the market will eventually face a downturn.
We hope you found this blog informative and use the information to its maximum potential in the practical world.
If you wish to dive deeper into the world of derivatives, join our derivatives online course and enhance your knowledge.
Also, show some love by sharing this blog with your family and friends and helping us spread financial literacy.
Happy Investing!
In order to get the latest updates about Financial Markets visit StockEdge


