Are you planning to do a fundamental analysis of the companies in which you wish to invest in? but before that, you need to check the turnover ratios that will help you in analyzing how efficiently the company is utilizing its assets for generating income.
The turnover ratios are used for checking the company’s efficiency and how it uses its assets for earning revenue.
It compares the sales figures with the different assets for measuring how much of the assets are used for generating the number of sales.
In a business, many types of assets are required that are used for generating the revenue of the business so that the business can operate.
These ratios come under efficiency ratios as they help in measuring how a company is utilizing its different assets for achieving its revenue.
So when doing a fundamental analysis of the company in which you are planning to invest, check the below ratios for analyzing the company’s efficiency.
What are Turnover Ratios?
This ratio shows how much is the amount of assets or liabilities that a company is replacing in relation to its sales.
This concept is useful to determine the business efficiency with which it is utilizing its assets.
Generally, a high asset turnover ratio is considered good, as it shows that receivables are quickly collected and only a little excess inventory is kept on hand.
This shows that there is minimal need for invested funds and thus results in a high return on investment.
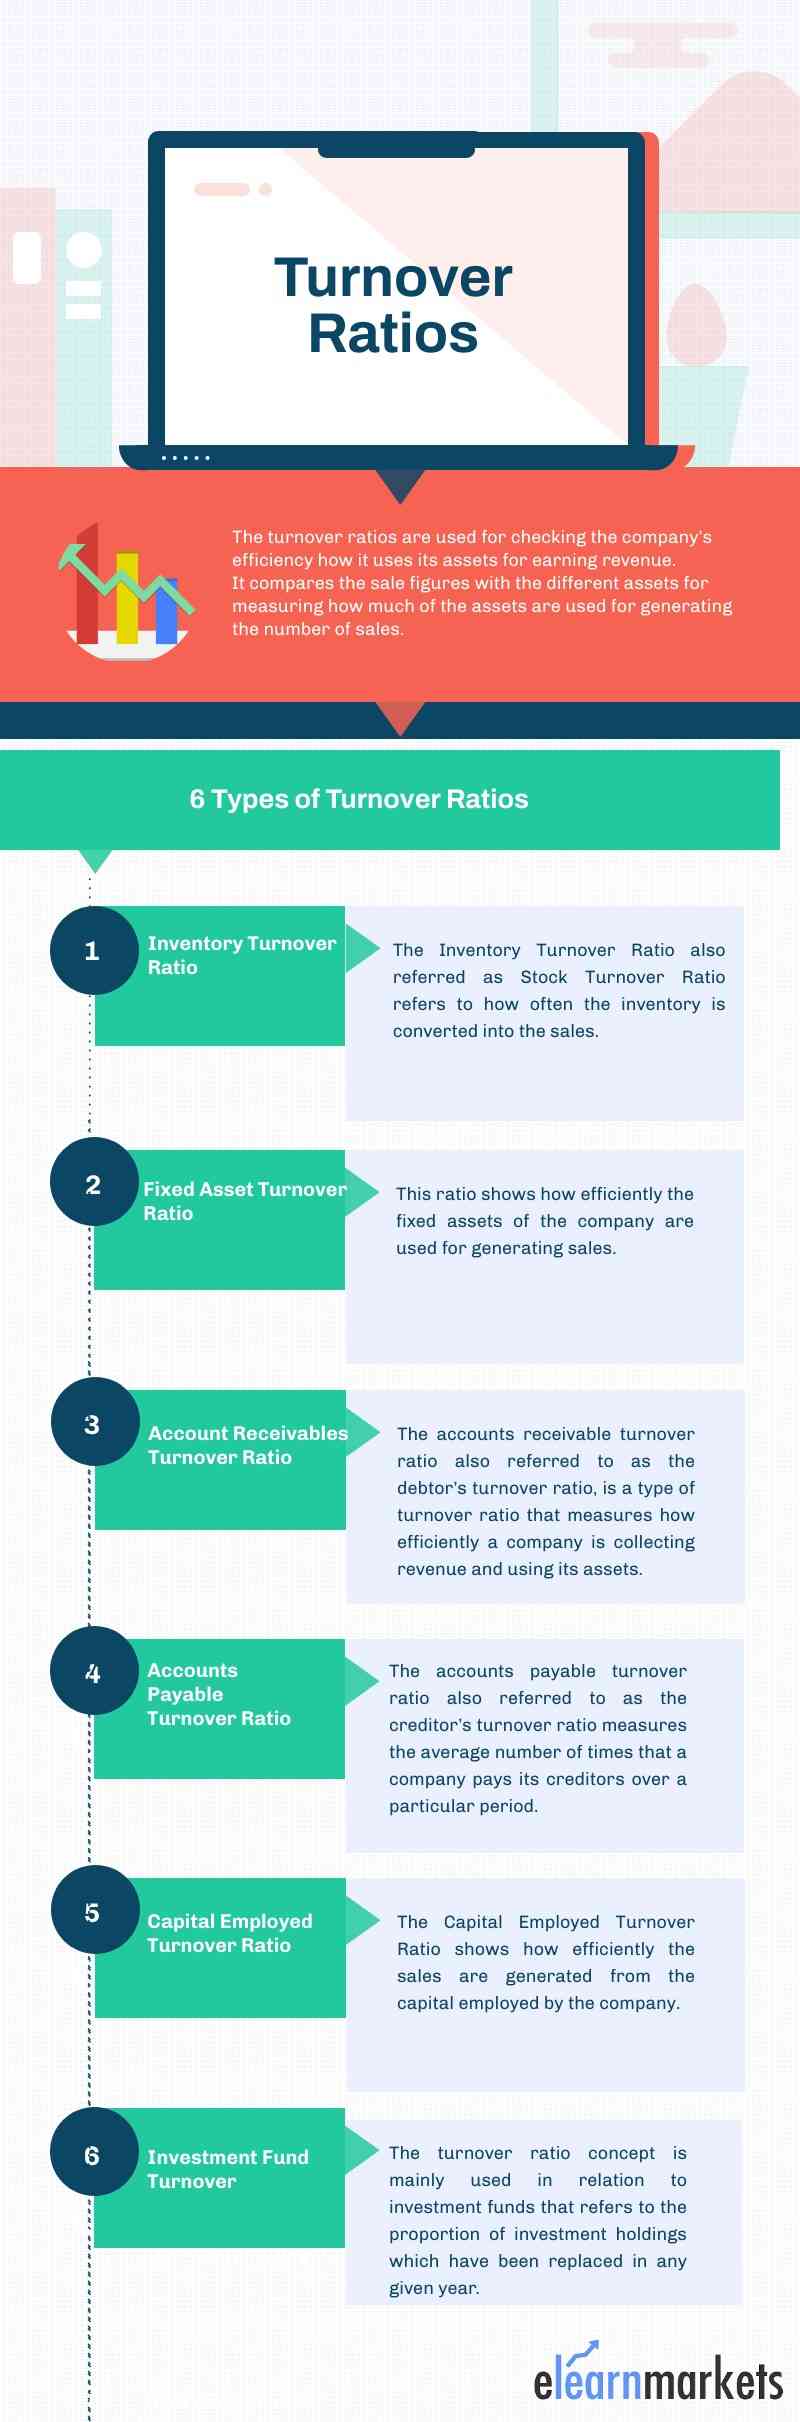
1. Inventory Turnover Ratio:
The Inventory Turnover Ratio refers to how often the inventory is converted into sales.
In simple terms this metric measures the firm’s capacity for generating revenues from the sale of its inventory.
The formula for calculating this ratio is:
Inventory Turnover Ratio= Cost of goods sold/ Average inventory
A high ratio is better as it ensures timely delivery of products to the customers.
2. Fixed Asset Turnover Ratio:
This ratio shows how efficiently the fixed assets of the company are used for generating sales.
This ratio is suitable for heavy industries where a huge amount of capital is employed in investments like manufacturing. Thus, the ratio is also used for comparing the companies within the specific industries.
The formula for calculating this ratio is:
Fixed Assets Turnover Ratio = Net Sales/ Gross Fixed Assets – Accumulated Depreciation
One should note that the higher the ratio, the better its fixed assets are utilized which means that a company can generate sales with minimum fixed assets without raising any extra capital.

3. Accounts Receivable Turnover Ratio:
The accounts receivable turnover ratio measures how efficiently a company is collecting revenue and using its assets.
This ratio measures the average number of times that a company collects its average accounts receivable over a particular period.
The formula for calculating this ratio is:
Accounts Receivable Turnover Ratio = Net Credit Sales / Average Accounts Receivable
Where:
Net credit sales are sales where the cash is collected at a later date. The formula for net credit sales is = Sales on credit – Sales returns – Sales allowances.
Average accounts receivable is the sum of starting and ending accounts receivable over a time period (such as monthly or quarterly), divided by 2.
Generally, a high ratio is desirable, as it shows that the company’s collection of accounts receivable is frequent and more efficient.
4. Accounts Payable Turnover Ratio:
The accounts payable turnover ratio also referred to as the creditors turnover ratio measures the average number of times that a company pays its creditors over a particular period.
This ratio measures short-term liquidity and a higher payable turnover ratio is considered to be favorable.
The formula for calculating this ratio is:
Accounts Payable Turnover Ratio = Net Credit Purchases / Average Accounts Payable
In some cases, the cost of goods sold (COGS) is used in the numerator in place of net credit purchases. Average accounts payable is the sum of accounts payable at the beginning and end of an accounting period, divided by 2.
5. Capital Employed Turnover Ratio:
This ratio shows how efficiently the sales are generated from the capital employed by the company.
This ratio helps the investors in determining the firm’s ability to generate revenues from the capital employed and also acts as an important decision factor for lending more money to the firm.
The formula to compute this ratio is:
Capital Employed Turnover Ratio = Net Sales/ Capital Employed
Generally, the higher ratio is considered as good as it shows the utilization of capital employed and the ability of the firm for generating maximum profits with the minimum amount of capital that is employed.
Understand more about Ratio Analysis by attending our webinar on RATIO TRADING – A MINT MACHINE
6. Investment Fund Turnover:
This ratio is mainly used in relation to investment funds that refer to the proportion of investment holdings that have been replaced in any given year.
A low ratio means that the fund manager is not incurring many brokerage transaction fees for selling or buying securities.
The turnover level for a fund depends on the investment strategy of the fund manager.
Thus a fund manager who follows a buy-and-hold manager will have a low ratio, whereas a manager with a more active strategy will experience a high ratio and must generate greater returns for offsetting the increased transaction fees.
Where to check the above Turnover ratios of a company?
The investor can check the above ratios of any company in which they want to invest for the long-term using StockEdge.
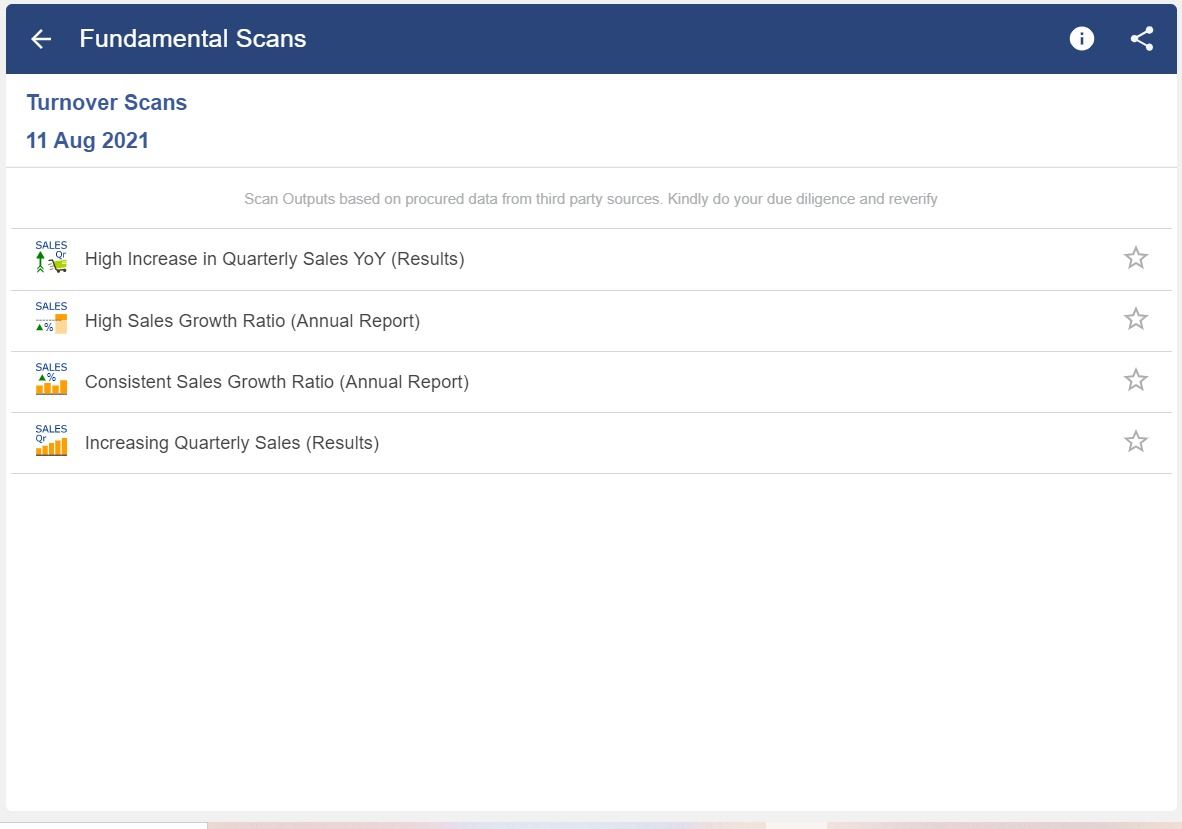
StockEdge has fundamental scans which filter out the companies that are financially sound for long-term investing.
Bottom-line:
As we have discussed above, these ratios show how efficiently the company is utilizing its assets for generating income. Thus you can use the above ratios for deciding whether you should invest in a particular company or not.
Happy Investing!


