
Do you know how important it is to analyze volume indicators like the Money Flow Index? Yes! The money Flow Index is a volume-weighted relative strength index that analyzes both volume and price for measuring buying or selling purposes.
Don’t be confused! This indicator is quite similar to the Relative Strength Index as the calculation of both the Relative Strength Index and Money Flow Index is the same, the only difference is that it also incorporates volume in its calculation other than price.
To clear all your confusion, in today’s blog, we will discuss what this indicator is all about and how to trade with this indicator. So, without further delay let’s begin with the basics of this indicator:
What is Money Flow Index?
The Money Flow Index is a volume indicator that helps in measuring the trading pressure on a particular asset, usually a stock, by analyzing the price and volume of trading.
The MFI acts as an oscillator that ranges between 0 and 100. It helps us in signalling whether the stock is in the overbuying or overselling zone as well as divergences between the prices and this indicator helps in predicting a reversal in market trends.
But how this indicator is calculated? Let us discuss the calculation of MFI:
Calculation of MFI
The Money Flow Index requires a series of calculations.
- First, we need to calculate the period’s Typical Price = (High + Low + Close)/3
- Next, Money Flow is calculated by multiplying the period’s Typical Price by the volume. Money Flow = Typical Price * Volume. One should note that if today’s Typical Price is greater than yesterday’s Typical Price, it is considered Positive Money Flow. So, if today’s price is less, then it is considered a Negative Money Flow. Where Positive Money Flow is the sum of the Positive Money over the specified number of periods and Negative Money Flow is the sum of the Negative Money over the specified number of periods.
- The Money Ratio is then calculated by dividing the Positive Money Flow by the Negative Money Flow. Thus, Money Ratio = Positive Money Flow / Negative Money Flow
- Finally, we calculate the Money Flow Index is calculated using the Money Ratio which equals 100 – [100 / (1 + Money Ratio)]
Now that we know the calculation, let us discuss how can we trade with this indicator to generate trend reversal signals:
Trading with MFI
We can trade with the Money Flow Index in a number of ways as follows:
1. Overbought and Oversold zones
A stock is considered to be overbought if the MFI shows a fast price rise to a high level. The overbought zone is a region where prices have risen a lot and now it is tired of moving ahead so the prices may reverse soon to a downtrend.

Similarly, a stock is considered oversold if the MFI indicates a rapid decline in the price to a considerably low level. The oversold zone is a region where prices have fallen a lot and now it is tired of falling more so the prices may reverse soon to the uptrend.
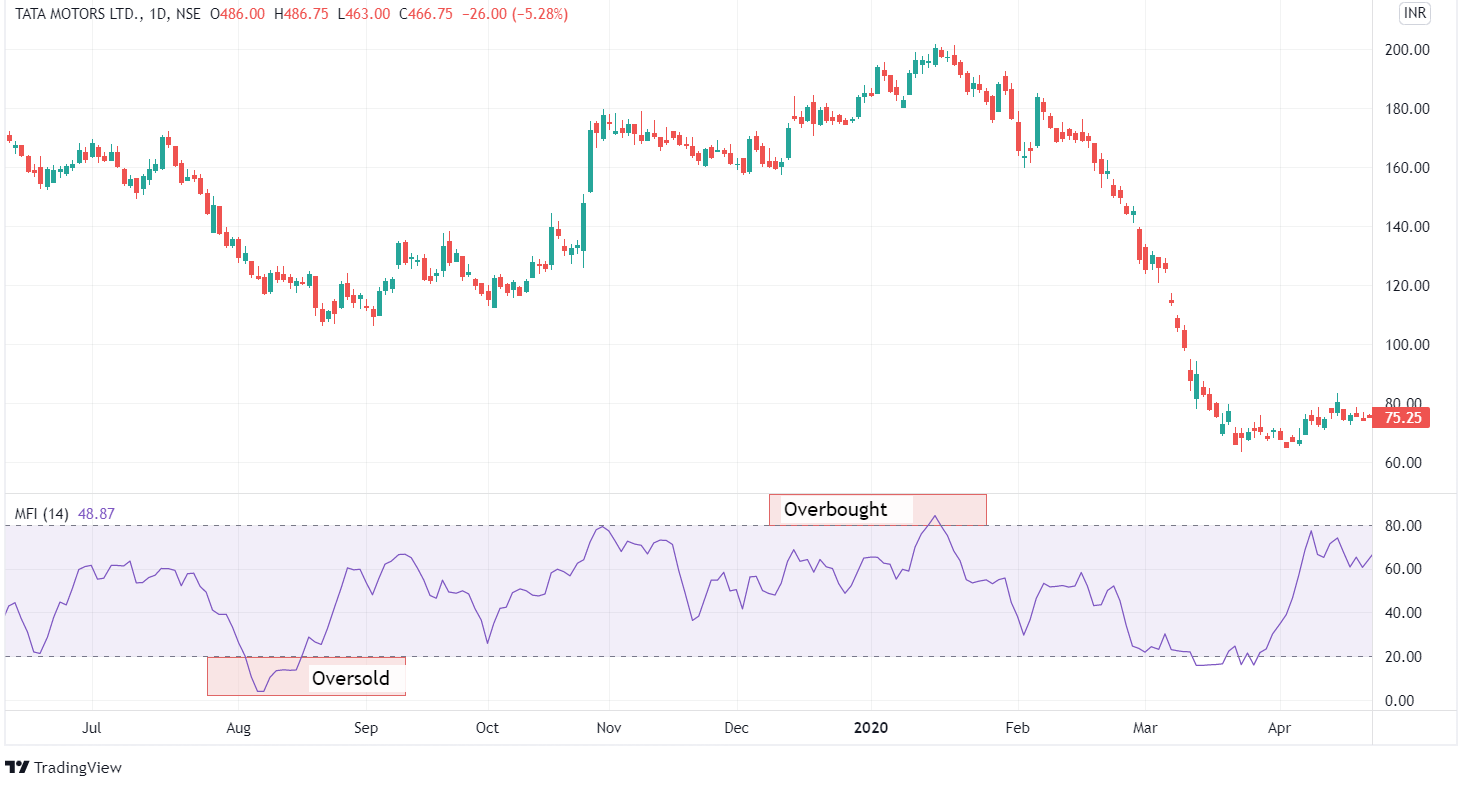
The oversold and overbought levels are helpful for identifying price extremes. Generally, the overbought condition for MFI is above 80, and below 20 MFI indicates an oversold condition. The prices may also continue to rise while the upward trend is strong, and the MFI can increase beyond 80.
On the other hand, when MFI fall below 20 then the prices can continue to fall in the presence of a strong downward trend.
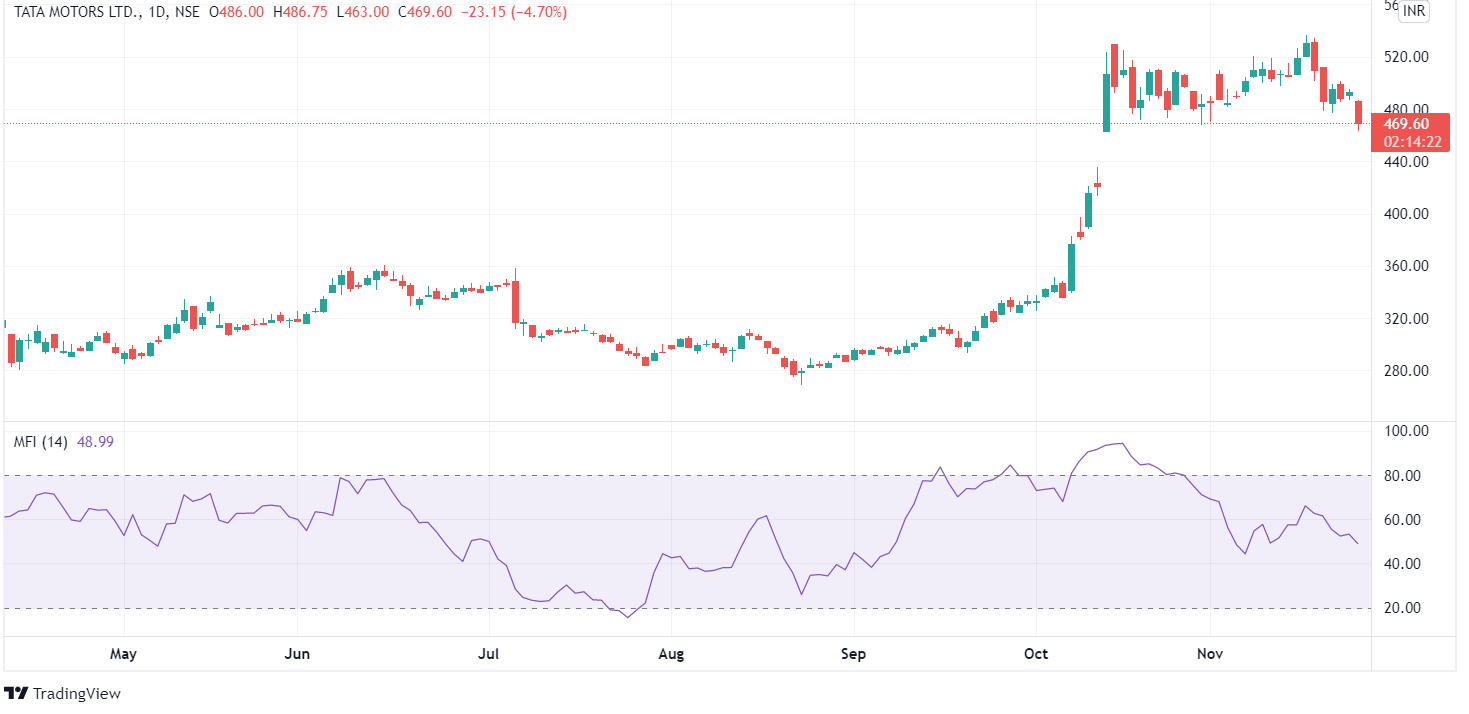
In the below daily chart of Tata Motors Ltd. we can see how the stock after reaching the oversold zone, reverses to an uptrend and reached the overbought zone:
If the MFI increases above 90, it is considered a truly overbought condition, and a below 10 MFI is considered a truly oversold condition. However, the MFI beyond 90 and less than 10 occur rarely as it suggests that a price movement is not sustainable.
2. Divergences
The second way of trading with this indicator is spotting divergences between the prices and MFI:
a. Bullish Money Flow Index (MFI) divergence
Bullish Divergence occurs when the price moves to a new low, whereas, the MFI moves to a higher low that shows a boost in money flow. This indicates that the selling pressure is decreasing, and buyers will soon be taking over the market. It also presents an opportunity of buying securities at lower prices. We can see the bullish divergence in the chart of USD/INR daily chart after which the prices went up and had offered good buying opportunities.
b. Bearish Money Flow Index (MFI) divergence
A bearish divergence occurs when the price shifts to a new high whereas the MFI indicates a lower high. This indicates that the decrease in buying pressure is the time for sellers to take over the market. It is an opportunity for sellers to make profits. We can see the bearish divergence in the chart of Tata Motors daily chart after which the prices went down and had offered good selling opportunities.
3. Failure Swings
Like divergences, failure swings can also indicate price reversal. But one should note that failure swings do not completely depend on price and rely on the MFI. There are four steps in failure swings in both bullish and bearish failure swings:
a. Bullish MFI failure swing
- MFI decreases below 20 (oversold)
- MFI recovers and rises above 20
- MFI decreases but stays above 20
- MFI shoots above the previous high
b. Bearish MFI failure swing
- MFI increases above 80 (overbought)
- MFI drops below 80
- MFI slightly increases but stays below 80
- MFI drops below the previous low
Join our course on TECHNICAL ANALYSIS MADE EASY
Using StockEdge for Money Flow Index Screener:
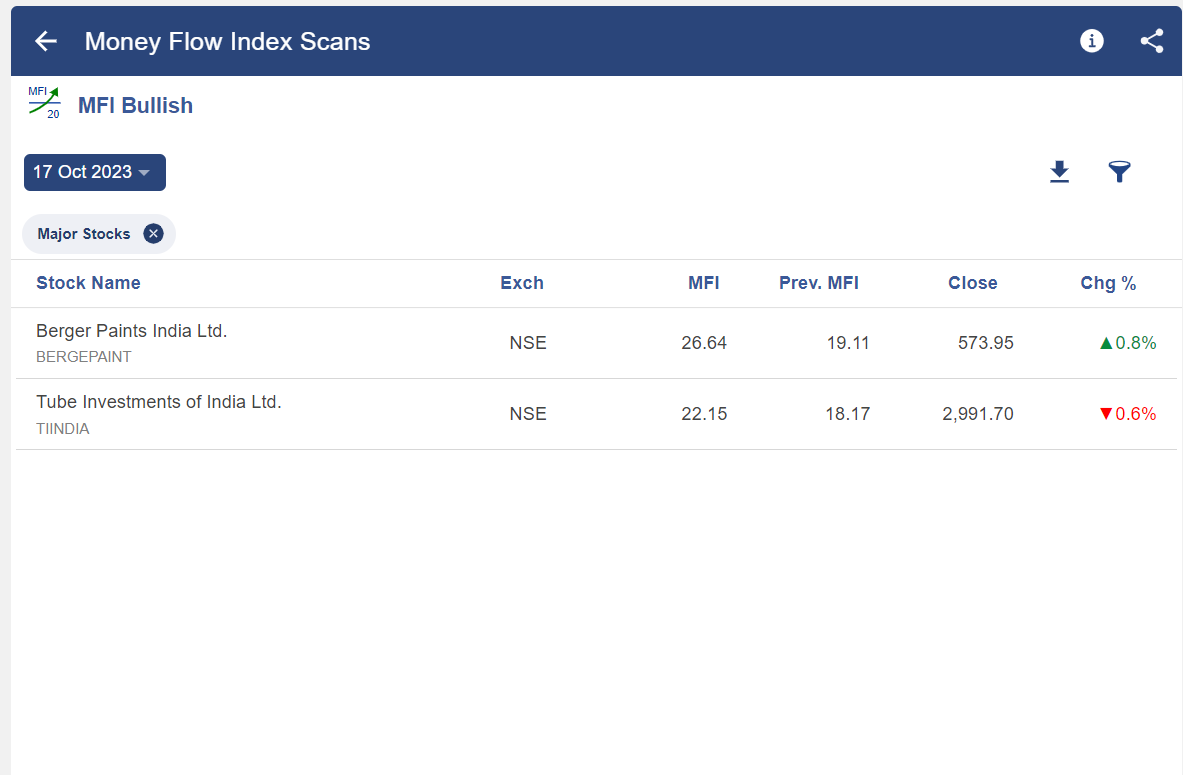
StockEdge has many Money Flow Index-related scans which help us to filter out stocks for trading as shown below:
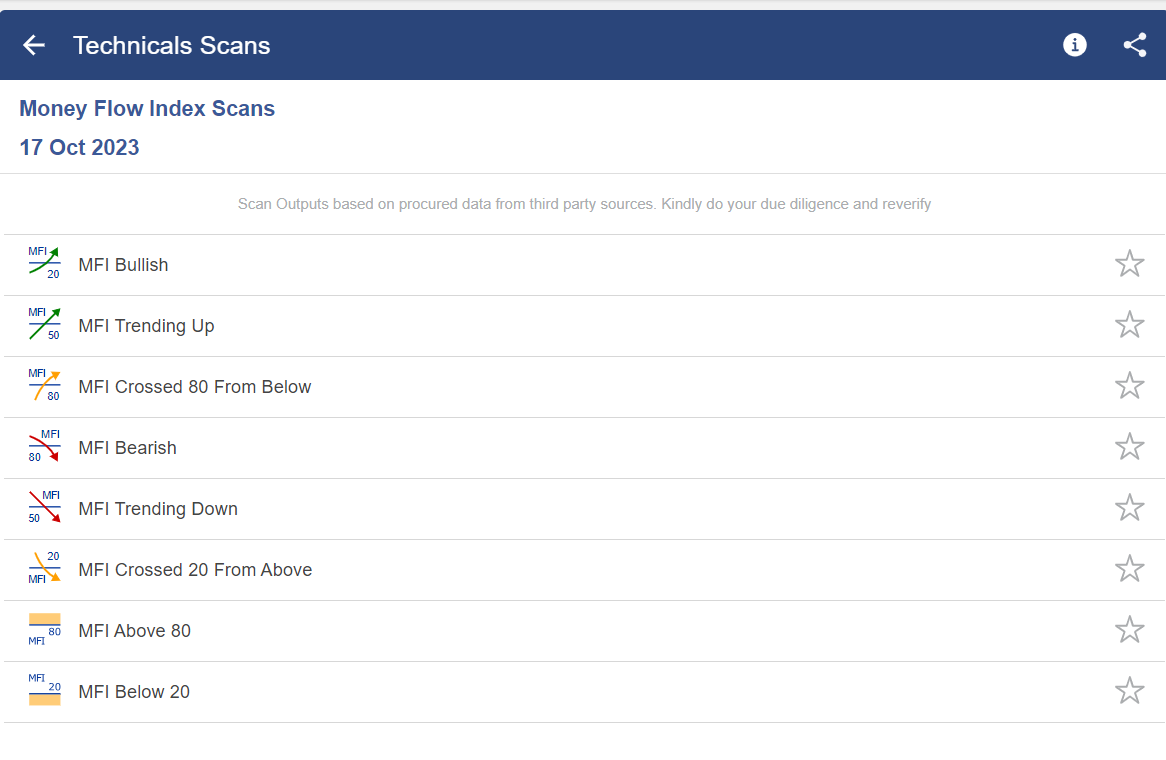
With the help of these scans, one can filter our stocks as shown below:
Limitations
As with other technical indicators, the MFI is also capable of producing false signals. This is when the indicator indicates a good trading opportunity but then the price doesn’t move as expected which results in a losing trade. A divergence may also not result in a price reversal, for instance.
One should also note that the indicator may also fail to warn of something important. For example, divergence won’t be present for all price reversals. Because of this, it is recommended that traders should use other forms of technical analysis tools or indicators and risk control and not rely solely on these indicators.
Bottomline
As we have discussed above, MFI is a good indicator when it comes to analyzing both price and volume. But also, it has limitations too as pointed out, so one should use this indicator with the conjunction of other technical indicators.
Frequently Asked Questions (FAQs)
What is the Money Flow Index?
By examining price and volume data, the Money Flow Index (MFI) is an indicator that gauges the amount of purchasing and selling pressure. The range of the MFI indicator is 0 to 100. When the MFI exceeds 80, it suggests an overbought situation; when it drops below 20, it suggests an oversold one.
Is Money Flow Index better than RSI?
Similar to RSI, the money flow index (MFI) indicator also takes volume into account. While MFI is less well-known than RSI, it is just as effective—and often even more so—for swing and short-term trading.
Which indicator is best with Money Flow Index?
The Money Flow Index is a pretty unusual indicator that uses an RSI calculation to combine volume and momentum. When the indicator is over 50, RSI momentum usually favours the bulls; when it is below 50, it favours the bears.


