Elearnmarkets - Financial Market Learning
  • Courses
  • Webinars
  • Stories
  • Language
    • English
    • Hindi
    • Bengali
No Result
View All Result
Get Free Course
  • Basic Finance
  • Derivatives
    • Futures
    • Options
  • Financial Planning
  • Fundamental Analysis
  • Technical Analysis
  • Mutual Funds
  • Marketshala
  • Miscellaneous
Elearnmarkets - Learn Stock Market, trading, investing for Free
  • Courses
  • Webinars
  • Stories
  • Language
    • English
    • Hindi
    • Bengali
No Result
View All Result
Get Free Course
Elearnmarkets - Learn Stock Market, trading, investing for Free
No Result
View All Result
Home Technical Analysis
Three Black Crows Candlestick Pattern - Formation, Trading, Limitations & Use 1

Three Black Crows Candlestick Pattern – Formation, Trading, Limitations & Use

Elearnmarkets by Elearnmarkets
May 24, 2025
in Technical Analysis
Reading Time: 7 mins read
3
18.3k
VIEWS
Share on FacebookShare on XShare on WhatsApp

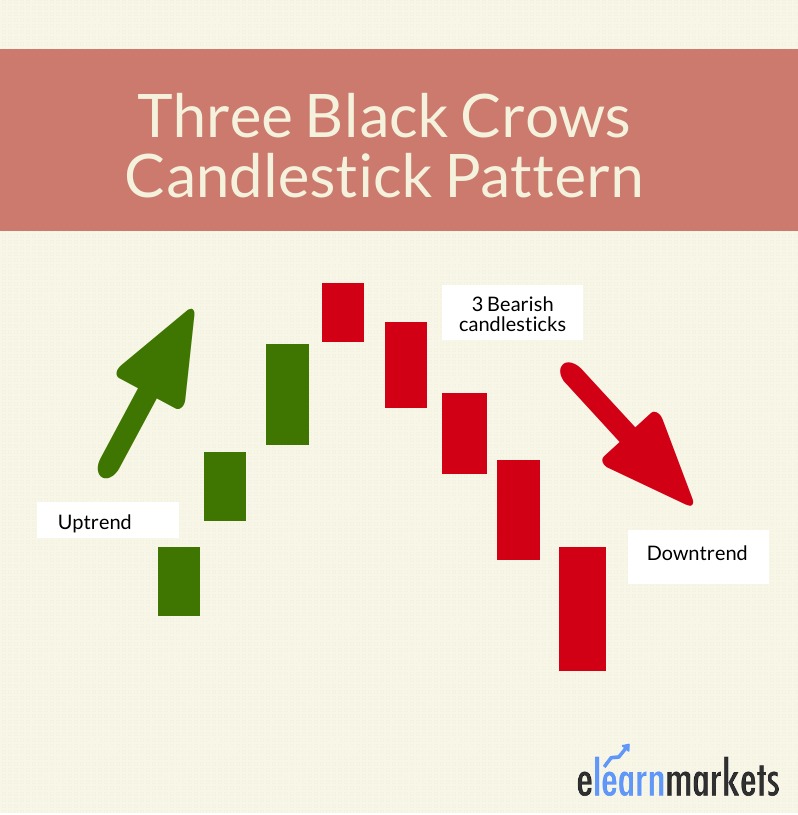
The Three Black Crows pattern is a bearish reversal pattern that consists of three bearish long-bodied candlesticks.

Each of the three candlesticks should be long-bodied bearish candlestick; each candlestick’s opening price should be lower than the previous candlestick’s opening price.

It is a bearish reversal pattern; therefore, it should be considered only when it appears after an uptrend.

The Three Crows pattern signals weakness in an ongoing uptrend and the potential reversal to the downtrend.

Let us discuss in detail how we can trade with this bearish reversal candlestick pattern:

Table Of Contents
  1. What is the Three Black Crows Candlestick Pattern?
  2. Formation of Three Black Crows:
  3. How to trade with this Three Black Crows Pattern ?
    • 1st Candle:
    • 2nd Candle:
    • 3rd Candle:
  4. Example:
  5. How to use the Three Black Crows pattern in StockEdge ?
  6. Limitations
  7. Bottomline
  8. What does 3 Black Crows Indicate?
  9. What is the Success Rate of the 3 Black Crows?

What is the Three Black Crows Candlestick Pattern?

Three Crows pattern is a multiple candlestick chart pattern that is used to predict reversal to the downtrend.

This candlestick pattern is formed when the bearish forces come into the action and make the prices fall for three consecutive days.

Traders should take a short position after this bearish candlestick pattern is formed.

Traders can also take the help of volume and technical indicators to confirm the formation of this candlestick pattern.

Formation of Three Black Crows:

Here is the Formation of Three Crows pattern:

Formation of Three Black crows Candlestick Pattern

How to trade with this Three Black Crows Pattern ?

Let us discuss how to trade with this candlestick pattern step by step:

1st Candle:

The first candlestick of this pattern should be long bodied bearish candlestick and must be formed as the continuation of the ongoing uptrend.

A bearish candle means that the closing price should be lower than the opening price as the bears are trying to make the prices fall.

2nd Candle:

The second candlestick should also be a bearish candle. It can be long or short bodied.

The opening price of this candlestick should lie within the real body of the first candlestick i.e should be in between the midpoint or the closing of the first candle.

The second candle should not break the high of the first candlestick.

3rd Candle:

The third candlestick should also be a bearish candle. It can either be a long or short-bodied candle.

The opening price of this candlestick should lie within the real body of the second candlestick i.e should be the midpoint or the closing of the second candle.

The third candle should not break the high of the second candlestick.

One should note that these three candlesticks can be Bearish Marubozu.

A Bearish Marubozu candlestick pattern is a long-bodied bearish candlestick in which the closing price is the low price and the opening price is the high price for that day.

There are no shadows in the Bearish Marubozu.
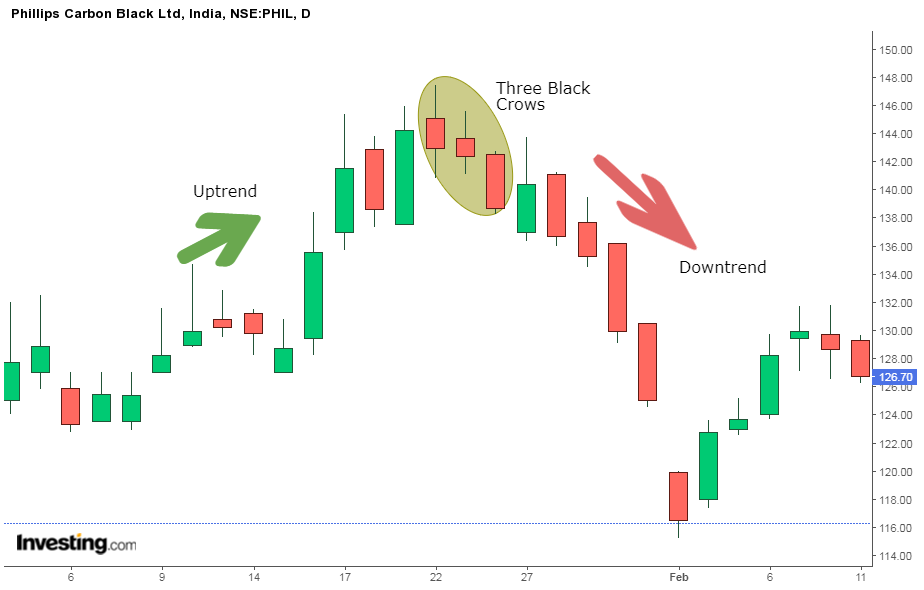
Example:

Below is an example of daily chart of Phillips Carbon Black Ltd. that shows us how Three Black Crows  Candlestick pattern is formed after an uptrend and the trend got reversed  to downtrend after the formation of candlestick pattern.

Three Crows Pattern Example

How to use the Three Black Crows pattern in StockEdge ?

You can also use the Three Black Crows Candlestick scans in StockEdge web version

Steps to use Three Crows pattern scans in StockEdge:

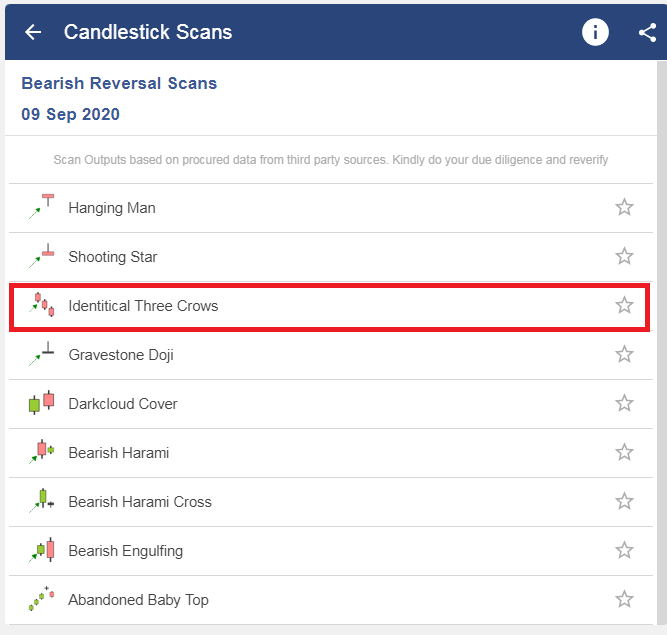
Under the “Candlestick Scans” we can see Bearish Reversal scans as shown below:

Bearish Reversal Scans

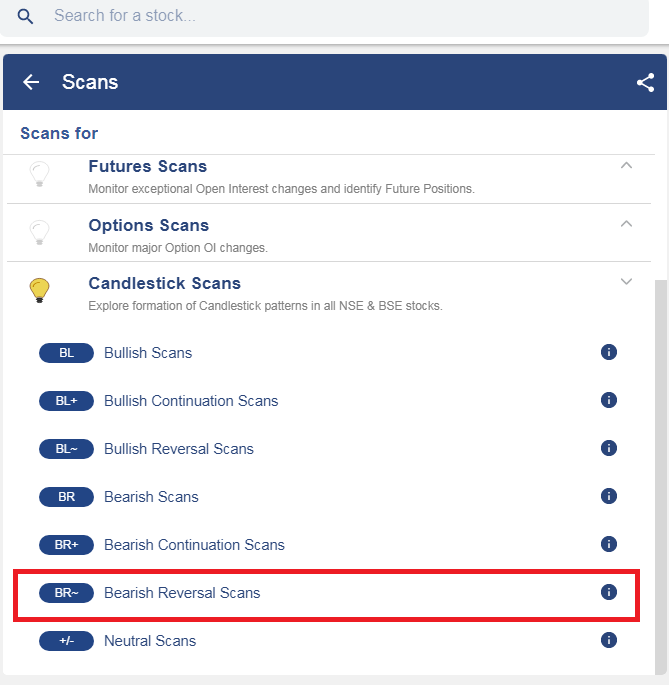
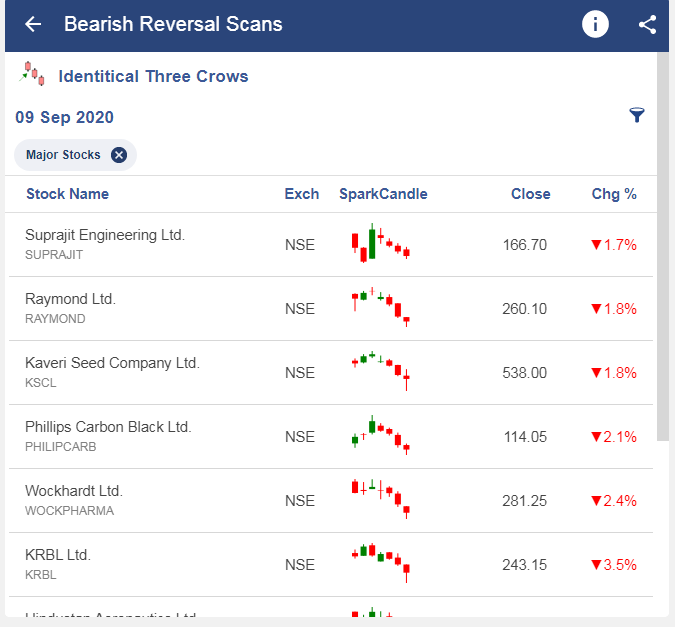
When we click on the “Bearish Reversal scans” we can see “Three Crows Pattern” scan, click on that:

Three Candlestick Pattern

After selecting on it, you will get a list of stocks in which the “Three Black Crows” pattern is formed.

Stocks List Three Crows

Limitations

As the three crows pattern makes the prices to fall, traders should be cautioned of the oversold conditions that may lead to consolidation before a further move down of the prices.

Traders should also look at other chart patterns or technical indicators to confirm the reversal rather than just using the three black crows pattern exclusively.

Read More- All 35 Candlestick Chart Patterns in the Stock Market

Bottomline

The Three Crows pattern is a bearish reversal pattern that consists of three bearish long-bodied candlesticks. The Three Black Crows is a bearish reversal pattern therefore it should be considered only when it appears after an uptrend. One should note that these three candlesticks can be Bearish Marubozu. Traders can also take the help of volume and technical indicators to confirm the formation of this candlestick pattern.

Frequently Asked Questions (FAQs)

What does 3 Black Crows Indicate?

As a bearish reversal pattern, the three black crows candlestick pattern is regarded as reasonably trustworthy. The three black crows, which are three successive bearish candles at the end of a bullish trend, indicate a change in power from the bulls to the bears.

What is the Success Rate of the 3 Black Crows?

The three black crows may form a consistent pattern that signals an upswing reversal. That does not imply that it is always effective. Although some traders contend that it has an almost 80% success rate, a lot of this will depend on the trading strategy and the context.

Tags: candlestick patternenglishtechnical basicsthree black crows patternThree crows pattern
ShareTweetSend
Get Kotak Offer Get Kotak Offer Get Kotak Offer
Previous Post

Unleash the Power of Long-Term Compound Interest Investments

Next Post

Retirement Portfolio Assets: Asset Allocation by Age

Elearnmarkets

Elearnmarkets

Elearnmarkets (ELM) is a complete financial market portal where the market experts have taken the onus to spread financial education. ELM constantly experiments with new education methodologies and technologies to make financial education effective, affordable and accessible to all. You can connect with us on Twitter @elearnmarkets.

Related Posts

Understand Slippage in Trading
Technical Analysis

What is Slippage in Trading? Meaning & Examples

March 28, 2025
359
Breakout trading strategies
Technical Analysis

Top 5 Breakout Trading Strategies

March 12, 2025
1.3k
5 stocks for today
Technical Analysis

5 Stocks to Buy Today That Could Beat the NIFTY in 2025!

May 5, 2025
449
Image describing What is marginal trading facility
Technical Analysis

 What is a Margin Trading Facility? Advantages & Risks

April 4, 2025
858

Comments 3

  1. PRS Raghavan says:
    5 years ago

    A very vital sign, explained in simple language for everyone to understand 👍👍👏👏

    Reply
  2. arjun says:
    4 years ago

    it is a piece of helpful information. I understood the concept you explained.

    Reply
    • Sakshi Agarwal says:
      4 years ago

      Hi,

      Thank you for Reading!

      Keep Reading

      Reply

Leave a Reply Cancel reply

Your email address will not be published. Required fields are marked *

Disclaimer

Elearnmarkets (Kredent InfoEdge Pvt. Ltd.) is a SEBI-registered Research Analyst (RA) entity (SEBI Registration No.: INH300007493). The information provided in this article is for educational and informational purposes only and should not be considered as an offer to buy or sell any securities or investment products.

The stocks, securities, and investment instruments mentioned herein are not recommendations under SEBI (Research Analysts) Regulations, 2014. Readers are advised to conduct their own due diligence and seek independent financial advice before making any investment decisions.

Investments in securities markets are subject to market risks. Please read all related documents carefully before investing. Investing in Equity Shares,
Derivatives, Mutual Funds, or other instruments carry inherent risks, including potential loss of capital. Elearnmarkets (Kredent InfoEdge Pvt. Ltd.) does not provide any guarantee or assurance of returns on any investments. Past performance is not indicative of future performance.

Elearnmarkets Logo

Follow Us

Facebook-f X-twitter Instagram Linkedin-in Youtube Telegram

Register on Elearnmarkets

Continue your financial learning by creating your own account on Elearnmarkets.com

Register Free Account

Download App

Playstore logo
Download on app store

Categories

  • Basic Finance
  • Derivatives
  • Financial Planning
  • Fundamental Analysis
  • Technical Analysis
  • Mutual Funds
  • Miscellaneous

Popular On Elearnmarkets

  • Market Superheroes:
  • Vivek Bajaj
  • Chetan Panchamia
  • Ashish Kyal
  • Premal Parekh
  • Abhijit Paul
  • Jegan
  • Sivakumar Jayachadran
  • Jyoti Budhia
  • Vivek Gadodia
  • Vishal Mehta
  • Piyush Chaudhry
  • Santosh Pasi
  • Gomathi Shankar
  • Market Superheroes:
  • Vivek Bajaj
  • Chetan Panchamia
  • Ashish Kyal
  • Premal Parekh
  • Abhijit Paul
  • Jegan
  • Sivakumar Jayachadran
  • Jyoti Budhia
  • Vivek Gadodia
  • Vishal Mehta
  • Piyush Chaudhry
  • Santosh Pasi
  • Gomathi Shankar
  • Courses:​
  • Options Trading
  • Dow Theory
  • Momentum Trading
  • Stock Investing
  • Harmonic Chart Patterns
  • Algo Trading
  • Elliot Wave Theory
  • Advanced Excel
  • Cryptocurrency
  • NSE Certification Course
  • Courses:​
  • Options Trading
  • Dow Theory
  • Momentum Trading
  • Stock Investing
  • Harmonic Chart Patterns
  • Algo Trading
  • Elliot Wave Theory
  • Advanced Excel
  • Cryptocurrency
  • NSE Certification Course
  • Webinars:
  • Bank Nifty Scalping
  • Intraday Trading Strategies
  • Options Trading Strategies
  • Options selling
  • Price Action
  • Relative Strength
  • Tax Planning
  • Options Buying
  • Growth Stocks
  • Portfolio Management
  • Risk Management
  • Renko Charts
  • Crude Oil
  • Traders Psychology
  • Moving Average
  • Multibagger Stocks
  • Free Learning Modules:
  • Intraday Trading
  • Options Scalping
  • Swing Trading
  • Financial Modelling
  • RSI Indicator
  • Bollinger Bands
  • Pricing of Futures
  • Personal Finance
  • Initial Public Offerings (IPO)
  • Value Investing
  • Technical Indicators
  • Candlesticks
  • Chart Patterns
  • Option Greeks
  • ELSS Funds
  • Banking and Insurance
  • Real Estate
  • Gold
  • Book Summaries:
  • Rich Dad Poor Dad
  • Psychology of Money
  • The Intelligent Investor
  • The Richest Man in Babylon
  • Think and Trade Like a Champion
  • Value Investing and Behavioural Finance
  • Trading in the Zone
  • Learn to Earn
  • Book Summaries:
  • Rich Dad Poor Dad
  • Psychology of Money
  • The Intelligent Investor
  • The Richest Man in Babylon
  • Think and Trade Like a Champion
  • Value Investing and Behavioural Finance
  • Trading in the Zone
  • Learn to Earn
  • Tools:
  • CAGR Calculator
  • SIP Calculator
  • eLearnOptions
  • Future Value Calculator
  • Present Value Calculator
  • Atal Pension Yojana
  • Cost of Delay Calculator
  • Become a Crorepati
  • Tools:
  • CAGR Calculator
  • SIP Calculator
  • eLearnOptions
  • Future Value Calculator
  • Present Value Calculator
  • Atal Pension Yojana
  • Cost of Delay Calculator
  • Become a Crorepati

© 2025 Elearnmarkets. All Rights Reserved

  • Visit Elearnmarkets
  • Courses
  • Webinars
  • Financial Guides
  • Get Free Counselling
  • Visit Elearnmarkets
  • Courses
  • Webinars
  • Financial Guides
  • Get Free Counselling

Download Our App

No Result
View All Result
  • Article Categories
    • Basic Finance
    • Derivatives
    • Financial Planning
    • Fundamental Analysis
    • Technical Analysis
    • ETFs & Mutual Funds
    • Marketshala
    • Miscellaneous
  • Language
    • Hindi
    • Bengali
    • English
  • Courses
  • Webinars
  • Stories
Get Free Course

© 2024 Elearnmarkets All Rights Reserved

A Handbook of Technical Analysis
To start your trading journey as a seasoned technical analyst
Download Guide For FREE
How to Spot False Dips and Trade with Confidence