Elearnmarkets - Financial Market Learning
  • Courses
  • Webinars
  • Stories
  • Language
    • English
    • Hindi
    • Bengali
No Result
View All Result
Get Free Course
  • Basic Finance
  • Derivatives
    • Futures
    • Options
  • Financial Planning
  • Fundamental Analysis
  • Technical Analysis
  • Mutual Funds
  • Marketshala
  • Miscellaneous
Elearnmarkets - Learn Stock Market, trading, investing for Free
  • Courses
  • Webinars
  • Stories
  • Language
    • English
    • Hindi
    • Bengali
No Result
View All Result
Get Free Course
Elearnmarkets - Learn Stock Market, trading, investing for Free
No Result
View All Result
Home Fundamental Analysis
How to Identify Thief Companies in the Stock Market? 1

How to Identify Thief Companies in the Stock Market?

Vivek Bajaj by Vivek Bajaj
December 3, 2024
in Fundamental Analysis
Reading Time: 6 mins read
0
1.1k
VIEWS
Share on FacebookShare on XShare on WhatsApp

In an interesting session as a part of the highly popular Face2Face series, conducted by Elearnmarkets, Mr. Vivek Bajaj, Co-founder of Elearnmarkets, invited Mr. Kaushik Mohan, a successful stock market Investor, to decode stock analysis technique and how one can identify thief companies in the stock market through fundamental analysis and save uncommon losses.

Mr. Kaushik Mohan has been in the stock market for around 10 years and researched companies both by reading reports as well as doing ground visits. He interacts with the management of the companies to know what are the futuristic goals and how the companies are performing. Also, he does ground research by visiting the factories and markets to find out how the companies’ products are doing in the market.

Let us discuss how we can find the red flags of the companies by doing a fundamental analysis of the companies:

Table of Contents

  • Why is it important to find Red Flags in the companies?
  • The Compounding Interest
  • Stock Market-Finding Red Flags in the Financial Statements
  • Cash Flow Statements
  • Other Fundamental Parameters
  • You can watch the full Face2Face video from here:
  • Bottomline

Why is it important to find Red Flags in the companies?

A red flag is used as a metaphor. It is typically used to indicate that there is an issue with a specific circumstance or to raise concerns. There may be warning signs in business that alert analysts and investors to a company’s or stock’s potential financial problems. Economic warning signs frequently point to impending issues.

There is no accepted method for recognising red flags. The research process an investor, analyst, or economist uses will determine how to find issues with an investment opportunity. Examining financial documents, economic indicators, or historical data may be part of this.

When deciding whether to invest in a company or security, investors must use due diligence. Financial statements offer a plethora of data about an organization’s health and can be used to spot potential warning signs. 

However, if the investor is unable to read financial statements correctly, it is practically hard to spot warning signs. Understanding financial accounts thoroughly and being able to comprehend them will help you succeed when investing.

The Compounding Interest

Mr Kaushik begins this interaction by discussing the compound interest formula which is –  A= P(1+R/100)^t

He says that people usually focus on return but they should actually focus on the time. According to him, a person can generate that much amount of wealth as more he spends time in the stock market.

Also, people should focus on the principal amount as without that component formula won’t work. Also, when investing in the stock market, one can look at P as the amount invested.

In the bear market, the probability of making good returns is bigger. So, one should never miss the bear market. At that time, one should focus on the P and not on T.

Mr Kaushik Mohan found out that in the bear market, companies in which retail investors, CFO expectation problems, cyclicals and promoter pledging are maximum, companies are bound to fall.

Stock Market-Finding Red Flags in the Financial Statements

According to Mr. Kaushik Mohan, 80% of the work is done by reading the following financial statements. The other 20% is done through ground analysis, market research and end consumers’ feedback. Below are the following financial statements that one should refer to:

  • Cash Flow 
  • Profit and loss
  • Balance sheet 
  • Auditors Report 
  • Management Commentary
  • Industry Numbers 
  • Credit Rating report

Cash Flow Statements

According to Mr Kaushik Mohan, the cash flow statement from Operating Activities is one of the most important financials that one should focus on.

CFO Calculation (Indirectly)= Net profit + Depreciation and Amortization +/ – Working capital changes  

stock market

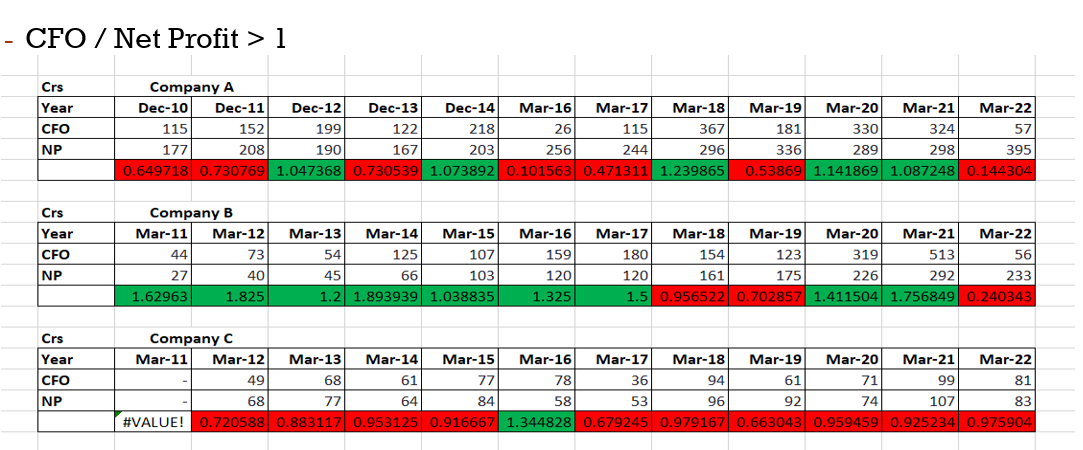
One should note that the CFO should be more than net profit after post-tax. In the above table, we can see the CFO calculation of three companies. If the CFO is more than 1 then it is marked in green and if the CFO is less than 1, then it is marked in red. 

Philosophically there should be more green boxes than red boxes for a good fundamental company. So, in the above example, we can see that Company B, has more green boxes then compared to the other companies in the same sector.

So, we can conclude from the above example, that company B is a good wealth creator company. If we do not invest in Company B, then we can invest in Company A as it has more green boxes than Company C.

However, Company B did not participate in the 2021 rally. The company that participated in the rally was Company C. This is because they had a problem with the working capital.

Other Fundamental Parameters

Other than the above fundamental parameter, one should also analyze the following parameters:

  • Audit fees as a percentage of revenue
  • CCC (cash conversion cycle)
  • Goodwill as a percentage of total assets
  • Board and promoter composition
  • Loans and advances
  • Fixed cost and variable cost

You can watch the full Face2Face video from here:

Bottomline

One should note that other than reading the financial statement, one should also do market research on that company to decide whether to invest or not in the market.

Tags: advanceenglishfundamental analysis
ShareTweetSend
Get Kotak Offer Get Kotak Offer Get Kotak Offer
Previous Post

5 Tools to Spot Trend Reversals in Stocks

Next Post

5 Hedging Strategies for Financial Markets

Vivek Bajaj

Vivek Bajaj

Mr. Vivek Bajaj has over 18 years of trading experience in equities, options, currencies, and commodity markets. He is the co-founder of Stockedge and Elearnmarkets and is passionate about data, analytics, and technology. He serves on various exchange committees and has played a significant role in the evolution of India's derivative market. He has been a speaker at various colleges and higher institutions, including IIT and IIMs.

Related Posts

Top 5 Valuation Ratios in the Stock Market 2
Fundamental Analysis

Top 5 Valuation Ratios in the Stock Market

May 5, 2025
819
price to sales ratio
Fundamental Analysis

Price to Sales Ratio: A Key Metric for Understanding Company Value

May 5, 2025
445
Gearing Ratio
Fundamental Analysis

What Is the Gearing Ratio? Formula & Calculation

December 3, 2024
1.1k
Top 5 Fundamental Analysis Tools 3
Fundamental Analysis

Top 5 Fundamental Analysis Tools

January 31, 2025
4.1k

Leave a Reply Cancel reply

Your email address will not be published. Required fields are marked *

Disclaimer

Elearnmarkets (Kredent InfoEdge Pvt. Ltd.) is a SEBI-registered Research Analyst (RA) entity (SEBI Registration No.: INH300007493). The information provided in this article is for educational and informational purposes only and should not be considered as an offer to buy or sell any securities or investment products.

The stocks, securities, and investment instruments mentioned herein are not recommendations under SEBI (Research Analysts) Regulations, 2014. Readers are advised to conduct their own due diligence and seek independent financial advice before making any investment decisions.

Investments in securities markets are subject to market risks. Please read all related documents carefully before investing. Investing in Equity Shares,
Derivatives, Mutual Funds, or other instruments carry inherent risks, including potential loss of capital. Elearnmarkets (Kredent InfoEdge Pvt. Ltd.) does not provide any guarantee or assurance of returns on any investments. Past performance is not indicative of future performance.

Elearnmarkets Logo

Follow Us

Facebook-f X-twitter Instagram Linkedin-in Youtube Telegram

Register on Elearnmarkets

Continue your financial learning by creating your own account on Elearnmarkets.com

Register Free Account

Download App

Playstore logo
Download on app store

Categories

  • Basic Finance
  • Derivatives
  • Financial Planning
  • Fundamental Analysis
  • Technical Analysis
  • Mutual Funds
  • Miscellaneous

Popular On Elearnmarkets

  • Market Superheroes:
  • Vivek Bajaj
  • Chetan Panchamia
  • Ashish Kyal
  • Premal Parekh
  • Abhijit Paul
  • Jegan
  • Sivakumar Jayachadran
  • Jyoti Budhia
  • Vivek Gadodia
  • Vishal Mehta
  • Piyush Chaudhry
  • Santosh Pasi
  • Gomathi Shankar
  • Market Superheroes:
  • Vivek Bajaj
  • Chetan Panchamia
  • Ashish Kyal
  • Premal Parekh
  • Abhijit Paul
  • Jegan
  • Sivakumar Jayachadran
  • Jyoti Budhia
  • Vivek Gadodia
  • Vishal Mehta
  • Piyush Chaudhry
  • Santosh Pasi
  • Gomathi Shankar
  • Courses:​
  • Options Trading
  • Dow Theory
  • Momentum Trading
  • Stock Investing
  • Harmonic Chart Patterns
  • Algo Trading
  • Elliot Wave Theory
  • Advanced Excel
  • Cryptocurrency
  • NSE Certification Course
  • Courses:​
  • Options Trading
  • Dow Theory
  • Momentum Trading
  • Stock Investing
  • Harmonic Chart Patterns
  • Algo Trading
  • Elliot Wave Theory
  • Advanced Excel
  • Cryptocurrency
  • NSE Certification Course
  • Webinars:
  • Bank Nifty Scalping
  • Intraday Trading Strategies
  • Options Trading Strategies
  • Options selling
  • Price Action
  • Relative Strength
  • Tax Planning
  • Options Buying
  • Growth Stocks
  • Portfolio Management
  • Risk Management
  • Renko Charts
  • Crude Oil
  • Traders Psychology
  • Moving Average
  • Multibagger Stocks
  • Free Learning Modules:
  • Intraday Trading
  • Options Scalping
  • Swing Trading
  • Financial Modelling
  • RSI Indicator
  • Bollinger Bands
  • Pricing of Futures
  • Personal Finance
  • Initial Public Offerings (IPO)
  • Value Investing
  • Technical Indicators
  • Candlesticks
  • Chart Patterns
  • Option Greeks
  • ELSS Funds
  • Banking and Insurance
  • Real Estate
  • Gold
  • Book Summaries:
  • Rich Dad Poor Dad
  • Psychology of Money
  • The Intelligent Investor
  • The Richest Man in Babylon
  • Think and Trade Like a Champion
  • Value Investing and Behavioural Finance
  • Trading in the Zone
  • Learn to Earn
  • Book Summaries:
  • Rich Dad Poor Dad
  • Psychology of Money
  • The Intelligent Investor
  • The Richest Man in Babylon
  • Think and Trade Like a Champion
  • Value Investing and Behavioural Finance
  • Trading in the Zone
  • Learn to Earn
  • Tools:
  • CAGR Calculator
  • SIP Calculator
  • eLearnOptions
  • Future Value Calculator
  • Present Value Calculator
  • Atal Pension Yojana
  • Cost of Delay Calculator
  • Become a Crorepati
  • Tools:
  • CAGR Calculator
  • SIP Calculator
  • eLearnOptions
  • Future Value Calculator
  • Present Value Calculator
  • Atal Pension Yojana
  • Cost of Delay Calculator
  • Become a Crorepati

© 2025 Elearnmarkets. All Rights Reserved

  • Visit Elearnmarkets
  • Courses
  • Webinars
  • Financial Guides
  • Get Free Counselling
  • Visit Elearnmarkets
  • Courses
  • Webinars
  • Financial Guides
  • Get Free Counselling

Download Our App

No Result
View All Result
  • Article Categories
    • Basic Finance
    • Derivatives
    • Financial Planning
    • Fundamental Analysis
    • Technical Analysis
    • ETFs & Mutual Funds
    • Marketshala
    • Miscellaneous
  • Language
    • Hindi
    • Bengali
    • English
  • Courses
  • Webinars
  • Stories
Get Free Course

© 2024 Elearnmarkets All Rights Reserved

Trading Day 2025