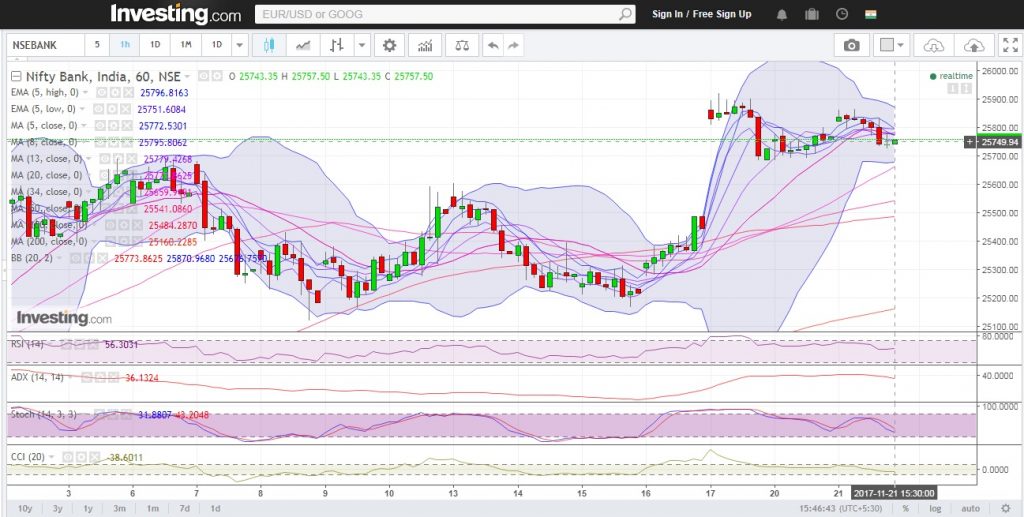
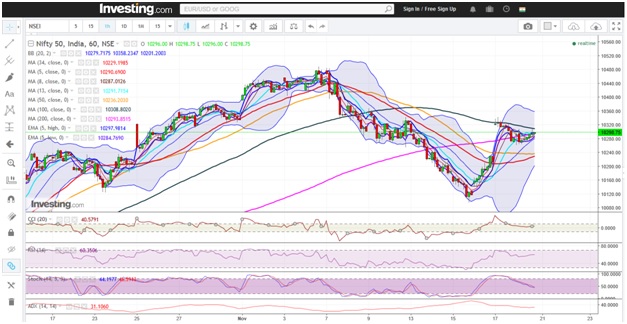
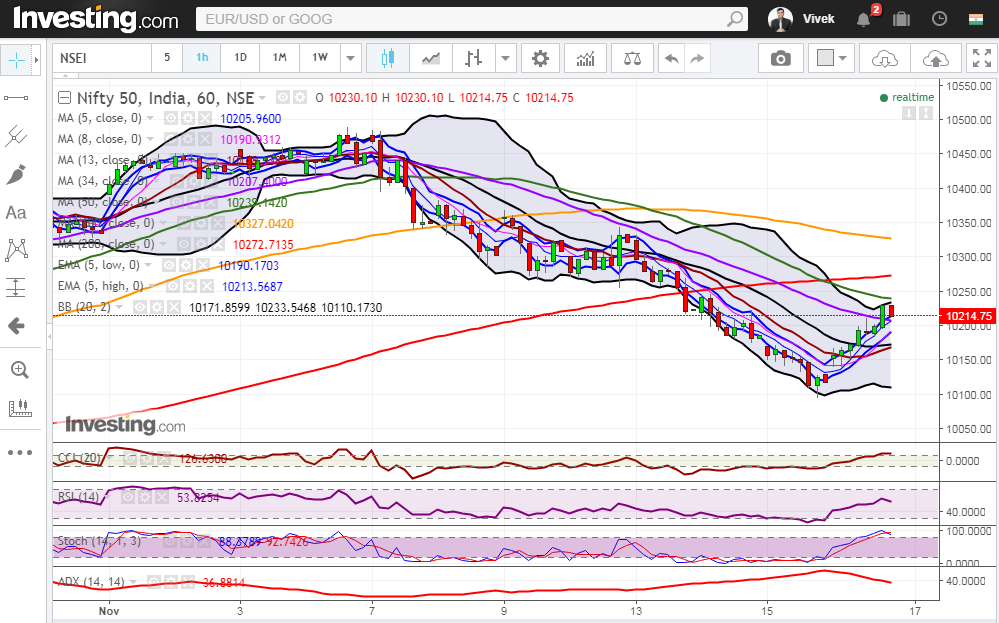
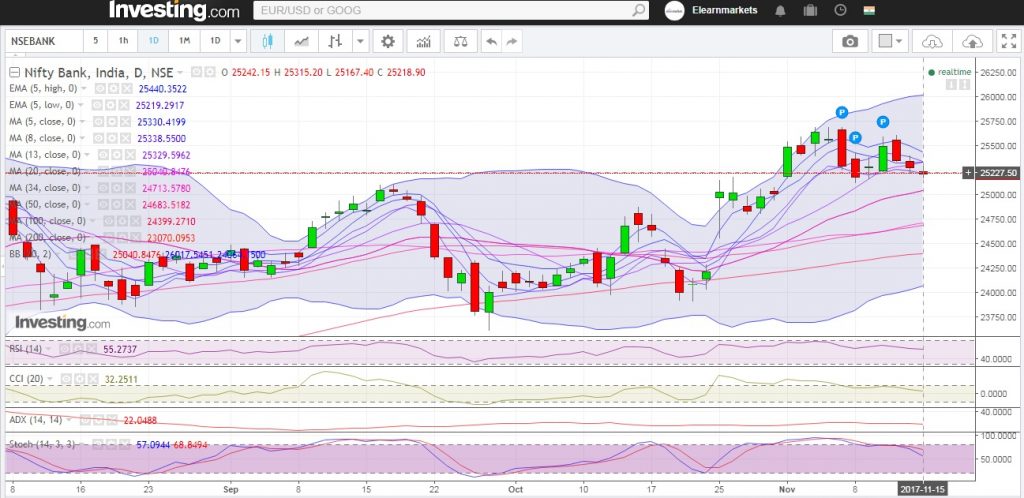
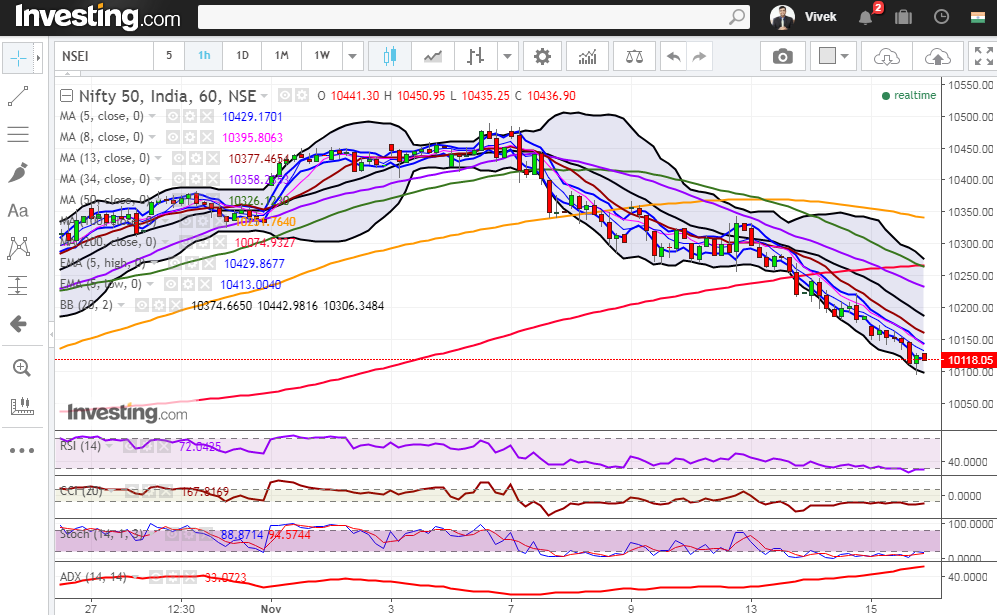
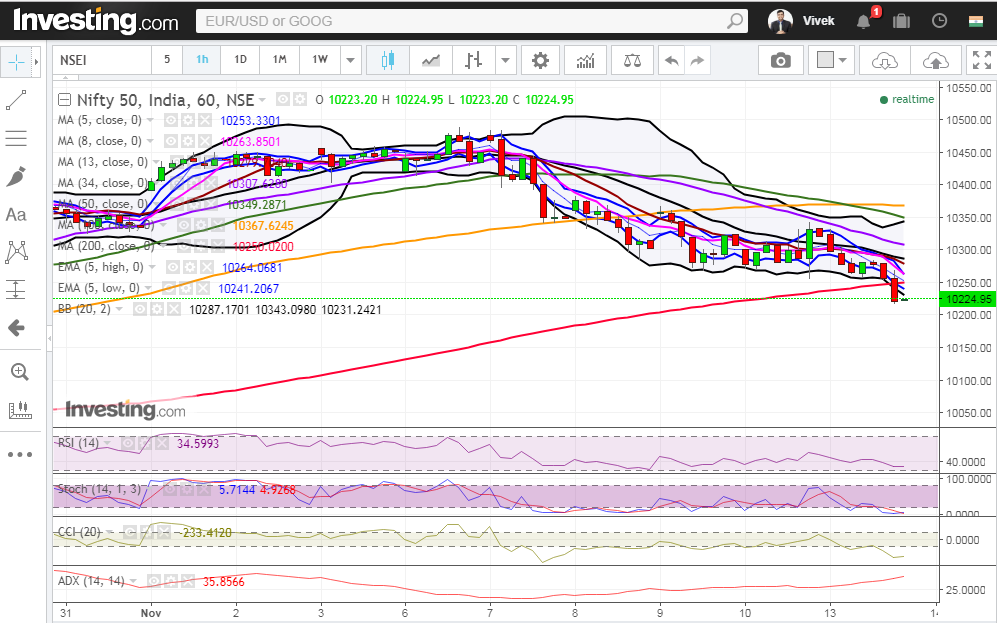
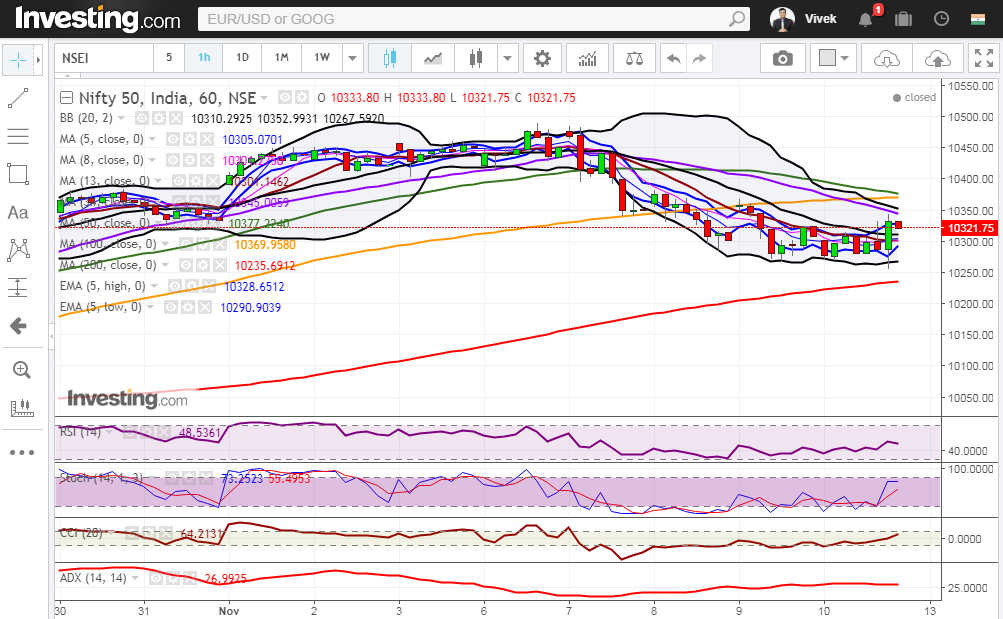
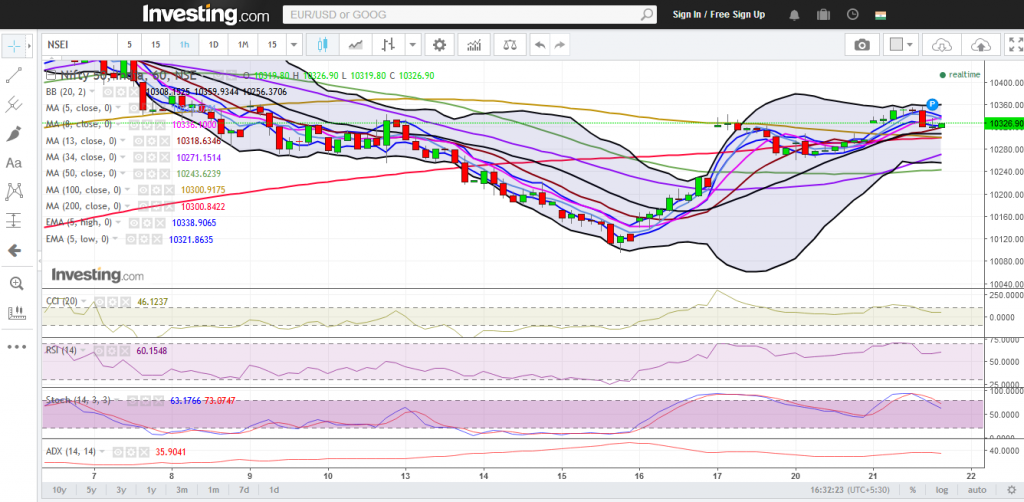
Bank Nifty Hourly Chart

Bank Nifty might see correction again

Bank Nifty opened above its 5 Day Low EMA (25351 approx) today. The Index traded in a range of 174 points and closed below its opening price. Hourly Technicals: In the Hourly Chart, Bank Nifty has closed above its 5 HMA of (25276 approx). The Index is likely to face immediate resistance above it's 5 hourly high EMA (25333 approx). Bank Nifty will find its next support around the 5 Hourly low EMA ( 25264 approx). Hourly RSI stands close to the lower end of the normal range while the CCI is indicating that sentiments are negative. ADX is indicating that Bank-Nifty might not undergo major volatility yet. Figure: Bank-Nifty Hourly Chart Daily Technicals: The daily chart indicates that Bank Nifty has closed marginally above its 5 day low EMA (25254 approx). The Index will face immediate resistance around its 8 DMA(25392 approx). On the downside, however, if Bank Nifty breaks and closes below its intraday low (25224 approx), it could find support at its 20 DMA (25012 approx). The daily RSI indicator has closed midway between the normal range. The CCI indicator, however, is indicating that sentiments are still positive. The ADX indicates that momentum might remain slack. Figure: Bank-Nifty Daily Chart Figure: Bank-Nifty Tech Table Watch the video below to know how to analyze the above matrix: https://www.youtube.com/watch?v=Wf3G-opvpOE&t=320s

Bank Nifty Hourly Chart

Bank Nifty might slip into a narrow trading corridor

Bank Nifty opened above its 5 Day High EMA (25559 approx) today . The Index traded in a range of 265 points  and closed below its opening price. Hourly Technicals: In the Hourly Chart, Bank Nifty has closed at  its 34 HEMA of (25356 approx).The Index is likely to face immediate resistance above its 5 hourly low EMA (25396 approx). Hourly RSI stands close to the lower end of the normal range while the CCI is indicating that sentiments are negative. ADX is indicating that Bank Nifty might not undergo volatility yet. Figure: Bank-Nifty Hourly Chart Daily Technicals: The daily chart indicates that Bank Nifty has closed  below  its 5 day high EMA (25550 approx). The Index will face immediate resistance around its 8 DMA(25410 approx). On the downside however, if Bank Nifty breaks and closes below its 5 DMA (25326 approx), it could find support at its 5 day low EMA (25257 approx). The daily RSI indicator has closed midway between the normal range.The CCI indicator however is indicating that sentiments are still positive.The ADX indicates that momentum might remain slack. Figure: Bank-Nifty Daily Chart Figure: Bank-Nifty Tech Table

Page 2 of 9 1 2 3 9
To start your trading journey as a seasoned technical analyst

Take The First Step Towards

Financial independence

Create your free Elearnmarkets account and

Get 20% off
with code WELCOME
on your first purchase of any course or webinar

No thanks, I don't want a free account and discount