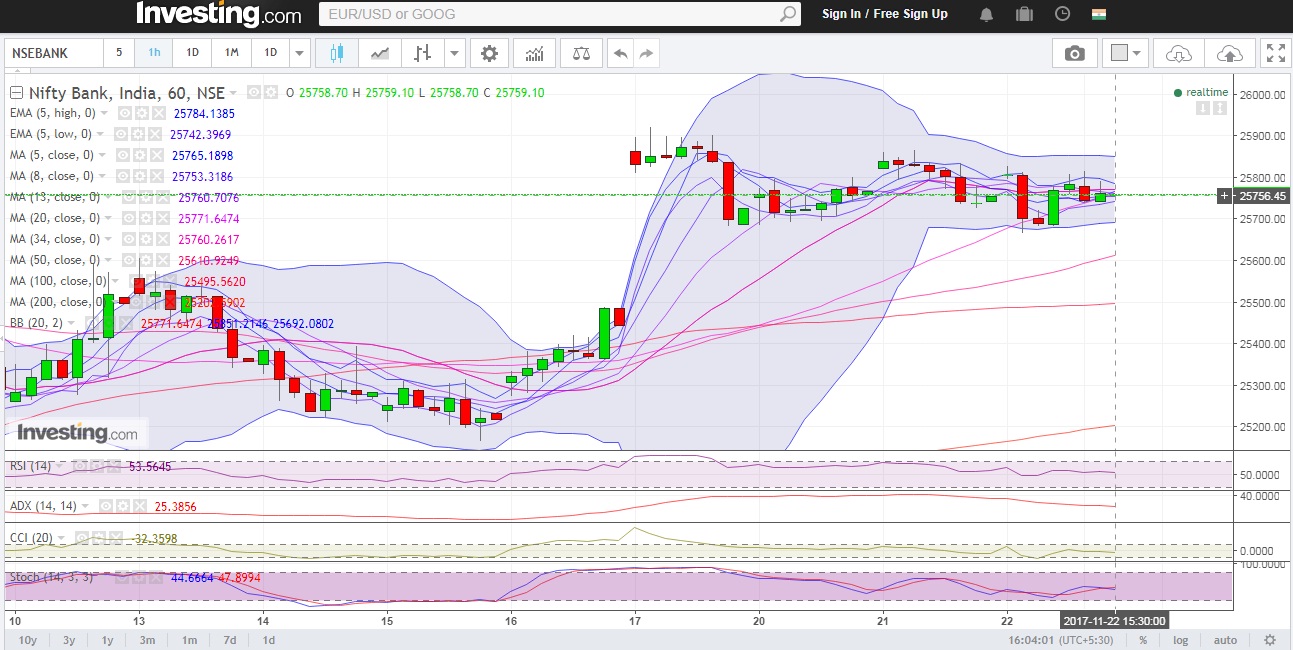
Bank Nifty Might Slip Further Down
Bank Nifty opened above its 5 Day High EMA (25806 approx) today . The Index traded in a range of ...


Bank Nifty opened above its 5 Day High EMA (25806 approx) today . The Index traded in a range of ...
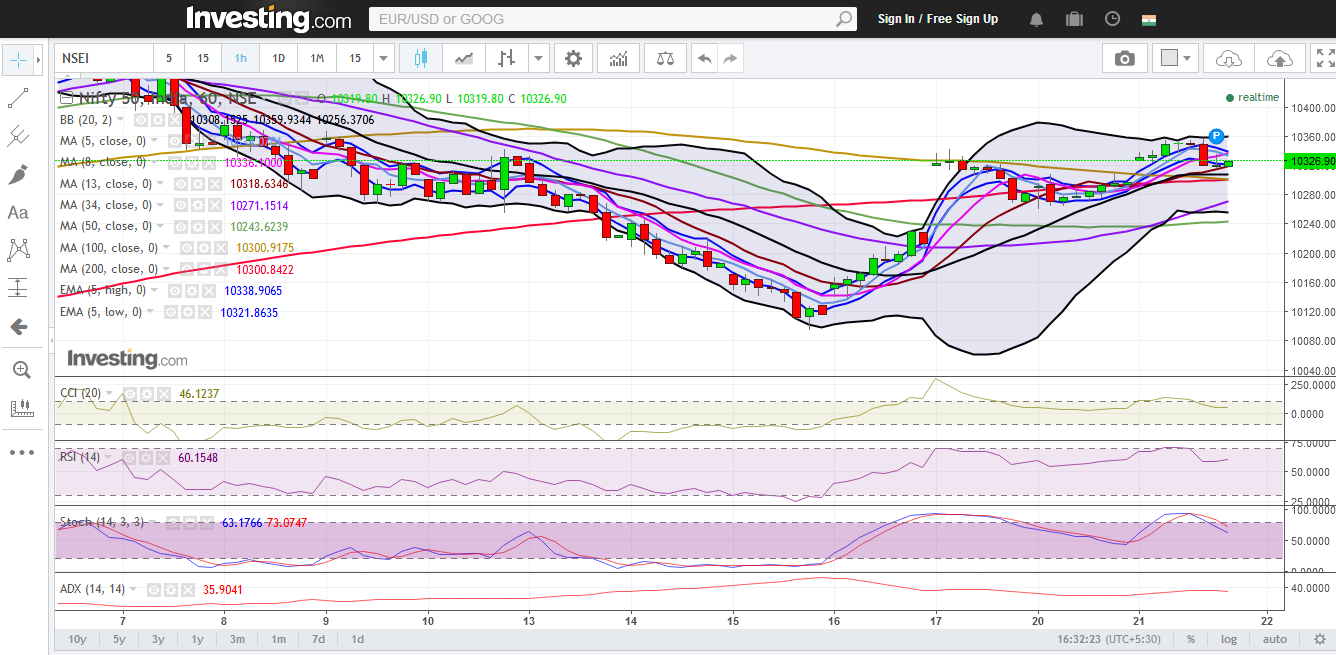
Nifty (Close 10326.9): It opened with a slight gap up and closed around its opening level, above 20 Daily Moving ...
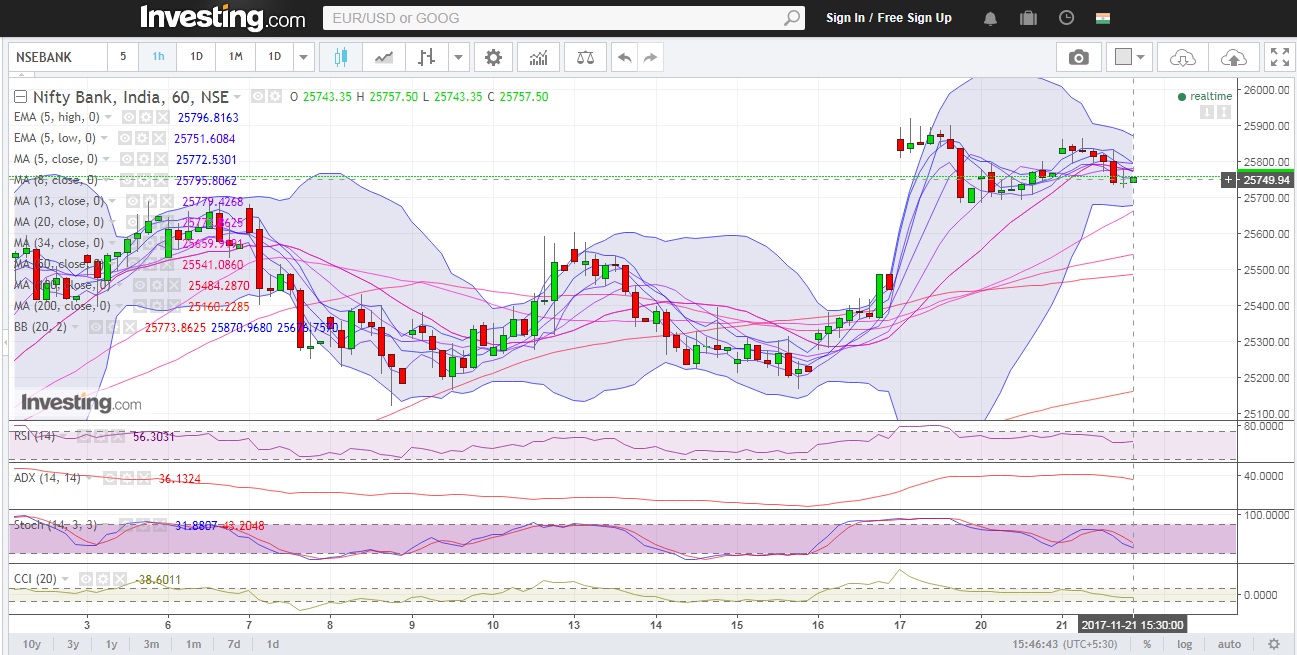
Bank Nifty opened above its 5 Day High EMA (25824 approx) today . The Index traded in a range of ...
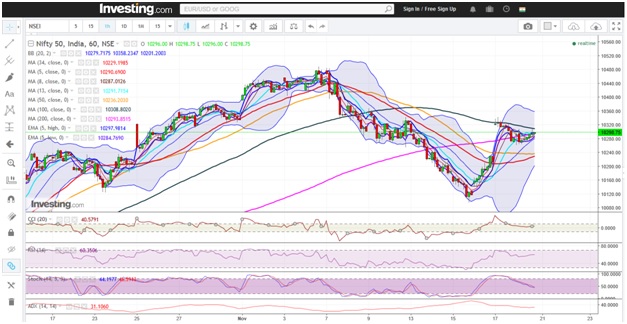
Nifty (Close 10298.8): Nifty remained range bound during the day and closed with positive notes for the day Hourly Technicals: ...
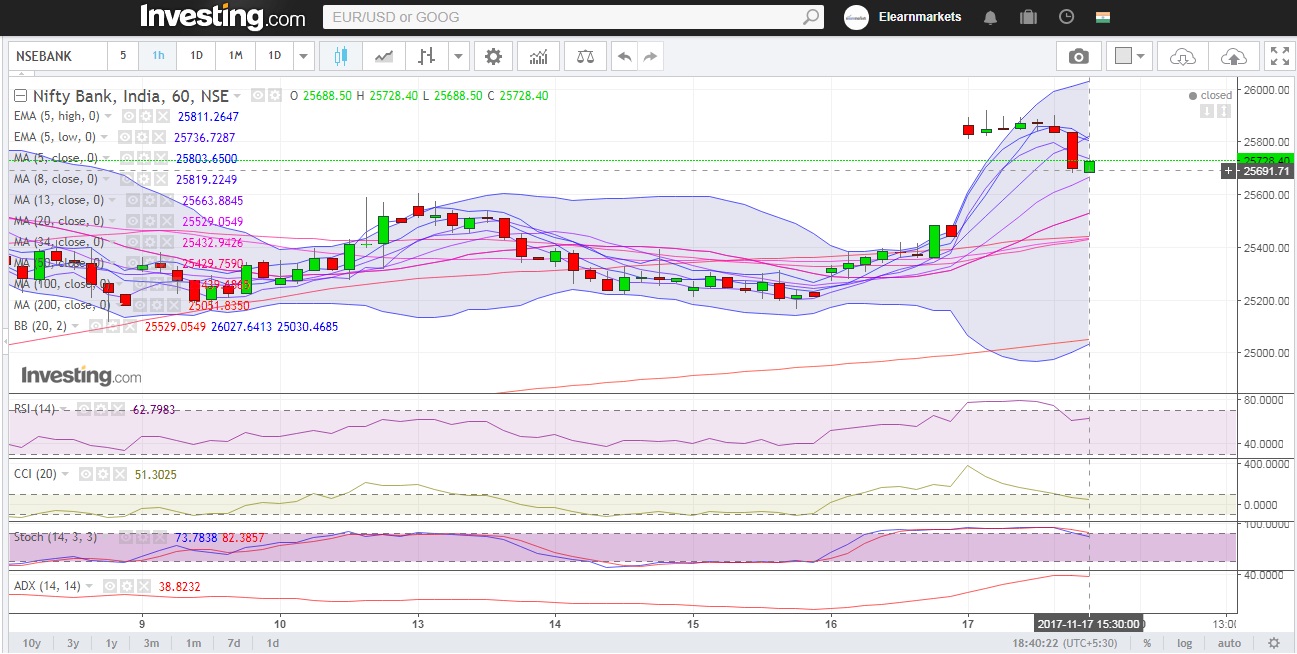
Bank Nifty opened above its 5 Day High EMA (25613 approx) today . The Index traded in a range of ...
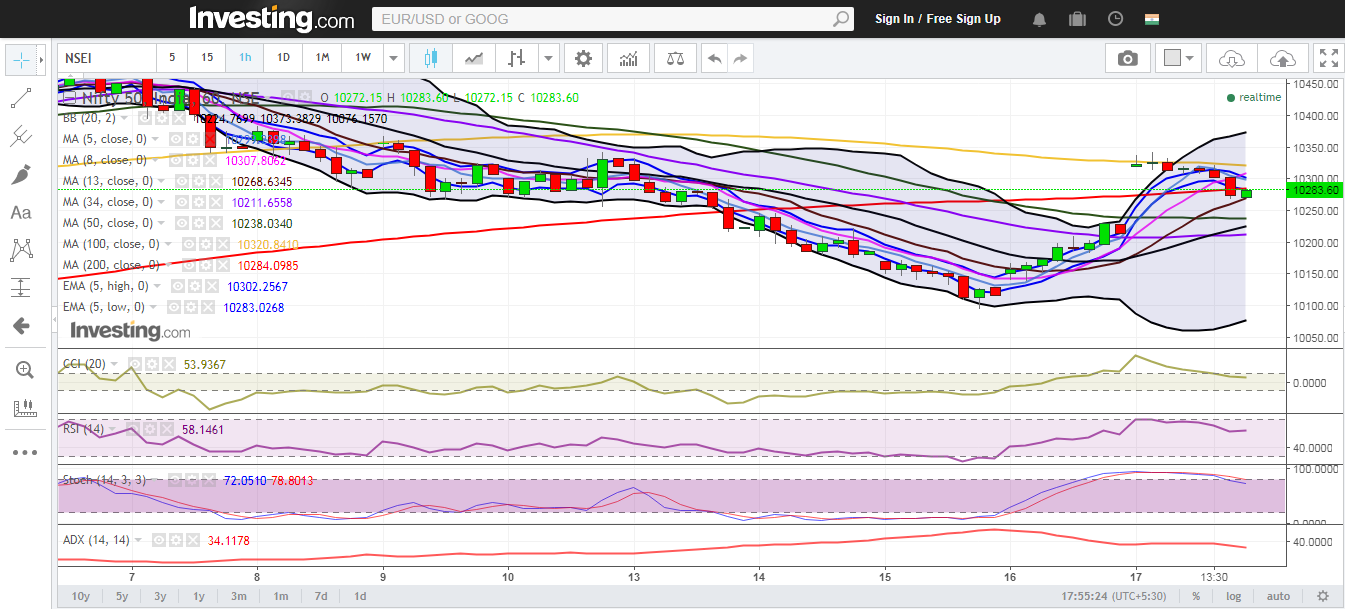
Nifty close 10283.6: For the first time in 14 years, Moody’s upgraded India’s sovereign debt rating from Baa3 to Baa2. ...

The alligator indicator developed by Bill Williams consists of three smoothed moving averages which help in identifying a trend and ...
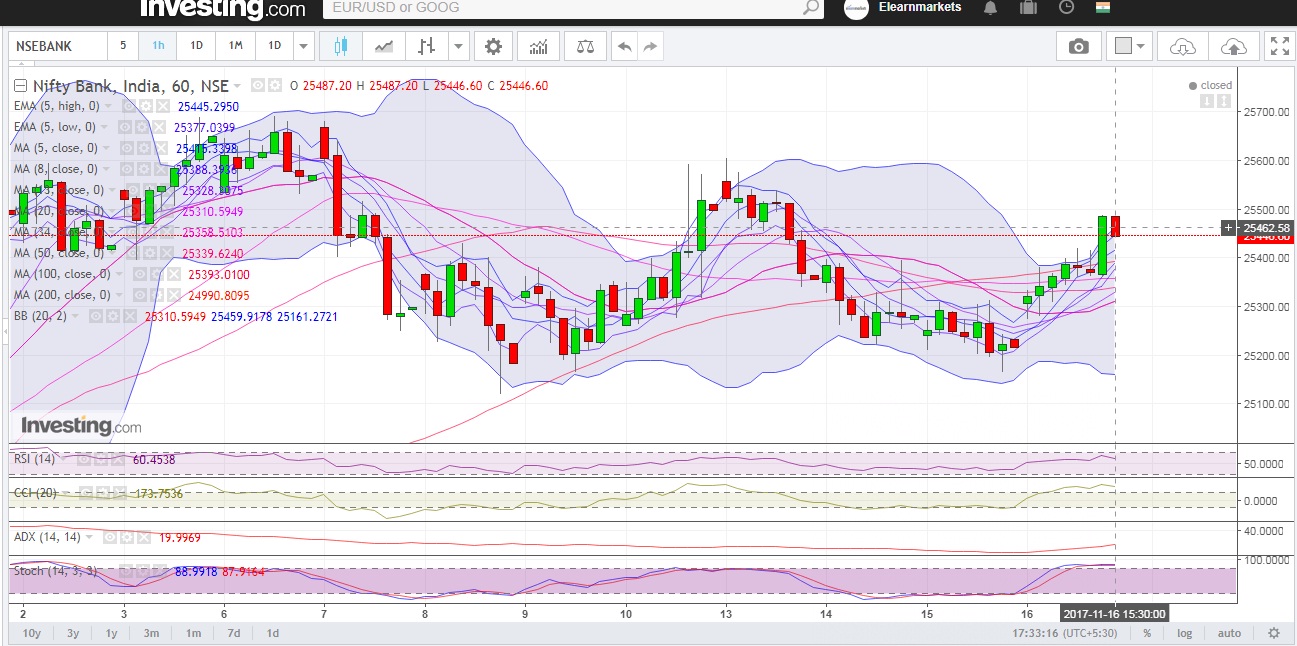
Bank Nifty opened above its 5 Day Low EMA (25237 approx) today . The Index traded in a range of ...
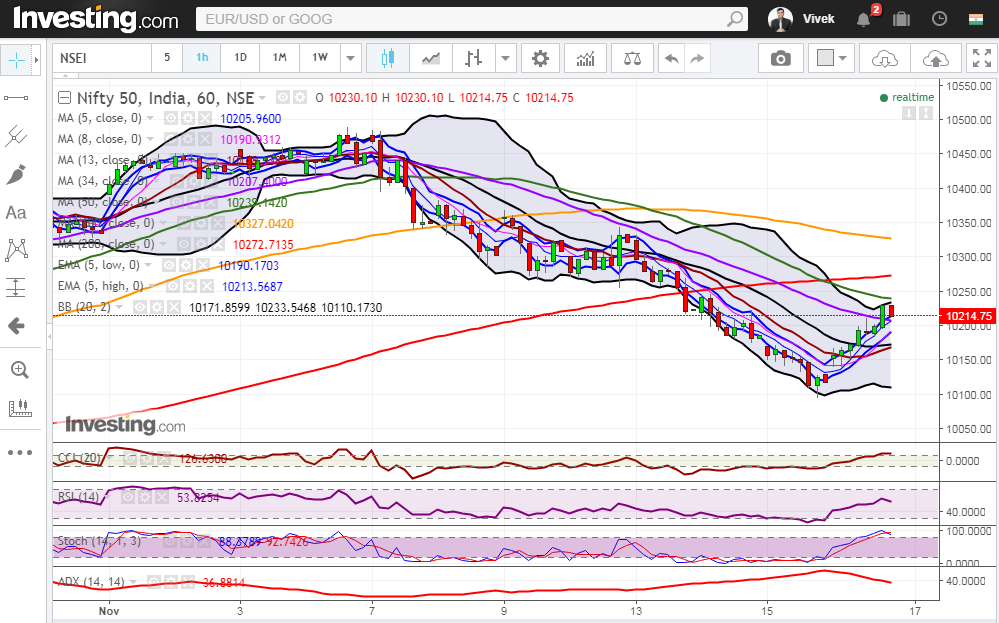
Nifty close 10214.8: The index rebounded sharply after three day of consecutive losses. As mentioned in last day’s Tech table ...
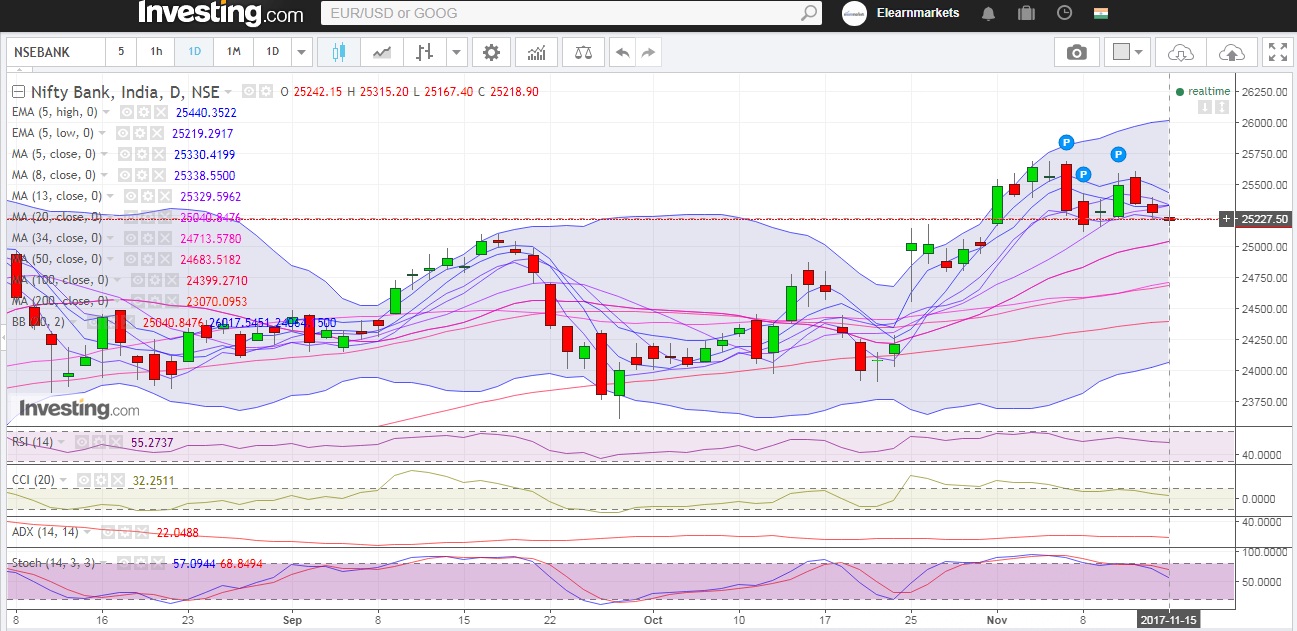
Bank Nifty opened above its 5 Day Low EMA (25219 approx) today . The Index traded in a range of ...
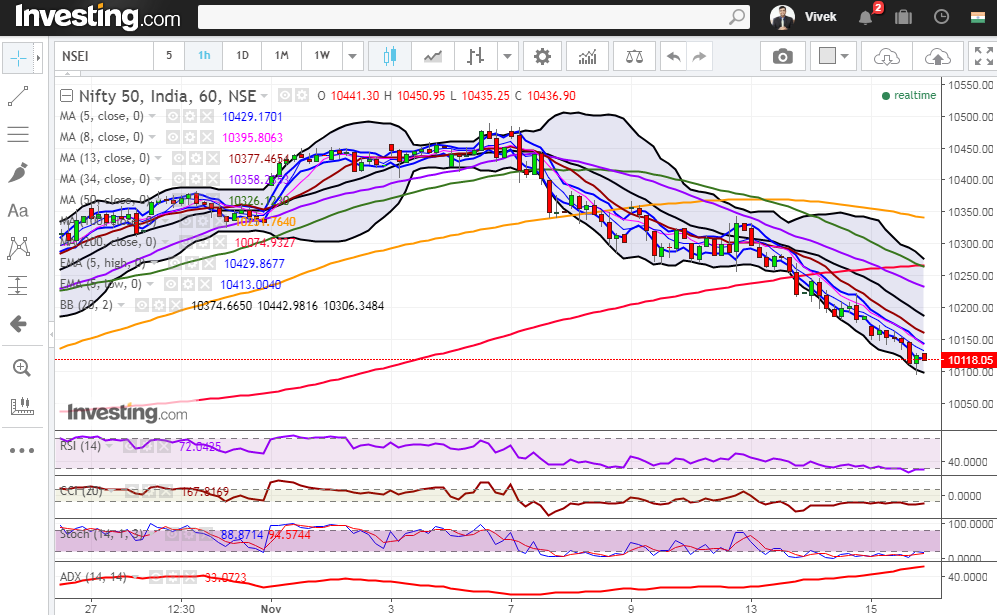
Nifty close: The index corrected more than 350 points from its record high last week and remained under pressure for ...
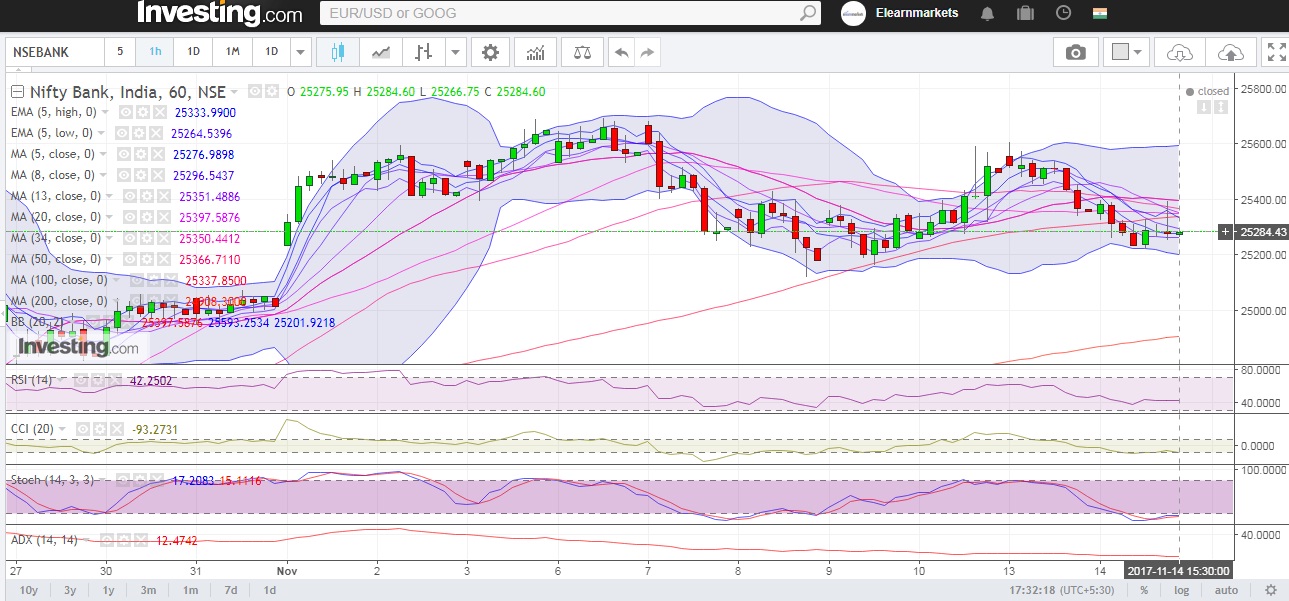
Bank Nifty opened above its 5 Day Low EMA (25351 approx) today. The Index traded in a range of 174 points and closed below its opening price. Hourly Technicals: In the Hourly Chart, Bank Nifty has closed above its 5 HMA of (25276 approx). The Index is likely to face immediate resistance above it's 5 hourly high EMA (25333 approx). Bank Nifty will find its next support around the 5 Hourly low EMA ( 25264 approx). Hourly RSI stands close to the lower end of the normal range while the CCI is indicating that sentiments are negative. ADX is indicating that Bank-Nifty might not undergo major volatility yet. Figure: Bank-Nifty Hourly Chart Daily Technicals: The daily chart indicates that Bank Nifty has closed marginally above its 5 day low EMA (25254 approx). The Index will face immediate resistance around its 8 DMA(25392 approx). On the downside, however, if Bank Nifty breaks and closes below its intraday low (25224 approx), it could find support at its 20 DMA (25012 approx). The daily RSI indicator has closed midway between the normal range. The CCI indicator, however, is indicating that sentiments are still positive. The ADX indicates that momentum might remain slack. Figure: Bank-Nifty Daily Chart Figure: Bank-Nifty Tech Table Watch ...