Key Takeaways:
- Developed by J. Welles Wilder, Jr. during the 1970s, helps to quantify the changes in price and their momentum.
- A failure swing bottom takes place when the price makes a lower low but RSI fails to make a lower low and rises above the recent swing high (fail point) of the indicator triggering a buy signal.
| Table of Contents |
|---|
| What is an RSI Failure Swing? |
| Types of RSI Failure Swing |
| How RSI failure swing is used? |
The Relative Strength Index or popularly called the RSI is one of the most popular momentum oscillators used by technical traders worldwide.
Developed by J. Welles Wilder, Jr. during the 1970s, the indicator helps to quantify the changes in price and its momentum.
The very fact, that the indicator is still in use and is a part of almost all the charting software packages out there speaks volumes about itself and brings us to the conclusion that solid logic never goes out of style! There are various ways of using the indicator.
Here we will discuss a special technique called the RSI Failure Swings that Wilder noted in his seminal work, New Concepts in Technical Trading Systems. He further added that “Failure Swings above 70 or below 30 are very strong indications of a market reversal.”
What is an RSI Failure Swing?
A Relative Strength Index Failure Swing is an advanced technique of trading RSI Divergences.
In the case of a Relative Strength Index divergence, both price and the indicator diverge from one another indicating loss of momentum in the trend.
In the case of an RSI failure swing, the same phenomenon takes place with a confirmation of trend change on a break of the fail point on the indicator. One can wait for a failure swing to emerge on the charts to take more confirmed trades.
Types of RSI Failure Swing:
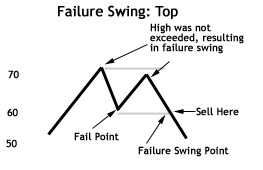
1. Failure Swing Top:
A failure swing top takes place when the price makes a higher high but RSI fails to make a higher high and falls below the recent swing low (fail point) of the indicator triggering a sell signal.
More importantly, during the first high RSI goes above the 70 overbought levels while during the second high, the indicator makes a swing high below the 70 overbought levels.
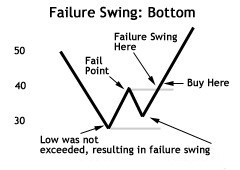
2. Failure Swing Bottom:
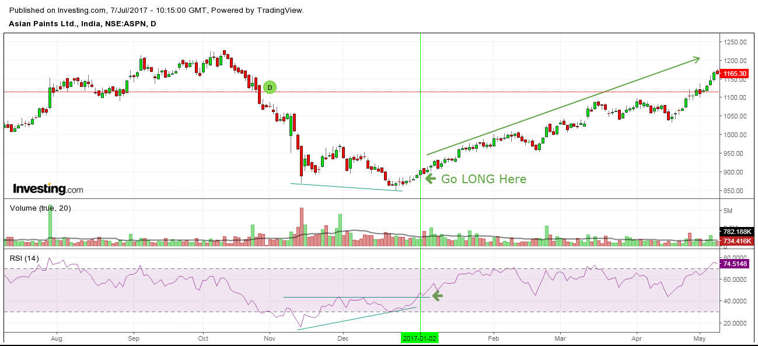
A failure swing bottom takes place when the price makes a lower low but RSI fails to make a lower low and rises above the recent swing high (fail point) of the indicator triggering a buy signal.
More importantly, during the first low RSI goes below the 30 oversold levels while during the second low, the indicator makes a swing low above the 30 oversold levels.
How RSI failure swing is used?
RSI failure swing is used for entering the positions by anticipating a trend reversal. This means that the position is taken against the current trend.
When the low swing is made by the indicator, before the swing failure in an uptrend or the peak which is formed just before the swing failure in a downtrend, then the entry point is signaled by this indicator.
In the uptrend, the trader can take a short position and in the downtrend, the trader can take a long position.
These points can also be used as the exit positions if you are already bought the stock in the uptrend or have shorted the stock in a downtrend.
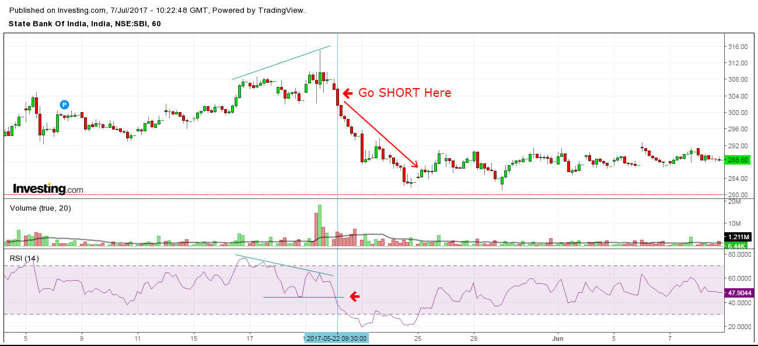
Let’s take a look at an example. On the following hourly chart of the State Bank of India, we can clearly see that the impending sell-off was foretold by the indicator.
Learn from Expert: Technical Trading Strategies with RSI Indicator
In the daily chart of Asian Paints, we can clearly see how the stock picked up steam after the failure swing bottom was formed on the RSI indicator.
To conclude, we can say that trading RSI failure swings could be a great way to trade off the charts that can have a positive impact on your portfolio.
Also, for traders who are unable to devote time to studying charts of all the securities, the scan section in the StockEdge mobile app, now also available in the web version, provides an easier way to track certain trade opportunities based on RSI absolute level or movement of RSI index.
The app provides an opportunity to club RSI strategy with other indicators, volume, and price patterns base strategies on an EOD basis.
To know more about the use of RSI and other technical indicators you may enroll in NSE Academy Certified Technical Analysis on Elearnmarkets.com

Tell us which is your favorite indicator writing in the comment box below.
Happy Learning!


Truly helpful!
Thank you for your valuable feedback.
Nice.
Thank you very much for your valuable feedback.
Agree with some part of this post but have a major point to raise.
RSI divergence gives us a heads-up on possible price change. RSI break out doesn’t always predict price breakout. Always make sure sure that price will make a higher high when RSI formed the divergence for long position. The opposite goes for taking a short position. The article failed to mention this important point!
It works very well. Thanks for sharing the strategy.
Hi,
Thank you for reading!
Keep Reading!
Thanks a lot. This is great content. I might share some for you guys too. Great work poster!