
A wedge pattern is a type of chart pattern that is formed by converging two trend lines. Wedges are the type of continuation as well as the reversal chart patterns.
Wedges can be Rising Wedges or Falling wedges depending upon the trend in which they are formed.
Rising Wedges form after an uptrend and indicate a bearish reversal and Falling Wedges forms after a downtrend indicate a bullish reversal.
Let us discuss these two types of wedges and how to trade with them:
Table of Contents
What is a Rising Wedge Pattern?
A rising wedge is formed by two converging trend lines when the stock’s prices have been rising for a certain period.
Before the line converges the sellers come into the market and as a result, the prices lose their momentum.
This results in the breaking of the prices from the upper or the lower trend lines but usually, the prices break out in the opposite direction from the trend line.
Depending upon the location of the rising wedges it indicates whether the trend will continue or reverse:
Rising Wedges in Uptrend
The rising wedge in an uptrend indicates a reversal of the downtrend. It is formed when the prices are making Higher Highs and Higher Lows compared to the previous price movements.
It gives traders opportunities to take short positions in the market.
Rising Wedges in Downtrend
The Rising Wedge in the downtrend indicates a continuation of the previous trend. It is formed when the prices are making Higher Highs and Higher Lows compared to the previous price movements.
It gives traders opportunities to average or take short positions in the market.
What is a Falling Wedge Pattern?
A falling wedge is formed by two converging trend lines when the stock’s prices have been falling for a certain period.
Before the line converges the buyers come into the market and as a result, the decline in prices begins to lose its momentum. This results in the breaking of the prices from the upper trend line.
Depending upon the location of the falling wedges indicates whether the trend will continue or reverse:
Falling Wedges in Uptrend
The Falling Wedge in the Uptrend indicates the continuation of an uptrend. It is formed when the prices are making Lower Highs and Lower Lows compared to the previous price movements.
It gives traders opportunities to take buy positions or average their position in the market.
Falling Wedges in Downtrend
The Falling Wedge in the downtrend indicates a reversal to an uptrend. It is formed when the prices are making Lower Highs and Lower Lows compared to the previous price movements.
It gives traders opportunities to take buy positions in the market.
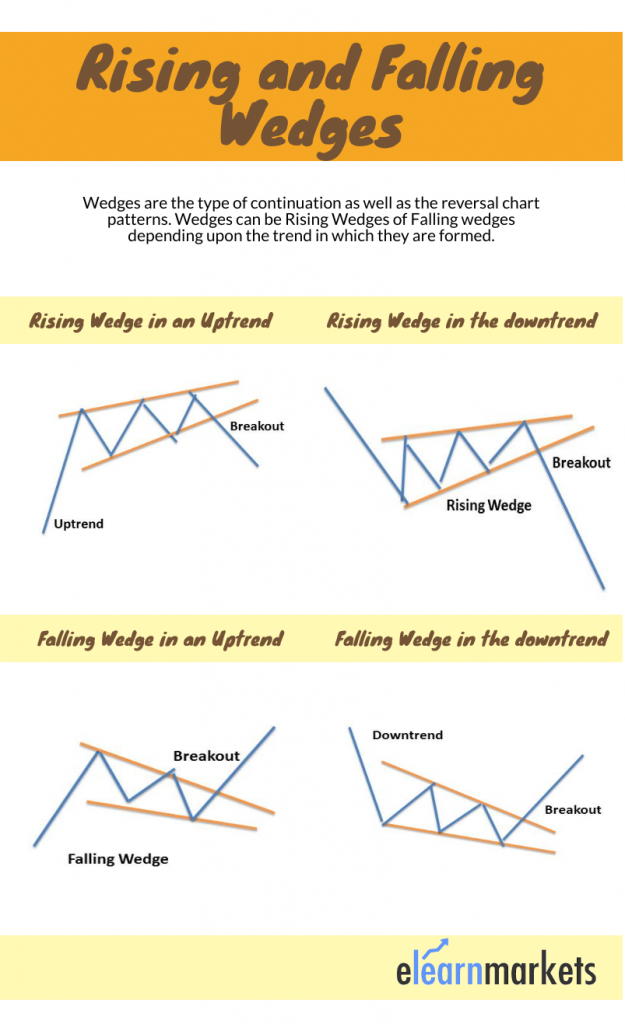
Formation of the Rising and Falling Wedge Pattern
Below is the formation of the Rising and Falling Wedge pattern in the uptrend and downtrend:
Trading with Rising Wedge Pattern
Below is an example of a Rising Wedge formed in the downtrend in the Daily chart of Sundaram Finance Ltd.
The below-converging line can be called the support line. When the prices break from the support line then the continuation of the downtrend.
Stop Loss
Stop-loss can be placed at the upper side of the rising wedge line.
Price Target
The price target is equal to the height of the back of the wedge.
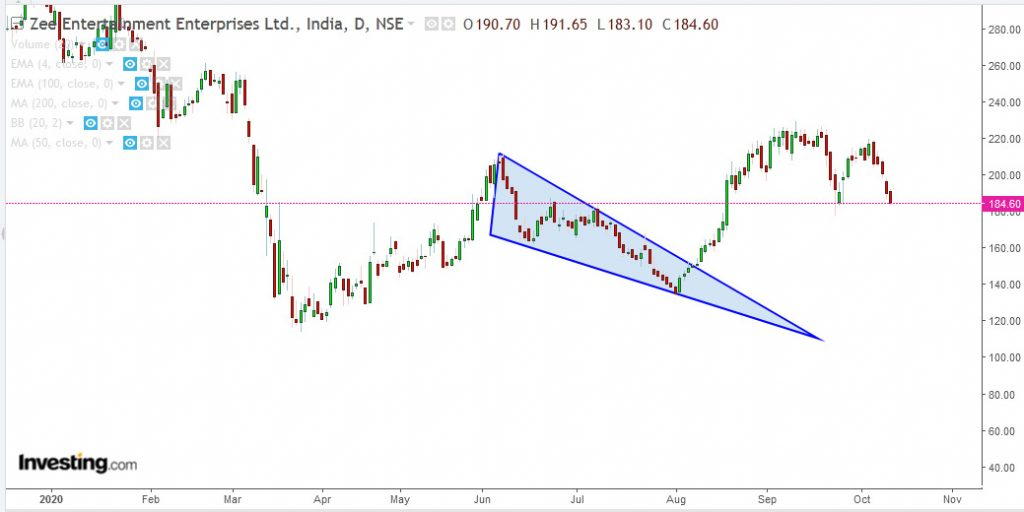
Trading with Falling Wedge Pattern
Below is an example of a Falling Wedge formed in the uptrend in the Daily chart of Zee Entertainment Enterprises Ltd.
The traders should take a long position when the prices break above the upper converging trend line.
Stop Loss
Stop-loss can be placed at the bottom side of the falling wedge line.
Price Target
The price target is equal to the height of the back of the wedge.
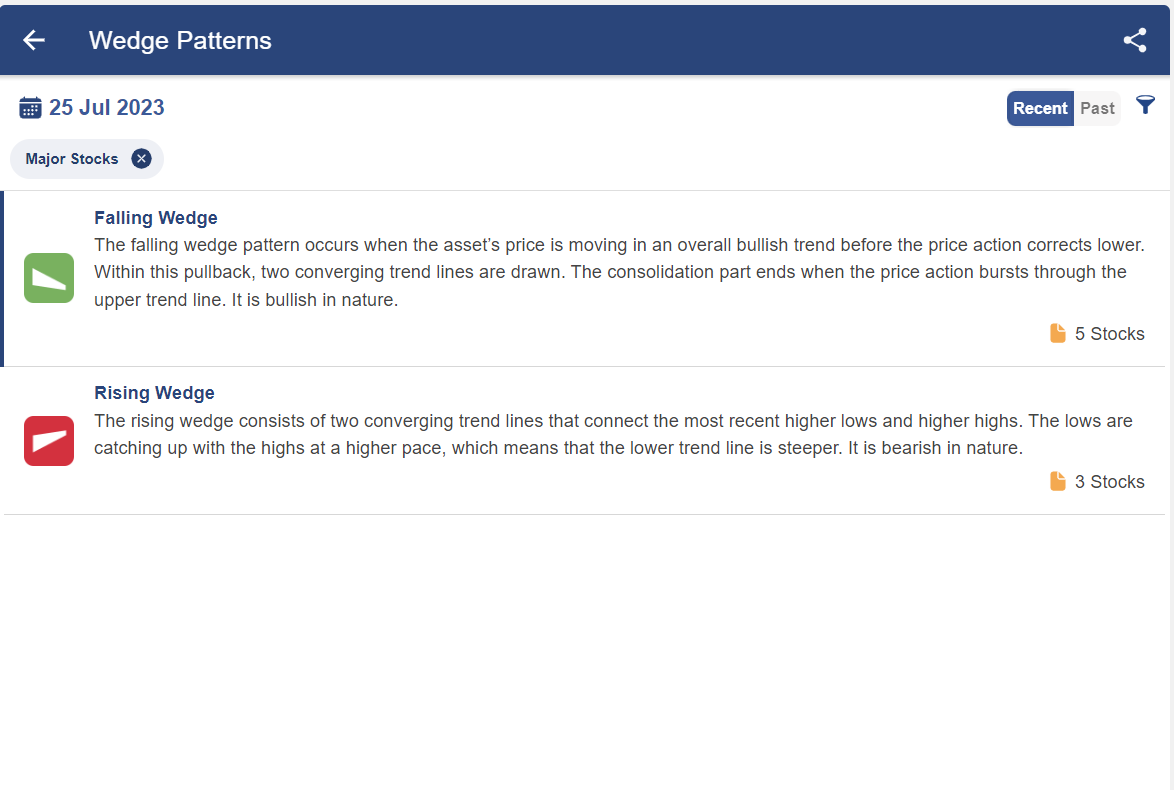
How to filter Stocks using this Chart Pattern Screener?
There are so many stocks in which this chart pattern is formed and it is difficult for traders to look at the charts of more than 500 stocks for finding this pattern.
So, with the help of StockEdge, one can filter out stocks in which this chart pattern is formed:
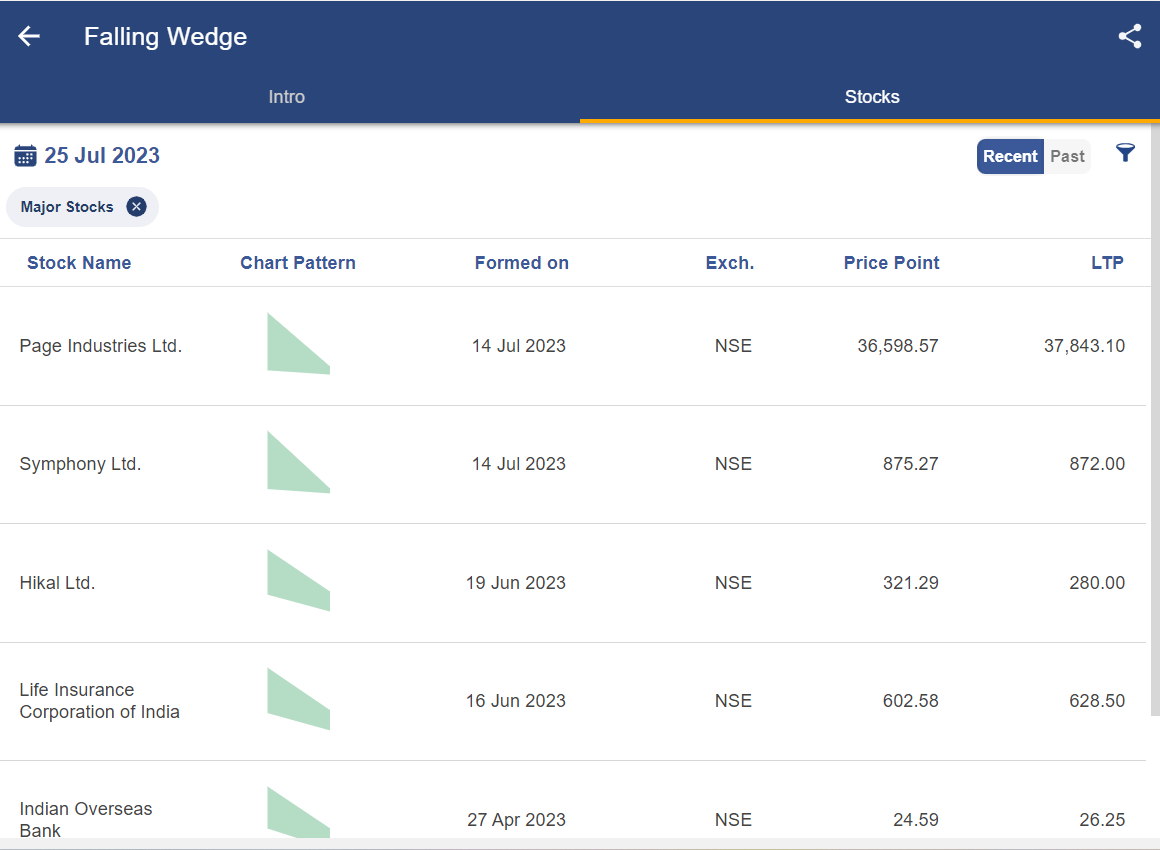
After clicking on the falling wedge, you will get a list of stocks in which this pattern is formed:

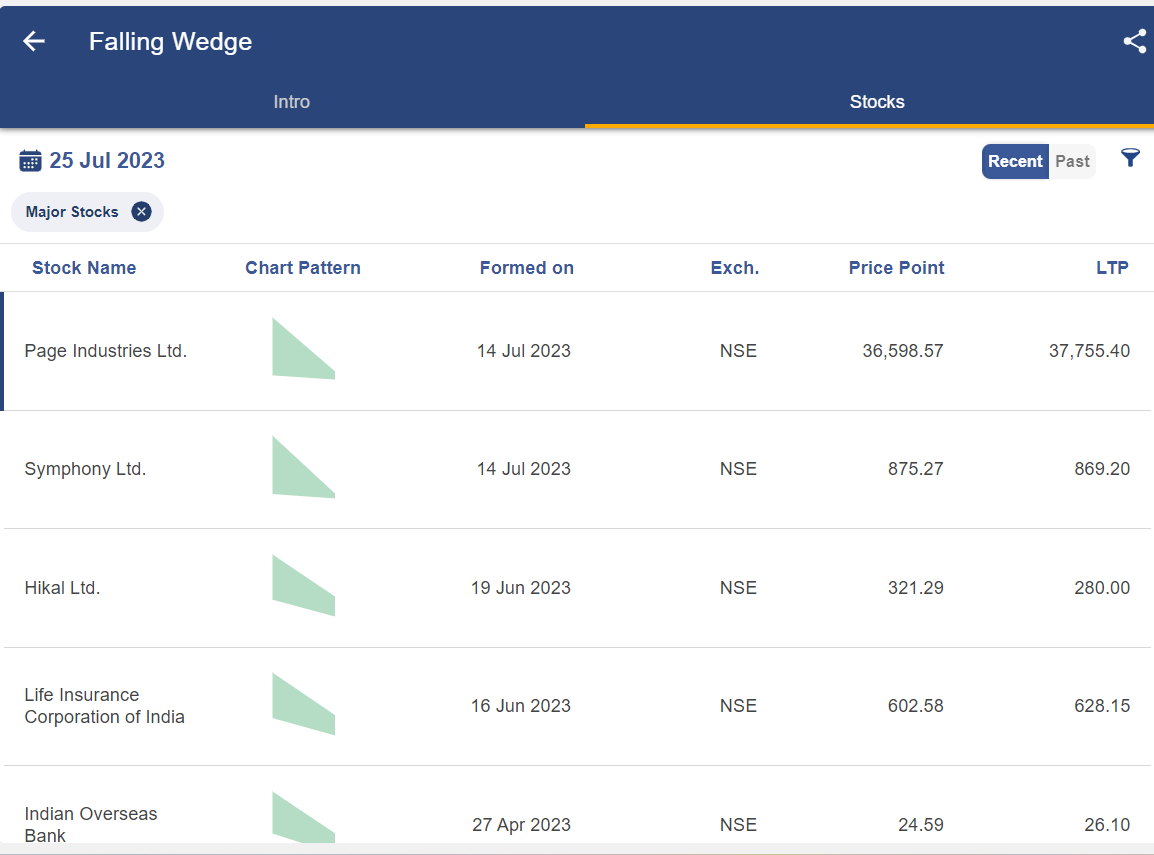
After clicking on any of the above stocks, you will get a technical chart showing the pattern below:
Once you have identified this chart pattern in the stocks, you can trade accordingly as discussed above.
Bottomline
Wedges are the type of continuation as well as the reversal chart patterns. A rising wedge is formed by two converging trend lines when the stock’s prices have been rising for a certain period. A falling wedge is formed by two converging trend lines when the stock’s prices have been falling for a certain period. The price target is equal to the height of the back of the wedge.
Frequently Asked Questions
What is bearish wedge pattern?
The Rising Wedge is a bearish pattern that begins wide at the bottom and contracts as prices move higher and the trading range narrows
Is wedge up or down?
The wedge can be both up or depending on the trend in which they are formed.
What is a bullish wedge pattern?
The Falling Wedge is a bullish pattern that begins wide at the top and contracts as prices move lower
How do you differentiate between a wedge and a triangle chart pattern?
A Wedge is similar to a Triangle, the main difference between the two patterns is the inclination of the two lines and the pattern itself: all the lines are inclined either upwards or downwards.


